The community types of the American Communities Project were created by analyzing demographic data — items including age, race, income, and education — but the counties themselves are geographic entities and those physical locations matter. Some places are arid, some are rainy. Some are flat and largely empty, tailor-made for agriculture, others face unique environmental challenges.
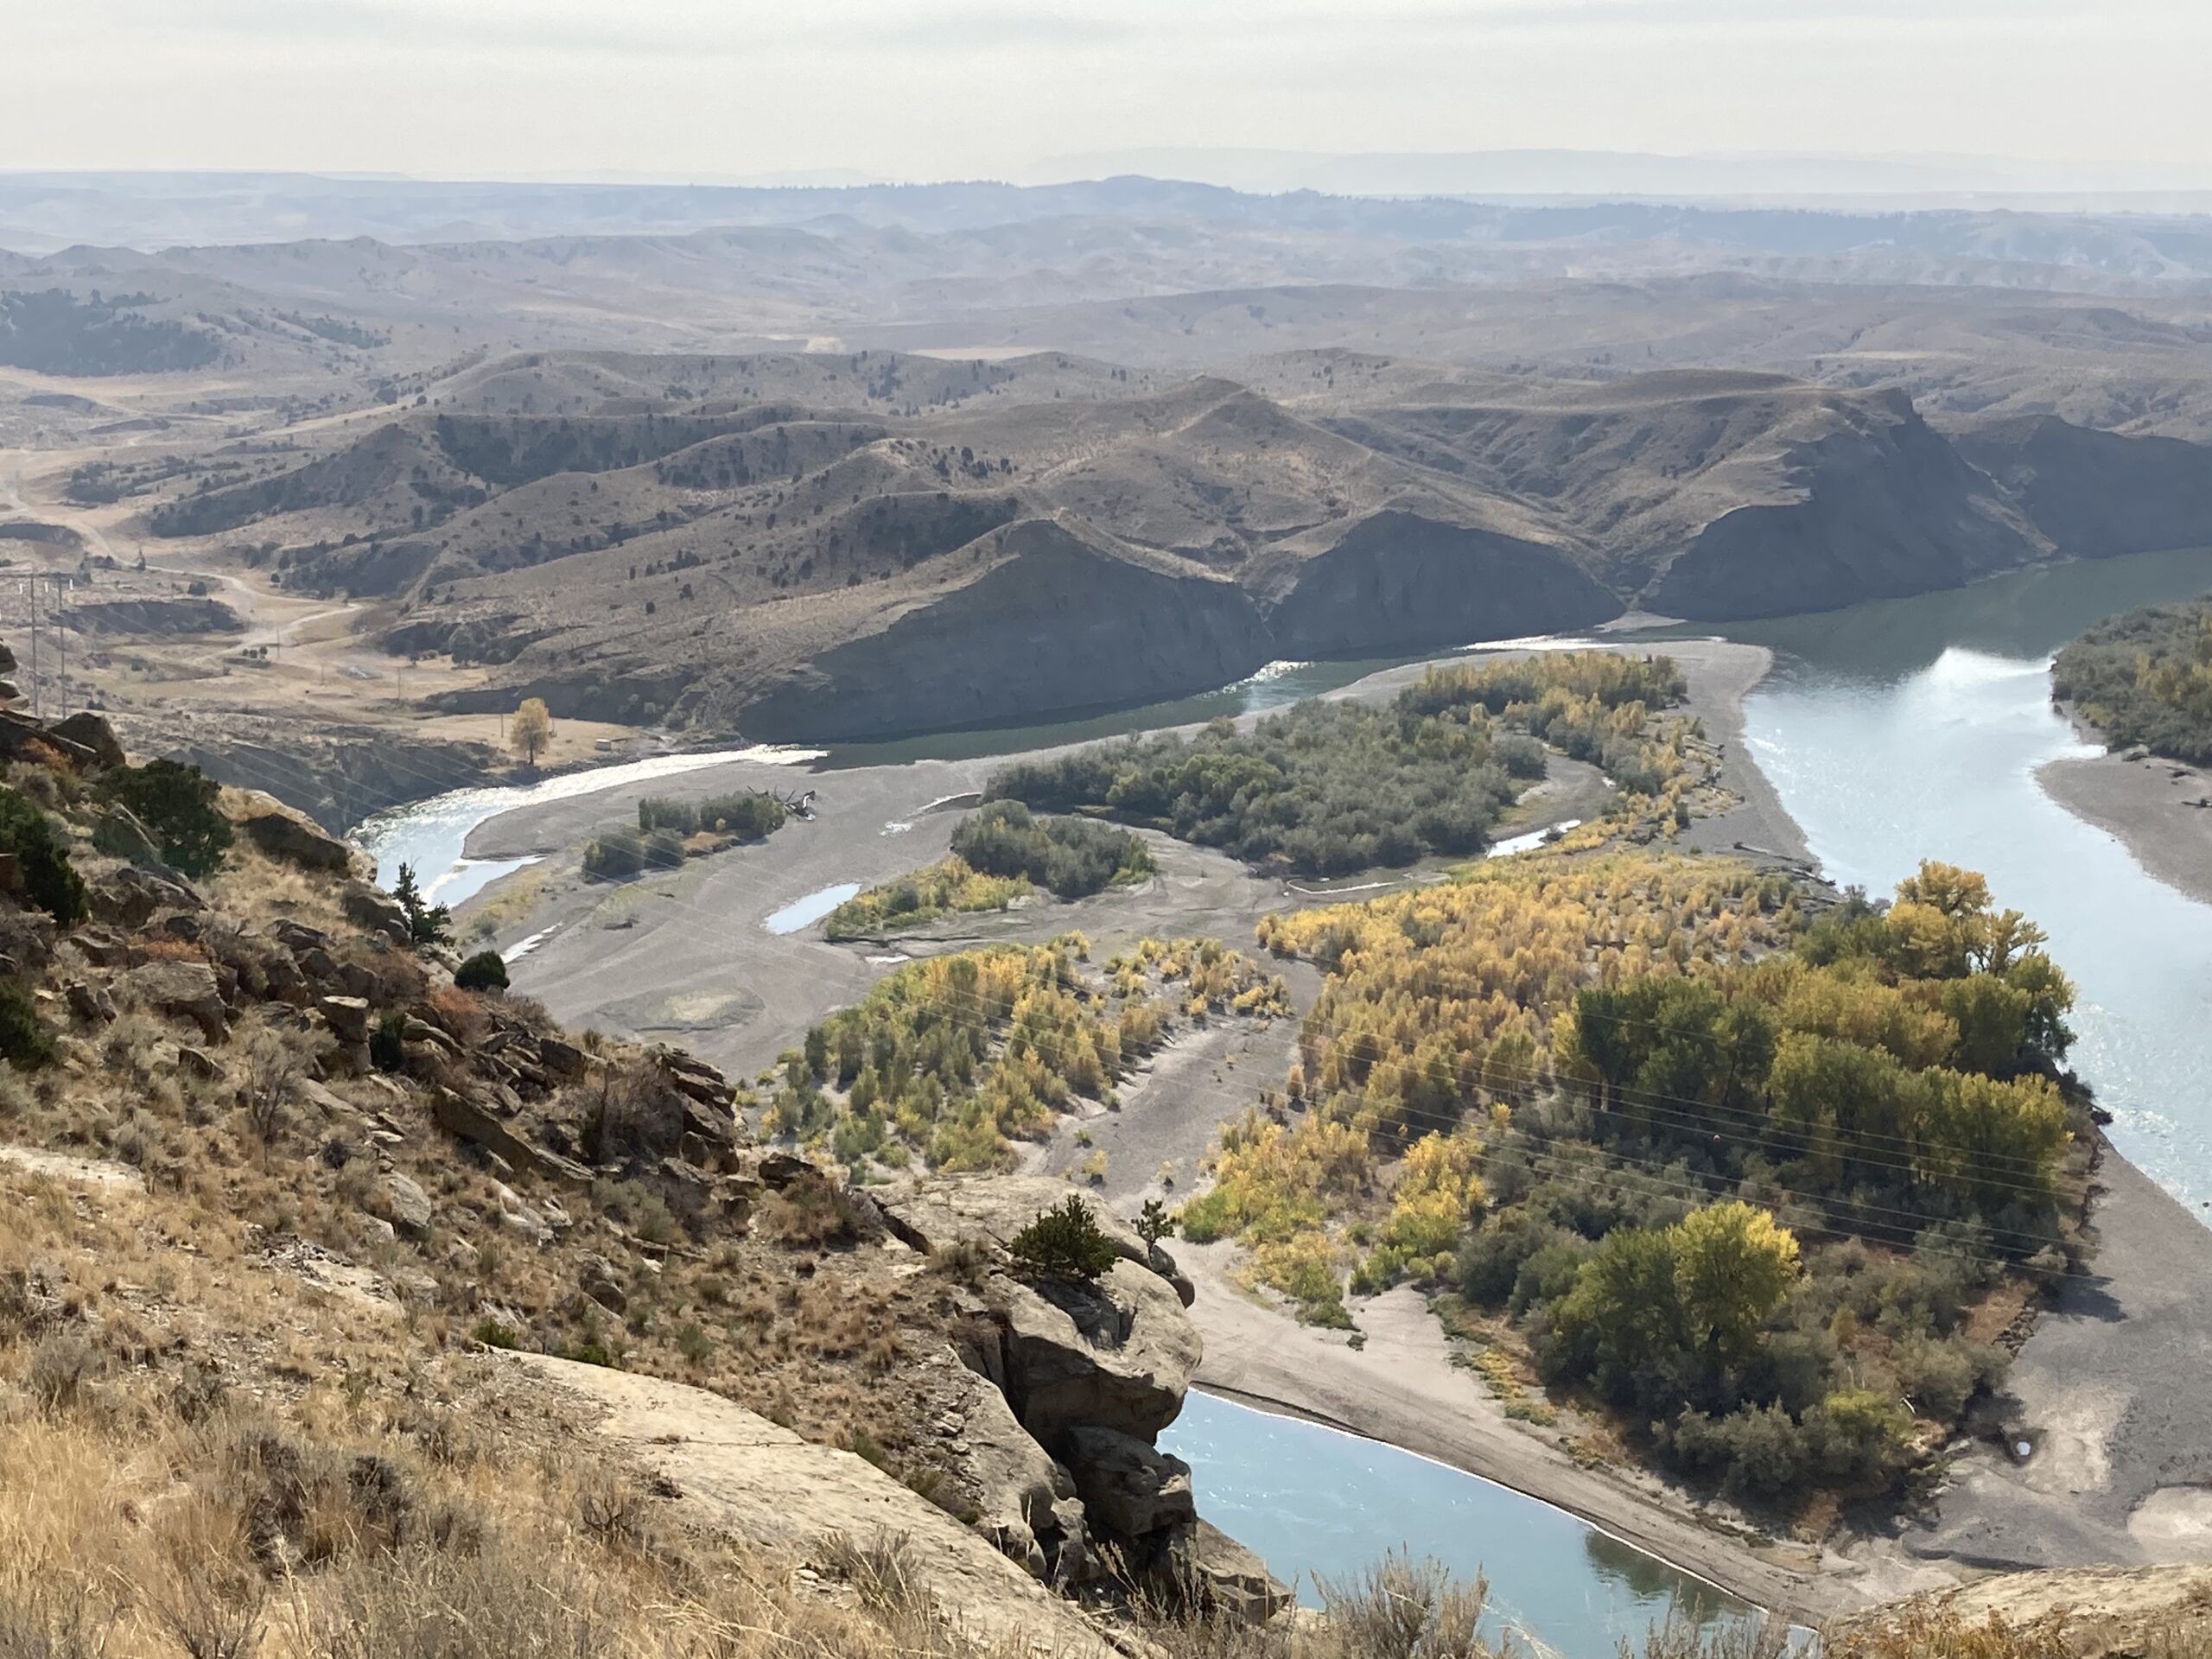
To explore how those physical realities tie into demographic and cultural differences, the ACP is working with the University of Maryland’s (UMD) Department of Geographical Sciences on a grant from NASA’s Earth Science Applications: Equity and Environmental Justice program to examine how experiences of environmental distress over time interact with other socioeconomic challenges on tribal lands. The ACP/UMD team aims to identify how environmental justice (EJ) issues may contribute to social distress and premature mortality in American communities. The focus for the work will be Native American Lands communities in Montana.
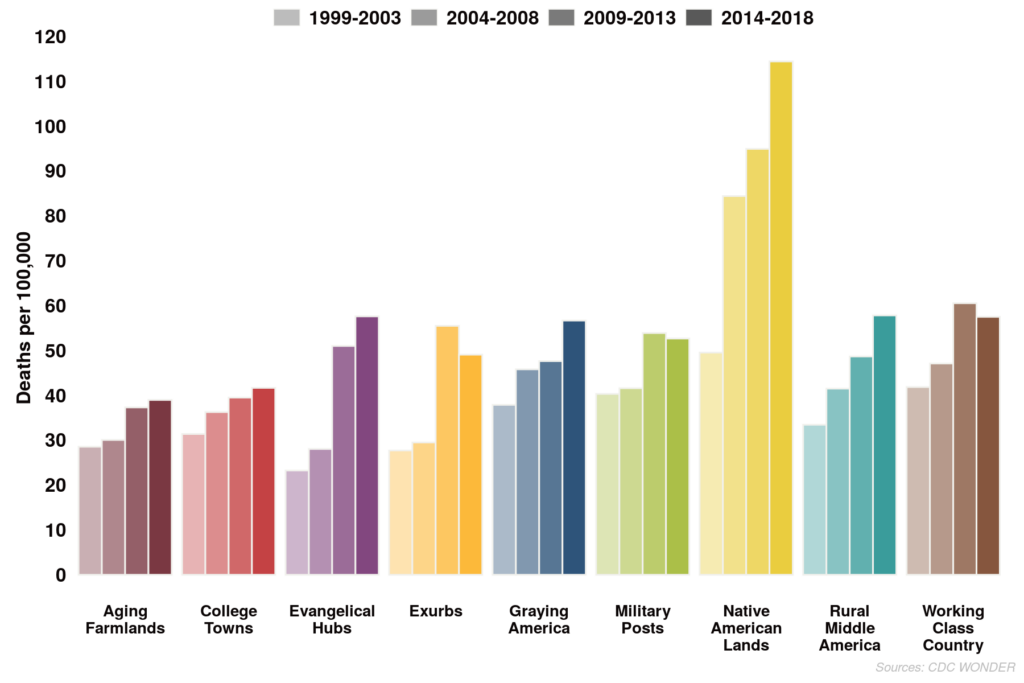
The economists Anne Case and Angus Deaton coined the term “deaths of despair” to refer to premature mortality caused by suicide, alcohol, and drug use in America. They found these deaths to be steadily increasing since 1999 among middle-aged White Americans without a college degree, a stark contrast to declining mortality rates among Black and Hispanic Americans. But the ACP’s analysis of the data showed Native American communities in particular faced much higher than average Deaths of Despair since the epidemic grew in the 2000s. The chart below shows the Deaths of Despair across the community types in Montana from 1999–2018
With the new grant, the ACP and Silva’s team will combine publicly available Earth Science information (ESI) — environmental data from equipment such as remote sensors — with the socioeconomic data the ACP has gathered to find areas where environmental hardship may contribute to (and result from) forms of socioeconomic distress that are linked to Deaths of Despair in Native American Lands counties.
Those counties, in particular, are places where the ties between community, identity, and the natural environment are especially strong and where environmental justice challenges are many. However, as in other research on American Deaths of Despair, no environmental data was used in the ACP analysis, an omission the project aims to address.
The group will merge the environmental and socioeconomic data, looking for correlations and building visualizations to show potential impacts and areas needing further study. They will also compare the patterns and dynamics observed within and between Native American Lands as well as with other community types in the ACP typology.
The team will then go further, taking what they learn from that analysis out into the field in Native American Lands counties in Montana to see what those data look like in the real world and how the communities are addressing the challenges they face.
The project will further NASA’s goal to advance EJ in underserved American communities through the use of publicly available ESI by 1) enhancing existing methodologies to document environmental inequities and their impacts on human well-being and; 2) developing new insights into the dynamic intersections between EJ challenges and socioeconomic struggles. Collaborative efforts between social and Earth scientists and ACP journalists with an expertise in relaying complex information to non-technical audiences will enable the research team to communicate project findings to the general public. In addition to being published in academic journals, the project’s findings will appear on the ACP website as well as other outlets affiliated with project partners.
Two trends have held across communities: The automobile was the most popular kind of vehicle driven and errands were the most popular reason for driving, according to the fall 2021 MRI-Simmons survey broken into the 15 county types in the American Communities Project. In this breakdown, a variety of rural communities held an outsized preference for driving trucks. Affluent Exurbs as well as middle-income Aging Farmlands and LDS Enclaves were more likely to report commuting to work as a primary reason for driving. Clearly, communities of all sizes felt the economic pain of sky-high gas prices in the past year.
Licensed Drivers Across Communities
Nationwide, more than 90% (92%) of Americans age 18 and above said they have a valid driver’s license, according to the latest MRI-Simmons survey. There is general unity across the 15 types, with most near the 100 average index score. Standing out are the Aging Farmlands, among the most sparsely populated types of places, based in the Central and Great Plains. With a score of 106, residents are 6% more likely than average to have a driver’s license.
What Kind of Vehicle
When it comes to the type of vehicle driven, the most popular fit into three broad categories: automobile (72%), sport/utility vehicle (21%), and regular pick-up (11%). The next three fell much below that, but rank more likely than average in certain kinds of places. Overall, 4% of Americans reported that they drive a minivan, 3% a motorcycle, and 3% a heavy duty truck.
Rural communities throughout the country have distinct tastes in vehicles. For instance, middle-income Aging Farmlands and lower-income Native American Lands said they drive heavy duty trucks at more than two times the average. Middle-income LDS Enclaves and Rural Middle America as well as lower-income Working Class Country and Evangelical Hubs were also more than 50% above average to drive these.
Regular pick-ups were another type popular in these parts. Evangelical Hubs, Rural Middle America, Working Class Country, and Aging Farmlands all stood at least 50% above average.
The minivan was at least 20% more likely to be driven than average in a mix of rural and suburban communities: Aging Farmlands, Evangelical Hubs, Rural Middle America, Working Class Country, Middle Suburbs, and Exurbs. Among the communities, Exurbs stand out for having a growing child population, according to the American Communities Project's analysis of the 2020 census.
Why People Drive
The No. 1 primary reason Americans said they drive is to run errands at 58%. Coming in neck-and-neck for second and third were leisure at 47% and commute to work at 46%. The rural western LDS Enclaves and Aging Farmlands as well as Graying America stood out for above average scores for errands and leisure. Aging Farmlands, Exurbs, and LDS Enclaves stood out for above average scores on commuting to work.
Driving Distance in a Year
On miles driven, the most popular amounts fell into three categories: 16% of Americans said they drove between 10,000 and 14,999 miles in the last 12 months, 13% said between 5,000 and 7,999 miles, and 13% said between 1,000 and 2,999.
Perhaps not surprisingly, residents of middle-income rural white communities — Aging Farmlands and Rural Middle America — reported driving more miles than average. The affluent Exurbs were also notably more likely than average to drive more. Rural communities of color — the African American South and Hispanic Centers — were less likely than average to drive more miles.
It’s difficult to deny the power of social media in the United States in 2023. As smartphones have become ubiquitous, so has the posting, reading, and sharing of social media content. A recent survey from MRI-Simmons, a consumer research firm, found that 84% of Americans visited or used the sites in the last year.
But not all social media outlets are created equal in the eyes of consumers. That same survey showed wide differences by social media site and by community type in the American Communities Project.
In short, depending on what site you rely on most heavily, the people filling your daily diet of content can come from different backgrounds and experiences.
Who Goes Where Online
To be sure, social media is a “curated experience” from the start. Users choose who they “follow” or who their “friends” are, but those curated groups come from a universe of self-selected participants. And looked at through the lens of the 15 ACP county types, interesting patterns emerge.
Twitter’s User Group is Relatively Small and Urban
Over the last few months, Twitter has received a lot of attention in the news after the platform was purchased by the billionaire owner of Tesla, Elon Musk. The platform has played a major role in national politics, particularly where former President Donald Trump is concerned.
Trump used the outlet as a megaphone for his views on a wide range of political and cultural topics at all hours and was “permanently suspended” from app after the January 6, 2021, insurrection for violating Twitter’s Glorification of Violence policy. He is about to be reinstated by Musk.
But looking at the chart, two things stand out about Twitter.
First, the percentage of Americans who use the platform is relatively low when compared to other well-known social media sites. Overall, 64% of Americans say they use Facebook and 37% say they use Instagram while only 18% say they use Twitter.
Second, when you look at the chart above, there are noticeable gaps between the most urban and the most rural types. The percentage of adults using the platform is 20% or more only in the ACP’s two most urban and types — the Big Cities and Urban Suburbs, which also have large numbers of college degrees. The Exurbs, which tend to be wealthy and well-educated, are next at 18%. Meanwhile, some of the ACP’s least populous types, the Aging Farmlands, Native American Lands, and Working Class Country, are all at 13% or lower.
There’s nothing bad about that, of course, unless you hope you are getting a balanced collection of views of the site. All social media by its very nature connects you to a subset of views, but Twitter, in particular, connects you to a subset of a subset.
In addition, while some on the political right complain that Twitter is “too liberal,” the ACP data suggests there may be some reason for that. If the users create the content and users tend to be more heavily based in urban areas that lean Democratic, a leftward lean may not be a big surprise. (Close to half the nation’s population lives in the Big Cities and Urban Suburbs).
Facebook Still Dominates — Everywhere
The data for Facebook tells the opposite story. More than 60% of the adults in every one of the 15 ACP community types says they use Facebook. In a country that is divided on a long list of issues and that has few common meeting spaces, those are somewhat remarkable numbers.
And Facebook has a higher percentage of users in the ACP’s more rural communities. Almost three-quarters of the adults in the Aging Farmlands say they use the platform. The number is 69% in Working Class Country counties.
The most urban communities use the platform less — 62% in the Big Cities and Urban Suburbs and 64% in the Exurbs.
Of course, that doesn’t mean that those city folk and country folk are all reading the same content. Self-selection, “friends,” and algorithms are a huge part of any social media experience, as The Wall Street Journal explored in 2016. But it does mean that, as a whole, Facebook’s audience is much more representative, and probably more diverse, than Twitter’s audience.
And that’s even more true for Facebook in a broader sense when you look at its parent company, Meta, and who uses Instagram, another social media platform it owns. More adults use Instagram, the image-based social media platform, than Twitter in every community type, and the more urban communities are more likely to use it than their rural counterparts.
Fragmentation is the Rule
This is just a cursory analysis of these platforms. There is no measure here of power users or regular posters and no measure of news consumption or mis- or disinformation. And information fragmentation is very much a way of life in America in 2023.
Long gone are the days of three TV networks and local newspapers. Gone, too, are the days of “57 channels and nothing on.” In a world of millions of “channels” on the web, common views and experiences are hard to find in the United States.
But even within the targeted and niche world of social media, there are big differences in platform use across American communities.
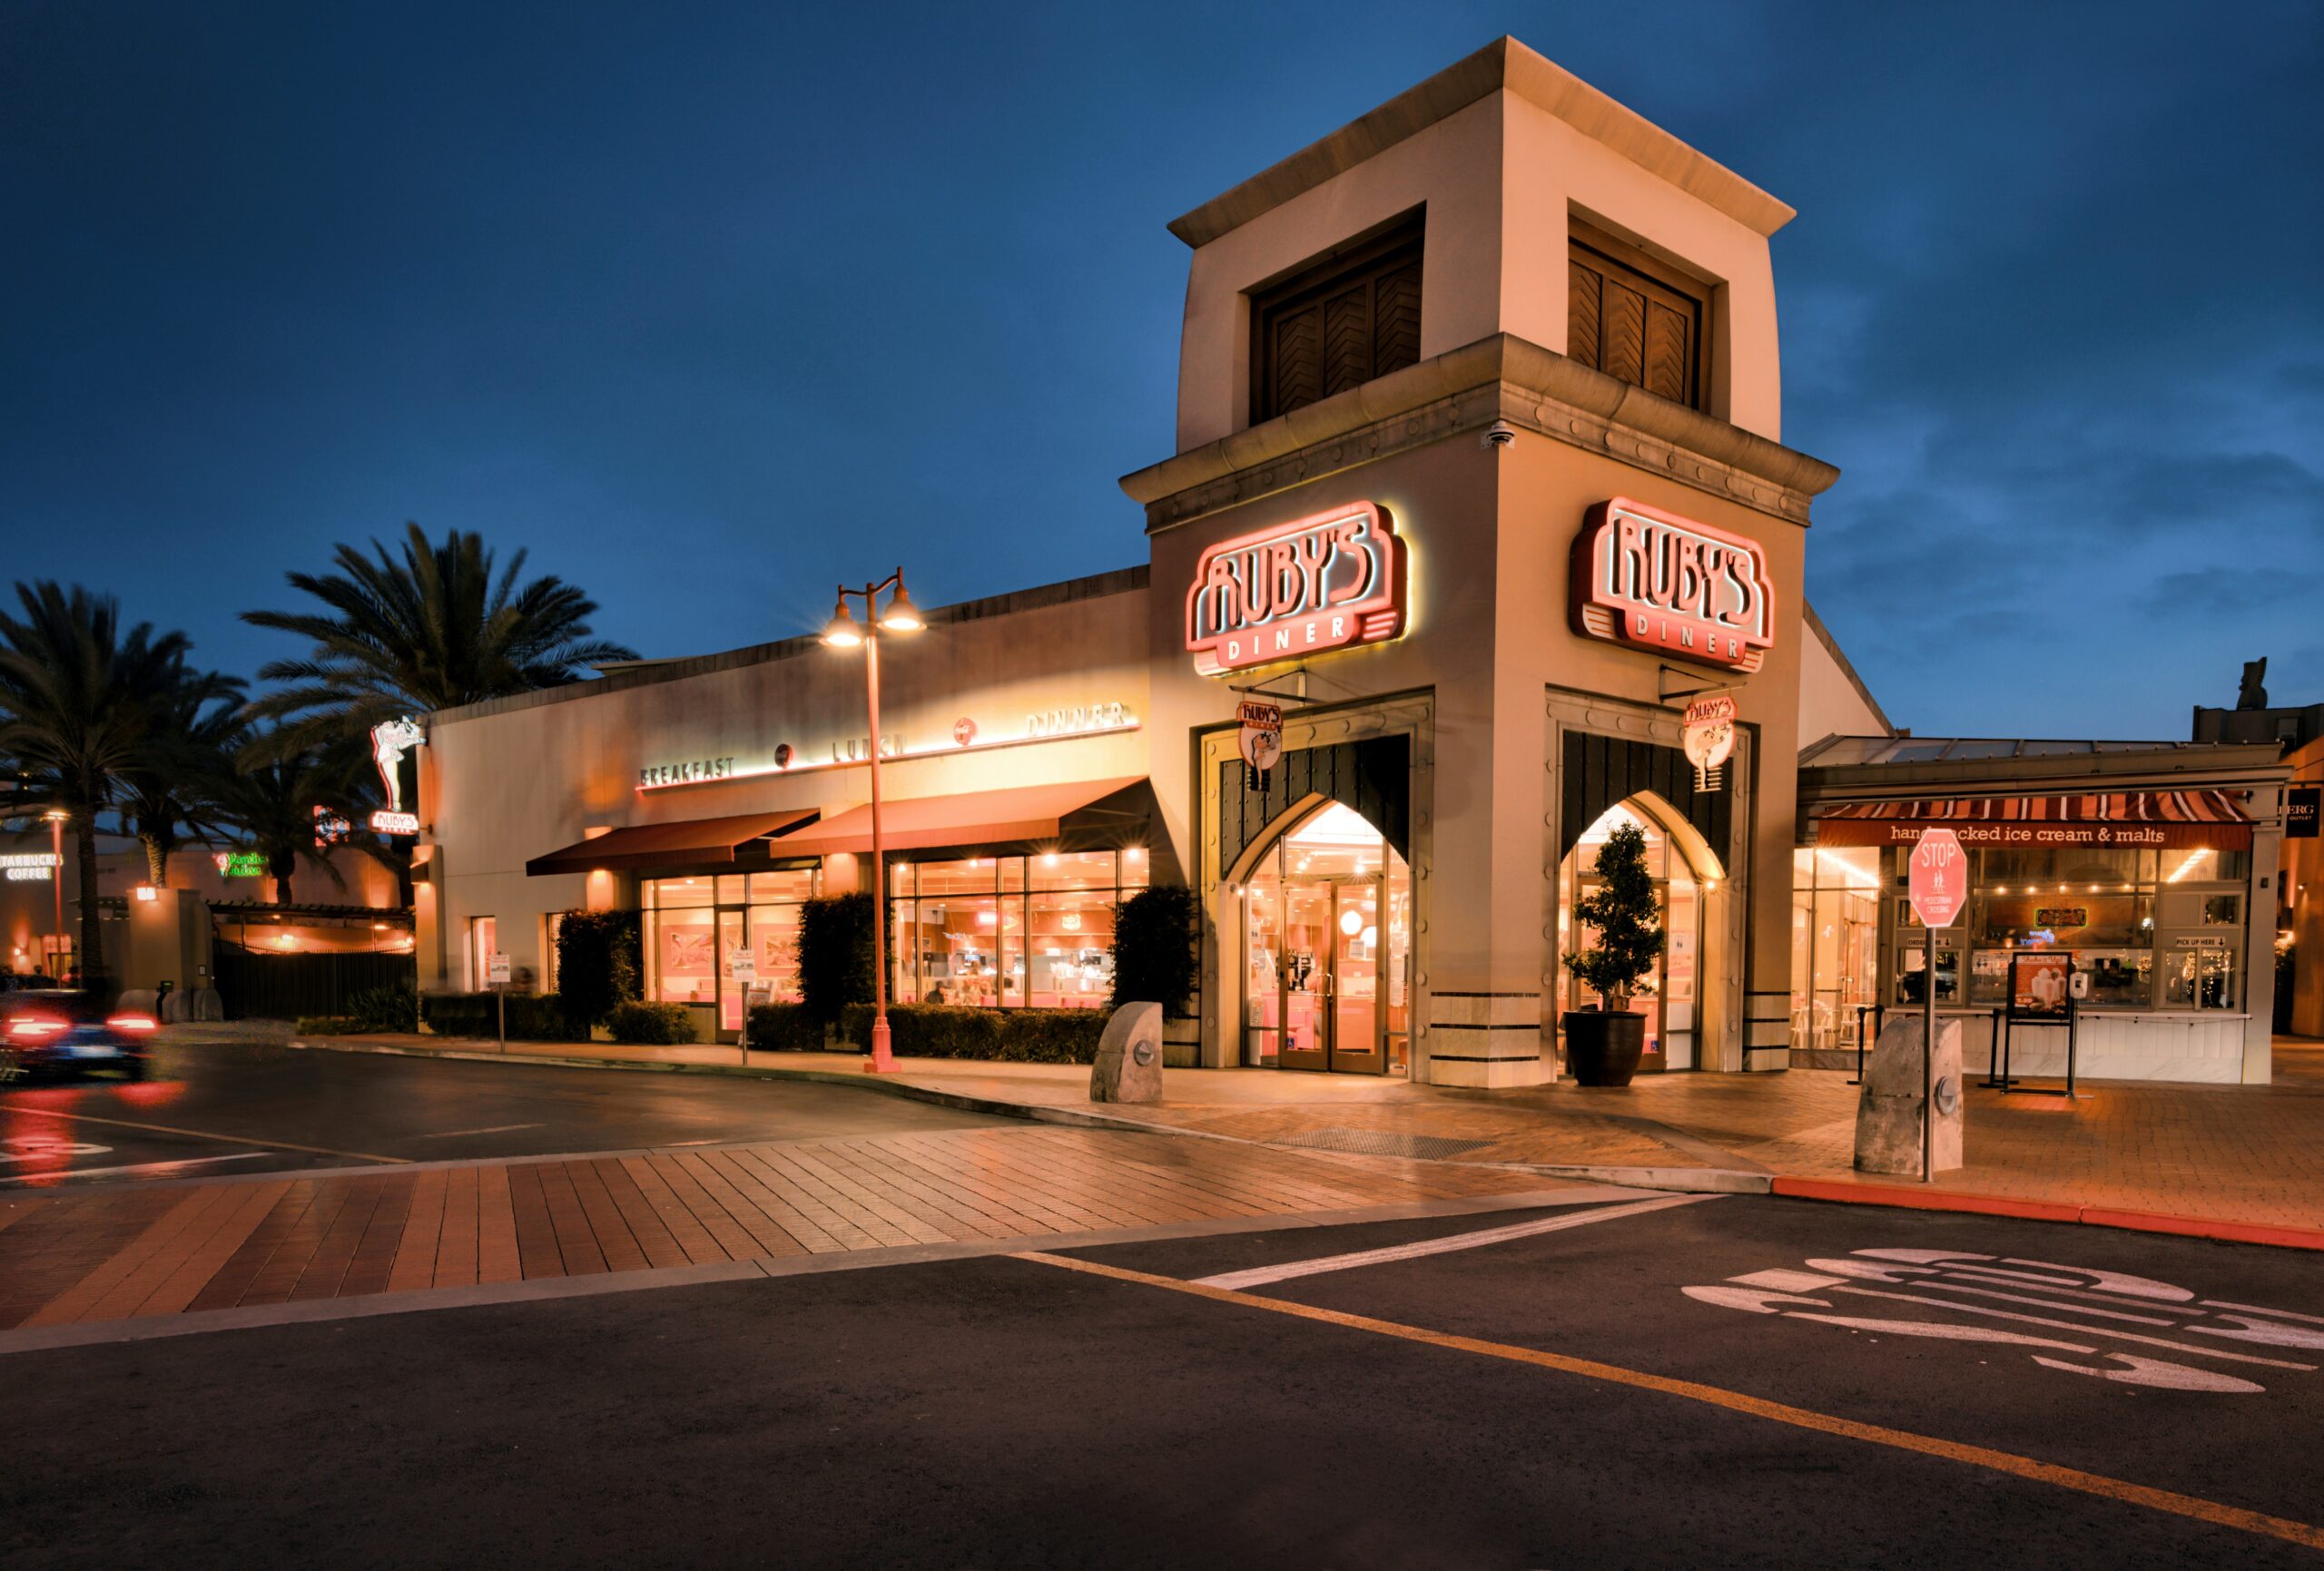
Dining out was the No. 1 leisure activity Americans engaged in during much of the pandemic, according to an MRI-Simmons survey completed last fall and filtered into the American Communities Project types this past summer. Fifty-one percent of Americans said they dined out in the previous 12 months before taking the survey, sometime between September 2019 and August 2021.
The percentages were higher in white middle- to upper-middle income communities, including the affluent Exurbs on the outer reaches of cities, Rural Middle America across the upper tier of the country, Middle Suburbs in the Rust Belt, and LDS Enclaves in the Mountain West. The percentages were lowest in communities of color, multicultural communities, and those based in the South. In the bunch, the Urban Suburbs‘ average percentage may be a particular surprise, given these communities are known for their high incomes and on-the-go lifestyles, but heightened restrictions on restaurants and individuals’ precautions during the pandemic may have curbed dining out among residents.
Just 7% of Americans nationwide said they dine out two or more times a week. But this was not evenly distributed among the 15 community types. Residents in Exurbs, Evangelical Hubs, and Working Class Country — predominantly white communities of varying income levels — were much more likely than average to dine out often each week. Big Cities and Urban Suburbs, where many might expect eating out to be popular, faced more restrictions in the pandemic, and were below average. Meanwhile, Native American Lands' residents were significantly less likely than average to dine out at least twice a week.
What Were Popular Restaurants?
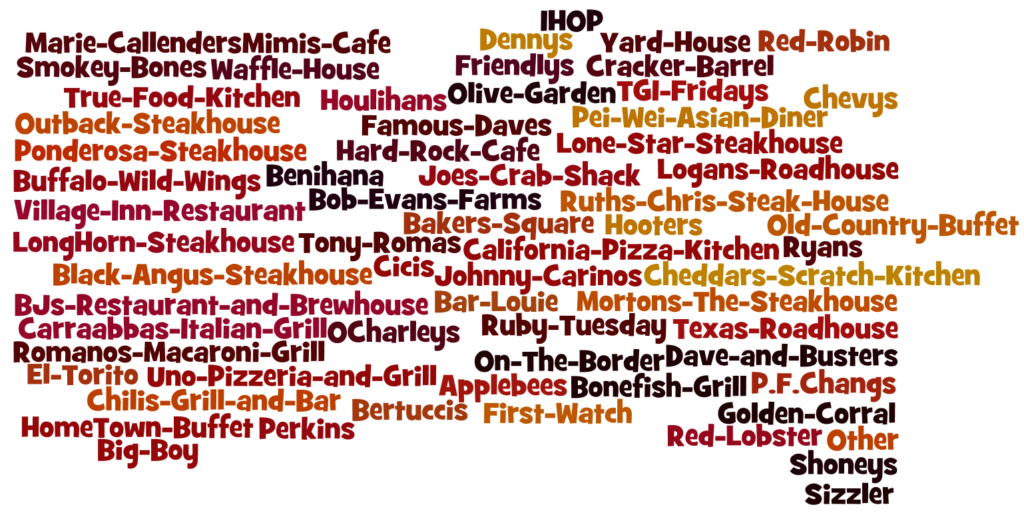
Survey participants were asked about 65 brands of restaurants they bought or ate at in the last 6 months.
Below are the ones that stood out for having an overall response rate of at least 5%.
Many may recall the Applebee’s commercials and social media spots that went viral during the pandemic. Applebee’s, which started in Decatur, Georgia, in 1980 and known now for its large, affordable menu, was most popular in middle-income communities of varying diversity, including Middle Suburbs, College Towns, Urban Suburbs, and Military Posts.
Compare that to competitor Chili’s Grill & Bar, which started in Dallas in 1975. It was more popular in many economically and ethnically diverse communities concentrated in the Southwest and West, including LDS Enclaves and Hispanic Centers, as well as stratified Big Cities and affluent Exurbs across the country. Chili's brick-and-mortar restaurants are more plentiful in these parts.
Slightly less popular overall was IHOP, focused on American breakfast foods with lunch and dinner menu items. Established in 1958 in Burbank, California, 12 miles from downtown Los Angeles, IHOP was much more likely than average to be patronized in Big Cities and Urban Suburbs ringing cities. IHOP's presence is more limited in a range of rural communities.
With a similar premise of offering affordable, American breakfast foods, Denny's rounded out the top chains nationally. The restaurant's appeal generally encompassed a wider geography than IHOP's. Denny's was founded in 1953 in Lakewood, California, and opened its first international restaurant in Acapulco, Mexico, in 1967. Residents in Hispanic Centers, known as agricultural bastions, were 102% more likely than average to have eaten or bought food at Denny's in the six months before taking the MRI-Simmons survey. Big Cities and more rural LDS Enclaves were also more likely than average to have patronized the diner.
Reading books was one of the most popular leisure activities in America during much of the pandemic, according to the latest MRI-Simmons survey from fall 2021 and filtered into the American Communities Project’s 15 county types this past summer. Forty percent of Americans said they read books for leisure in the last 12 months before they took the survey, sometime between September 2019 and August 2021. (Only dining out and listening to music were more popular at 51% and 49%, respectively.)
In addition, reading books was the most frequent leisure activity for Americans nationwide during the previous 12 months before participating in the survey. Twenty-three percent reported reading books for leisure at least twice a week — the most popular leisure activity enjoyed more than once a week.
In some community types, this frequency was more pronounced. Reading two or more times a week was highest among residents in predominately white, middle-income communities. It reached at least a quarter of the population in four community types, including:
27% in LDS Enclaves, Mountain West Mormon communities;
26% in Graying America scattered around the Northeast, Upper Midwest, South, and West;
Reading books at least twice a week was lower among multicultural communities, communities of color, and many in the South. It hit 21% in Native American Lands, Big Cities, and Evangelical Hubs (concentrated in the South). The figure dropped to 20% in Hispanic Centers, gathered in the West and Southwest; and 19% in the African American South, sweeping from Virginia to Texas.
Where There’s Heavy Book Buying
More than one-fifth (21%) of Americans said they purchased seven or more books in the previous 12 months before taking the survey. This was considered heavy. The same percentage (21%) purchased zero to three books, while 12% purchased four to six books, a medium amount.
The community level stats generally track with the communities reading frequently for leisure. Twenty-five percent of LDS Enclaves, 23% of Aging Farmlands, and 23% of Exurbs bought seven or more books. Interestingly, College Towns came in just slightly above average at 22% for seven or more books, perhaps because they have wider access to borrowed books and/or are reading materials online. Meanwhile, 22% of Native American Lands bought seven or more books in the 12-month time frame, higher than community types with many people of color: the African American South and Hispanic Centers.
What Books Are People Buying?
The MRI-Simmons survey shows that book preferences vary among Americans nationwide.
Book Preferences By Community Type
Residents in the LDS Enclaves and Exurbs were more likely than average to have purchased children’s books in the 12 months before taking the MRI-Simmons survey. This is not surprising, given that the 2020 Census showed that the child population is growing in both kinds of places. It may be more surprising that Aging Farmlands were also more likely than average to have bought children’s books during this period. This may come from family and friends gifting books to young families.
People in the multicultural, stratified Big Cities and affluent Urban Suburbs were more likely than average to have reported purchasing biographies in the same 12-month time frame.
In the Urban Suburbs and Exurbs, places where passports are more common, residents were much more likely than average to have purchased travel books. Meanwhile, the Aging Farmlands and LDS Enclaves had higher-than-average cookbook purchases.
Residents in the African American South stood out for being more likely to have purchased religious books in the last 12 months before the survey. Those in the Evangelical Hubs and Aging Farmlands, where religion is a very high priority, were also more likely than average to have purchased these books. People in Working Class Country in Appalachia, Military Posts in and around military bases, and Native American Lands were notably more likely than average to have purchased religious books. Religion and/or faith is often woven into daily life in these places.
LDS Enclaves and Urban Suburbs were more likely than average to have purchased novels in the previous 12 months before taking the survey. Those in the Native American Lands, Aging Farmlands, and African American South were more likely than average to have bought romance novels in the previous 12 months. At the same time, residents in LDS Enclaves and Hispanic Centers were more likely than average to have purchased science fiction.
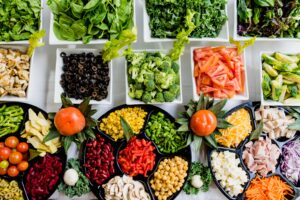
Amid the Covid-19 pandemic, four of the eight most popular leisure activities in America have revolved around food, according to a MRI-Simmons survey released last fall and filtered into the American Communities Project’s county types this summer. After so much time spent social distancing, dining out was the No. 1 leisure activity. Barbecuing, baking, and cooking were other major activities.
And Americans expressed many similar food attitudes — including preferring to cook with fresh food, trying to buy what’s locally produced, and enjoying food from different cultures. This is despite uneven socioeconomic circumstances and food environments across the American Communities Project’s terrain, which categorizes the 3,142 counties by 15 types.
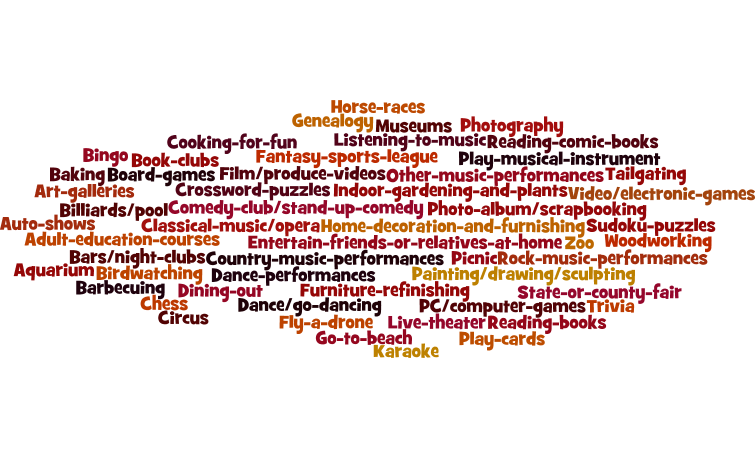
Measuring Leisure Activities
MRI-Simmons asked Americans about 54 different leisure activities. Below is a word cloud of the activities polled.
How Cooking for Fun Stacks Up
Given the pandemic’s effects on time in the kitchen, the American Communities Project drilled down to learn if cooking for fun has been particularly popular in certain kinds of places. The LDS Enclaves — middle-income, Mormon communities in the interior West — were the highest at 31%. Stratified Big Cities as well as affluent Exurbs and Urban Suburbs also climbed above the national figure of 27%.
Participation was lower in the African American South and Evangelical Hubs, lower-income communities based in the South. Also on the lower end were Military Posts, middle-income, transient communities scattered around the country; and Working Class Country, lower-income, service centers concentrated in Appalachia.
Interesting, too, that cooking for fun is one of three leisure activities that more than 10% of people across communities said they participate in 2+ times a week. (The others are reading books, 23%, and listening to music, 22%.) Exurbs show the highest number here at 12%; again, Southern-based communities, the African American South and Evangelical Hubs, lag at 8%.
Housing and Food Insecurity
Across the country, Americans struggle with personal and household challenges that can affect the ability to cook with ease, even pleasure. Housing instability is an issue impacting a wide range of American communities, particularly some communities of color and ones that are densely populated, diverse, and stratified. Native American Lands and Big Cities have the most trouble here, with 19% affected. However, more multicultural Urban Suburbs, College Towns, and Hispanic Centers also struggle with severe housing problems. Overcrowding as well as a lack of plumbing and/or kitchen facilities undoubtedly make cooking more challenging.
Glaringly, food insecurity touches Americans all over the map. In most communities, at least 11% find it difficult to access food. Native American Lands, the African American South, and Evangelical Hubs are hit particularly hard with upwards of 15% of residents being food insecure. Exurbs, located on the outer reaches of cities, are on the lower end at 10%.
Food As Comfort and Connection
Despite varying socioeconomic challenges, Americans are aligned in their food attitudes in key ways, according to the MRI-Simmons study. As in many times of crisis, food has been a comfort and a gateway to connection, say at least 70% of Americans. This held true after filtering data through ACP’s geographic lens. Hispanic Centers were slightly below the national average on the issue of food providing comfort, at 69%. It’s worth noting that quite a few of these counties are home to meatpacking plants and a heavy agricultural workforce.
After more than a year of social distancing, Americans widely expressed unanimity in using food to bring family together. In all community types, between 72% and 75% of residents said food helped in this way.
Food Environment Challenges
While food is soothing and connecting for individuals, the food environment looks very unequal across the country, according to the 2022 County Health Rankings & Roadmaps. This measure, ranging from 0 (worst) to 10 (best), evaluates physical proximity to healthy food as well as income barriers in communities. Food deserts have been correlated with negative health outcomes.
Affluent Urban Suburbs and Exurbs followed by middle-income Rural Middle America have the lushest food environments, reaching above 8. With fewer markets and lower-incomes, communities of color — Native American Lands and African American South — sit at the bottom at 5.4 and 6.9, respectively. However, the predominantly white Evangelical Hubs are not far behind at 7.
Personal Habits and Choices Around Food
Despite less-than-stellar food environments in many parts of the country, about 80% of Americans nationally and within the 15 community types say they do cook their meals frequently. And people report a discerning consciousness in their choices. More than 70% of residents in all 15 community types prefer cooking with fresh rather than frozen or canned food. At least 64% in 13 types try to buy food grown or produced locally; the exceptions are Big Cities and Hispanic Centers at 61%.
Geographic variations come into focus on the question of enjoying food from different cultures, according to the MRI-Simmons study. LDS Enclaves, Big Cities, and Native American Lands lead here. Fewer people in predominantly white communities — including lower-income counties in the South and Appalachia as well as middle-income Rural Middle America across the country’s upper tier and middle-income Aging Farmlands in the Great Plains — agree that they enjoy food from different cultures, but even here the percentage is a clear majority with at least 63%.
The Covid-19 pandemic has reshuffled the U.S. economy on a fundamental level. Everything has changed — from how and where Americans work, to the way they shop and entertain, to how they conduct business meetings. More than two years after the first nationwide Covid shutdown, movie theaters are still mostly empty, and many restaurants have not bounced back. Schools have largely returned to normal, but with an eye out for new variants. These are the kinds of large-scale shifts that are causing uncertainty and upheaval in communities across the country.
But all the changes have also unfolded on a very uneven landscape and have the potential to lead to vastly varied impacts on communities’ social and economic health.
The data show how some communities went into the pandemic with strong economies to protect them, while others started off with deeper challenges across many areas, from unemployment to income inequality to homeownership. Together, the numbers show just how complicated the road out of the pandemic will be. Like a relay race with a staggered start, some places have inherent advantages that are only likely to grow as the recovery unfolds and the worst parts of Covid drift into the rear-view mirror. Others are likely to find themselves not only trying to recover from the virus but also adjusting to the new world from a lagging position with little way to make up ground.
The data serve as a reminder that the national narratives coming out of the pandemic do not adequately explain what is actually happening on the ground in different kinds of places. And finding a “new normal” is likely to take much longer in some communities than in others.
For this report, the American Communities Project worked with the Economic Innovation Group to analyze asset income per capita across the ACP’s 15 county types. That is income specifically from dividends, interest, and collected rent. The numbers are a baseline for this report because they go to the heart of a broader question of economic health at the community level.
“The pandemic has underscored the divide in financial security and well-being between the Americans who own assets and those who do not,” EIG Research Director Kenan Fikri said upon the release of the organization’s asset income report in August 2021. “The overall economy is booming and asset prices are soaring, but many American communities are left out with little direct stake in the wealth created on financial markets. Building wealth inclusively will require expanded and innovative pathways to increase asset ownership for more American families.”
The larger truth behind these words still holds. The EIG analysis looked at asset income in the ACP types going back 50 years. During the last 10 years, a group of communities has emerged above others, showing steady asset income growth. The most urban community types, the Big Cities and Urban Suburbs; the agriculture-driven Aging Farmlands; and the Graying America retirement havens stand above the rest of the ACP types.
On the other end is a set of ACP types that lack those advantages, and most of them are home to large communities of color: Hispanic Centers, Native American Lands, African American South as well as Working Class Country and Evangelical Hubs. As those communities look to emerge from the pandemic, they not only lack that asset income stream but also face long-term challenges on issues such as child poverty.
The way those advantages and difficulties play out at the community level will be important for policymakers to understand as the nation adjusts to life after Covid-19. There won’t be simple one-size-fits-all answers, but solutions that draw on the resources of particular places and fit their demographics and terrains.
Dividends, Interest and Rent per Capita
= median
Note: Pitken County, Colo. ($98,480 per capita) and Teton County, Wyo. ($161,410) are excluded from the chart due to being extreme outliers.
To explore how these data fit with the strengths and challenges of the different community types in the ACP, we use the latest data from the County Health Rankings & Roadmaps in the second half of this report. We examine where each type stands on unemployment, poverty, income inequality, housing, and segregation.
Asset Income by ACP Type
If communities with higher asset incomes start off in a better position on the path out of the Covid-19 pandemic, the ACP typology points to a set of communities with a notable advantage. Four community types stand out among the 15 types. Urban Suburbs, Big Cities, Aging Farmlands, and Graying America all have a per capita asset income of $12,000 or more.
In some ways, they are curious mix of places. Big Cities and Urban Suburbs are often in close proximity in economic data. They tend to be home to more people with college degrees and higher incomes; greater population density; and bigger, wealthier employers. On issues of economic attainment, it is not common to have those two places grouped with rural communities, such as the Aging Farmlands and Graying America. What’s behind this peculiar alignment? Different kinds of people and assets.
It’s logical that the Urban Suburbs ($14,190 in asset income per capita) and Big Cities ($13,860 in asset income per capita) are the top two groups here. The assets being measured here are dividends, interest, and collected rent. And these communities are more likely to have people who own stocks and bonds, and people who own real estate.
The higher incomes in both community types mean people often have bigger investment portfolios. So as the stock market thrived during the pandemic (even as other parts of the economy stalled out), many people in the Big Cities and Urban Suburbs could log into their investment accounts and feel comfortable. Many residents in these communities also held the kind of jobs where “working from home” was an option, further insulating them from the worse effects of Covid-19.
Real estate is more complicated. Home prices and rents have skyrocketed in Big Cities and Urban Suburbs in recent years, and that may be a drag on the personal economic situations of some in these communities. But these same communities are more likely to be the homes of landlords who own rental properties in urban areas. So as housing prices and rents rise, that money largely stays “at home” in Big Cities and Urban Suburbs.
The economy of Aging Farmlands ($12,400 in asset income per capita) has long operated differently than that of the rest of the country. These communities are not focused on Wall Street but are built around agriculture. Although they rarely look ostentatious, there is a lot of wealth in them. Farmers aren’t just people who plow fields, they are extremely attuned to global commodity markets. Go to an Aging Farmland community, where the price of a bushel of corn or wheat is on everyone’s tongue or their smartphone screen. People in these places know returns can be about when futures contracts are signed and harvests are sold.
Land is an enormous part of wealth and renting plots — to other farmers or to outsiders as game refuges — can be extremely lucrative. In some ways, these communities may have been the most insulated from the short-term economic impacts of Covid. Add in the fact that “social distancing” is part of everyday life in these extremely rural places and their advantage grows.
Graying America ($12,390 in asset income per capita) may be the biggest surprise on this list, but it has a few big advantages in terms of asset income. First, many of these communities have become retirement centers for aging baby boomers. After years on the job, they take their accumulated wealth and stock portfolios to rural cities and towns they have come to know through vacations and weekend getaways. Look at the map of Graying America, and you’ll notice lots of places on water or in the mountains. These kinds of places catch the eyes of people with a few dollars, and suddenly more free time. (An analysis of the 2020 census shows about half of Graying American counties gained people in the last decade, bucking a larger trend of rural places losing population).
As those Graying America tourist destinations add people and grow in popularity, they have also benefited from the home vacation rental market. Short-term vacation rental income from sites such as VRBO have added greatly to the rental income of these communities. And during Covid, when overseas travel and even hotel stays were a no-go for many people, Graying America was a winner.
Second Tier
The next six community types bunch together, from just under $10,000 to just above $8,000 in asset income per capita. All these communities are comfortably middle-income, but felt the effects of Covid-19 differently, given their demographics and locations. The communities run the geographical gamut — from LDS Enclaves in the interior West to College Towns scattered around the country, Exurbs in the outlying suburbs of cities, Middle Suburbs ringing cities in the Rust Belt, Military Posts on and around bases, and Rural Middle America, encompassing 599 counties along America’s upper half from Maine through the Great Lakes to Montana to Washington.
The asset income per capita in College Towns is $9,998. These middle-income communities emptied out when Covid hit but have been coming back since the fall of 2021 with the widespread distribution of vaccines. As younger communities, they did not suffer the losses of more densely populated communities with a greater age range. These communities are also loaded with renters — college students, graduate students, and even professors stay for a few seasons, then move on.
In Exurbs, the asset income per capita is $9,350. Exurbs are considered relatively wealthy among the 15 types with some rural attributes. Here, residents tend to be more settled. Dividends and interest are common and important assets. During the pandemic, many white-collar residents were able to work from home, their retirement plans growing as the stock market soared. And newcomers bought homes, freed from the constraints of commuting to a downtown office.
Military Posts‘ asset income per capita is $9,320. Like College Towns, military communities are younger and more transitory. Government paychecks where money is invested in retirement accounts are the norm. In August 2021, the Department of Defense took steps to mitigate Covid effects, requiring all service members to be vaccinated against the virus.
Rural Middle America’s asset income per capita is $8,720. These places are defined by small towns, and like Exurbs, tend to have more established residents. Unlike Aging Farmlands, they are not heavily reliant on agriculture, but driven by a mix of ag, manufacturing, and services, which took a hit during the pandemic. Assets, of course, go hand in hand with people. Youth and older residents have been leaving these communities for more opportunity and a better quality of life; the 2020 census confirms a 0.3% population decline in the past decade.
LDS Enclaves’ asset income per capita is $8,480. These younger communities are the centers of the nation’s Mormon population — and they are growing. The 2020 census shows LDS Enclave growth at 17.7%. Twenty-nine percent of the population in LDS Enclaves are under 18, with fewer assets to their name yet. Only 14% are over 65, a population that tends to have more assets. In some parts, the tech industry is burgeoning. In 2021, Salt Lake City (in Salt Lake County, an LDS Enclave) was one of six cities to document “impressive” growth, according to a report from the Computing Technology Industry Association. The Silicon Slopes in Utah are concentrated around Salt Lake.
In Middle Suburbs, asset income per capita is $8,170. Middle Suburbs have been hard hit by the effects of globalization in the past 30 years. Manufacturing layoffs were constant in the 1990s and 2000s. Once heavily unionized, these communities have struggled in recent decades. They lack the high incomes and investment portfolios of other urban communities.
Rear Tier
Bringing up the rear are the communities of color — African American South, Hispanic Centers, and Native American Lands — as well as working-class white communities in Appalachia and the South, all places where long-standing structural inequities permeate daily life and robust economic development is atypical. Covid is among many ongoing difficulties. Of the 15 ACP types, Evangelical Hubs, Hispanic Centers, Working Class Country, and African American South counties have seen the least amount of change in asset income per capita since 1990, only rising $760 to $1,260 in 30 years.
Agriculture is a dominant industry in Hispanic Centers, where the asset income per capita is $7,300. Hispanic Centers are home for many younger residents and immigrants, some of whom are sending money earned from working on farms and in hospitality and meatpacking plants to family outside these communities.
Working Class Country’s asset income per capita sits at $6,770. Coal country has felt the loss of its dominant industry. Bright spots: These mostly white communities concentrated in Appalachia can be inexpensive vacation destinations, draws for their country settings and picturesque views.
Native American Lands have a host of difficulties that hold down their asset income per capita to $6,440. On Indian reservations, many people work in the underground economy and do not use banks or own much. Generational poverty is an ongoing challenge. A mindset of giving is also common here, one in which people share whatever they have with someone who has less.
The African American South’s challenges seem just as deep-seated. Here the asset income per capita is $6,180. These rural communities also lack economic development. Moreover, segregation between Blacks and whites remains a fact of daily life — and that includes assets such as rental income, dividends, and interest.
In neighboring Evangelical Hubs, the asset income per capita is the lowest of the 15 types at $5,960. In these older, white communities, religion is a pillar of life, but industry is scarce and infrastructure, including housing, is often subpar.
Diverse Socioeconomic Landscapes
The asset income numbers in the first half of this report offer a sense of the underlying resources in the ACP’s 15 community types, but those resources make up only a part of the picture of those places. The community types sit in distinct socioeconomic landscapes that lead to different underlying strengths and challenges. To understand those landscapes, the ACP worked with the County Health Rankings & Roadmaps, analyzing the CHRR measures through the ACP typology.
This section examines what those measures can tell us about four major areas: unemployment, poverty, housing, and segregation.
Unemployment and Labor
Most of those who have paid attention to the economic impacts of Covid-19 know the story of unemployment. March 2020 brought a massive shock to the system when the nation ground to a halt and businesses shuttered — some temporarily, some permanently — as the parameters of the pandemic’s effects became known. A large portion of the population went on paid and unpaid leave and then, slowly, they went back to work, many from home. Others waited, unsure of whether and when it was safe to return to work.
But the impacts across the ACP’s 15 types were very uneven. Some communities have a greater share of jobs that can be shifted to “work from home” than others. Some rely more heavily on tourism dollars. And some communities consistently have lower unemployment rates than others simply due to their employer base.
To gain a solid understanding of what happened by community type, you have to consider two factors: the unemployment rate and the labor force figures. Since the unemployment spike that arrived with Covid in 2020, the numbers have improved dramatically, back to near pre-pandemic levels. But in many cases, that drop has happened with fewer people in the workforce — that is particularly true in some community types.
Comparing February 2022 (the latest data) to February 2020 (the last month before the pandemic hit), you see that the unemployment rates dipped in almost half of the ACP types.
The Native American Lands have seen the biggest decline, with an unemployment rate that has dropped by 0.7 points. LDS Enclaves and Aging Farmlands have also seen big drops, more than half a percentage point, in that time. Those types are among the most rural ones in the ACP. However, simply saying “rural communities weathered Covid better” misses some big differences in those declines. Even with the declines, Native American Lands still have a relatively high unemployment rate, 6%, meanwhile LDS Enclaves and Aging Farmlands have the lowest unemployment rates in the ACP, both under 3%. The point: Simply measuring the change in the unemployment rate misses a lot of subtlety. (More on that in the discussion of labor force.)
The data suggest urban places have had a tougher time getting back to their pre-Covid norms. The Big Cities alone have an unemployment rate that is a full point higher than it was in February 2020. Some of that increase may be due to offices still being largely empty in many major cities — meaning there is less need for services (cafes, restaurants, etc.) around them. The Urban Suburbs have also seen a jump of half a point and the Exurbs are up 0.3 points. Those increases are somewhat surprising considering those communities are generally home to more college degrees and white-collar jobs (the kinds spared a lot of loss during the pandemic). But the data indicate the economic pain may have been more widespread than understood in most analyses, with service sector job losses being widespread.
The numbers also point to BIPOC (Black, Indigenous, People of Color) communities being hit harder than other places in the pandemic. African American South counties and Hispanic Centers tend to be more rural than others, but they still saw significant increases in unemployment compared to their less racially diverse rural counterparts, such as Rural Middle America and Evangelical Hubs.
And none of that takes into account the change in labor force numbers that have become a big part of the Covid economy story. Two-thirds of the ACP types saw a drop in their labor force (the number of people actively looking for a job) in February 2022 compared to February 2020.
Big Cities and Urban Suburbs lead the way for the largest drop in the workforce. Some of that is to be expected because they hold the most workers, and as mentioned above, their economies took hits in the service sector.
The most prominent dip, however, may be the small-town Rural Middle American communities. Those counties have less than a third of the population of the Big Cities and Urban Suburbs, but their labor force reduction was almost the same size, about 216,000 fewer people.
Again, there are signs in the labor force data that some rural communities may be rebounding a little better than the nation as a whole. Of the five communities that saw an increase in labor force, four of them — Aging Farmlands, Graying America, LDS Enclaves, and Military Posts — generally have lower population densities.
In terms of adding workers, the biggest winner was the Exurbs. The counties, generally on the edge of urban areas, added almost 400,000 workers. They may have gained from workers commuting to cities less frequently and using services more closely located to their homes.
The labor force numbers also suggest that communities of color have had a harder time recovering from the Covid. The three ACP types with large communities of color all experienced drops in their workforce: the African American South, Hispanic Centers and Native American Lands. Although the drop in the Native American Lands is the smallest, it is the largest as a percentage of its workforce — eliminating the gain those communities made in their overall unemployment rate.
Income Inequality
In many communities, the question of resources is complicated by the fact that they are spread out unevenly. That means that even if a community looks healthy in the data, on the ground there can be vast differences between haves and have-nots that require more spending on social programs. The CHRR measures income inequality by measuring the ratio of household income at the 80th percentile to income at the 20th percentile. There are stark differences within the ACP community types. The numbers range from a low of 3.8 in the LDS Enclaves to high of 5.2 in the African American South and Native American Lands.
There are some surprises in the numbers here.
It is often assumed that more urban areas have higher amounts of inequality as they are generally home to great wealth and great poverty. And there is some evidence for that in these figures. The Big Cities at 4.7 and the Urban Suburbs at 4.6 have some of the higher inequality scores.
However, the highest numbers here belong to two rural community types with large BIPOC communities: the African American South at 5.2 and the Native American Lands at 5.2. (It should be noted the Hispanic Centers are lower at 4.5.) Those figures suggest that a big part of economic inequality in the United States is tied to racial and ethnic disparities. It also suggests that coming out of the pandemic, rural communities may need special attention.
It also should be noted that racial and ethnic homogeneity may play a role in lower economic inequality figures. The two community types with the lowest inequality scores — LDS Enclaves and Exurbs — are a mix of suburban and rural locales. However, both are much less racially and ethnically diverse than the nation as a whole. And LDS Enclaves and Aging Farmlands are both more than 85% white, non-Hispanic.
Child Poverty
The CHRR data show radically different situations for child poverty in the ACP types, from a low of just 11% in the Exurbs to a high of 31% in the Native American Lands. In the context of other challenges during the pandemic, from schooling to unemployment, these numbers indicate the disparate community needs coming out of Covid-19.
There is, again, clearly a racial component to these data. The community types with large BIPOC populations — the African American South, Hispanic Centers, and Native American Lands — all have child poverty figures at 20% or above, and in the African American South and Native American Lands, the figure is around 30%.
The challenges in rural communities are apparent in these data as well. Two other communities have child poverty figures above 20% — Evangelical Hubs and Working Class Country — and both are predominantly white, non-Hispanic, but also largely rural.
No amount of child poverty is a positive, of course, but urban communities generally fare better on this measure. Exurbs, Middle Suburbs, and Urban Suburbs are in the top half of the ACP types of child poverty. Even the densely populated and economically diverse Big Cities are below 20%.
As the nation slowly works its way back to a new normalcy, those differences will be important to keep in mind. The challenges of urban youth tend to grab national attention, but it’s clear that rural communities face their own obstacles. And, as noted above, these are the same kinds of communities that lack internal wealth, which would help to climb out of the damage Covid has wrought. They have lower asset incomes and lower household incomes.
Housing
In another facet of community internal wealth, homeownership tends to be highest in communities with older, settled, white, and rural residents. The highest median homeowner rates are in Appalachian-based Working Class Country; middle-income, younger LDS Enclaves in the interior West; Exurbs, now popular places to raise families outside cities; and overwhelmingly white and land-rich Aging Farmlands in the plains. All stand at 77%, according to the County Health Rankings & Roadmaps. Older white rural communities, Rural Middle America and Graying America, come in close behind at 75%.
Homeownership drops precipitously in cities where population density is greatest, and owning property is at a premium. Overall, ownership is lowest among diverse, stratified, transitory, younger communities: Big Cities at 55%, College Towns at 62%, Urban Suburbs at 64%, Native American Lands at 65%, and Military Posts at 66%.
Furthermore, communities where homeownership is low often face severe housing problems, i.e., “at least one of four: overcrowding, high housing costs, lack of kitchen facilities, or lack of plumbing facilities,” according to the County Health Rankings & Roadmaps. Native American Lands and Big Cities endure the highest rates of severe housing problems at 19%; Urban Suburbs, the suburbs closest to cities, come in at 17%.
Residential Segregation
Moving beyond the home, the experience with residential segregation can be vastly different depending on the kind of community in which one lives. Segregation between whites and nonwhites tends to be greatest in more densely populated places: Middle Suburbs’ median segregation index sits at 42, Big Cities at 40, and Urban Suburbs at 38. The exception is in rural Native American Lands, where the indigenous population typically lives apart from whites. It has the highest segregation rate at 48.
In an interesting finding, Hispanic Centers — where self-identified Hispanics make up an average of 56% of the population — have the lowest segregation rate among community types at 23. This figure accounts for the demographic distinction between non-Hispanic whites and Hispanics. So it’s possible to see such a low number in this dissimilarity index because an overwhelming number of people self-identify as Hispanic in some counties and/or there’s a very high reliance on agriculture, a more integrated field.
Residential segregation between whites and Blacks is highest in predominantly white, middle-income communities in the Northeast, Midwest, and interior West: LDS Enclaves at 75 and Rural Middle America at 61.
Racially diverse and densely populated places are much lower on the index, with Big Cities at 54 and Urban Suburbs at 53. Perhaps it’s surprising that the African American South has the lowest rate of Black/white segregation at 35. This might be partly because these counties have fewer residents, and homes in these rural locales are scattered, with fewer planned neighborhoods. It’s important to note, however, that daily life in the African American South is often segregated.
The connection between communities’ internal wealth and segregation of racial/ethnic demographic groups is an area ripe for further study.
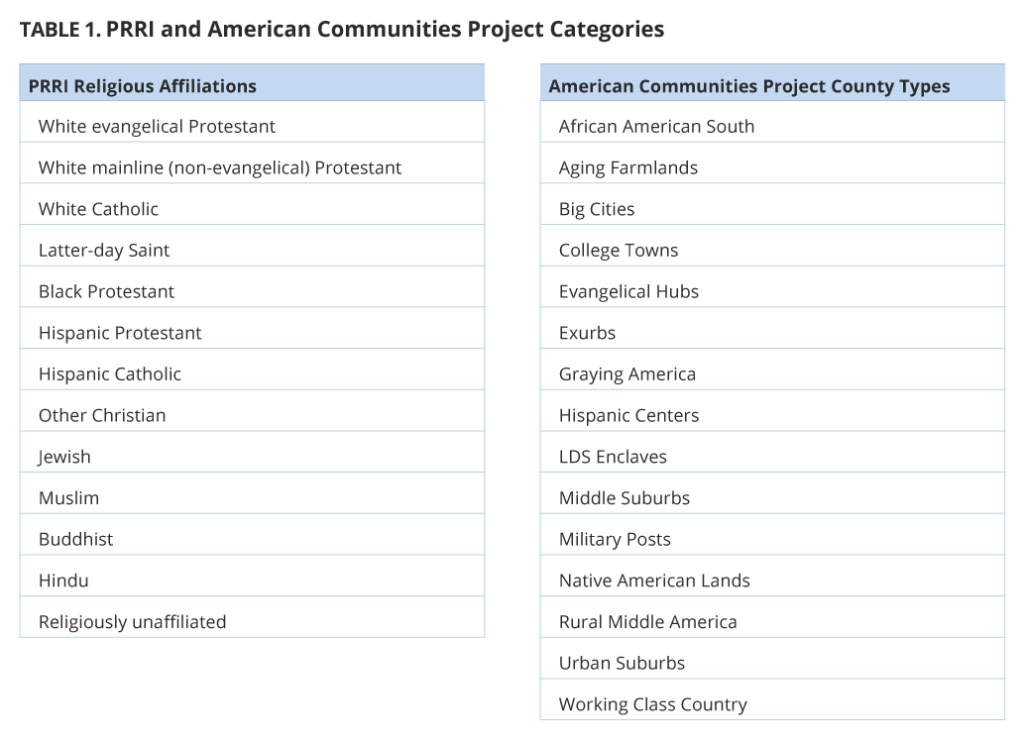
Combining data from the Public Religion Research Institute’s 2020 Census of American Religion and the American Communities Project, we can further understand both the dynamics and the nuances of religious divisions between urban and rural America. PRRI’s county-level estimates of the sizes of major religious groups classified by the American Communities Project county typology reveal a patchwork of faith experiences that illuminates commonalities and differences across the urban-rural divide.
Urban areas are often stereotyped as bastions of secularism, while rural areas are often portrayed as dominated by the traditional church. While these clichés may have grains of truth within them, there is significantly more nuance to the experiences of faith in rural and urban communities.
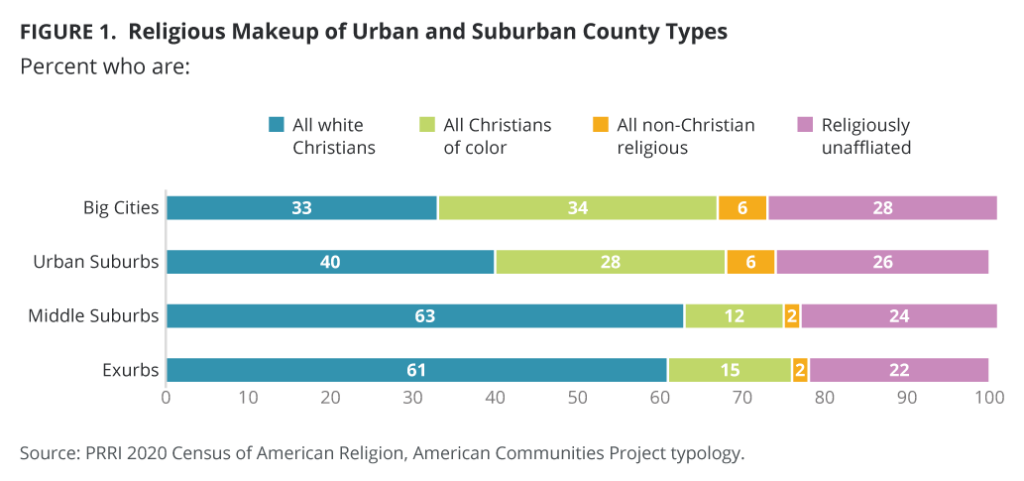
Urban and Suburban Counties
Most residents of counties classified as Big Cities and Urban Suburbs claim a religious affiliation — 72% in Big Cities and 74% in Urban Suburbs — although their religious affiliations are among the most diverse in the country, and Christians make up a smaller portion of the faithful there than elsewhere. Around two-thirds of residents of these most densely populated counties claim a Christian affiliation (66% in Big Cities and 68% in Urban Suburbs), while six percent of residents of each of the county types claim a non-Christian affiliation. More than one-quarter of residents of Big Cities (28%) and Urban Suburbs (26%) are religiously unaffiliated.
In the Middle Suburbs counties, 76% of the population claims a religious affiliation. In the Exurbs counties, the figure is 78%. These counties are less densely populated and more racially and ethnically homogeneous, and are more likely than their Big Cities or Urban Suburbs counterparts to follow Christian faiths (75% in Middle Suburbs and 77% in Exurbs). Smaller numbers – roughly one to four percent – follow religions other than Christianity, and less than one in four residents of Middle Suburbs (24%) and Exurbs (22%) are religiously unaffiliated.
Taking a deeper look at these communities shows some key contrasts: White Christian shares are larger in suburban and exurban areas, while Christians of color are more likely to live in urban areas. White Protestant groups are about half the size in Big Cities and Urban Suburbs (10% and 11% for white evangelical Protestants, 10% and 11% for white mainline Protestants, respectively) than they are in Exurbs or Middle Suburbs (28% and 23% for white evangelical Protestants, 20% and 20% for white mainline Protestants, respectively). Shares of white Catholics are smaller in Big Cities (10%) than in Urban Suburbs (16%), Exurbs (13%), and Middle Suburbs (20%). However, the opposite is true for Hispanic Catholics: 10% of residents of Big Cities are Hispanic Catholic, compared to eight percent of residents of Urban Suburbs, three percent of residents of Exurbs, and two percent of residents of Middle Suburbs. Larger shares of Black Protestants can be found in Big Cities (12%) and in Urban Suburbs (9%) than in Exurbs (5%) and Middle Suburbs (4%).
Big Cities and Urban Suburbs are the only communities where shares of any individual non-Christian religious residents make up more than one percent of the population. In Big Cities, two percent of residents are Jewish, two percent are Muslim, one percent are Hindu, and one percent are Buddhist. In Urban Suburbs, three percent of residents are Jewish, while Muslims, Hindus, and Buddhists each make up one percent. One percent of residents of Exurbs and Middle Suburbs are Jewish, while less than half of one percent of residents are Muslims, Hindus, or Buddhists.
Rural and Working Class Country
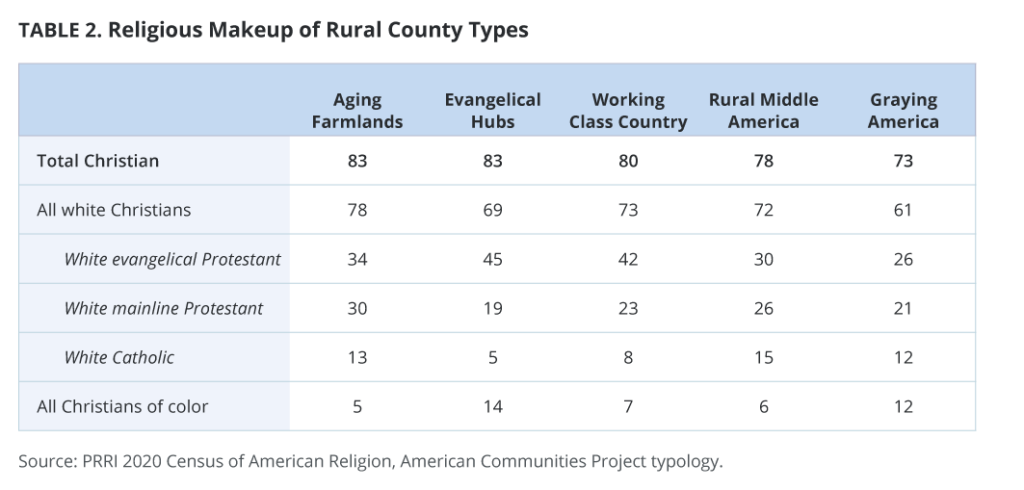
Religion outside urban and suburban areas is dominated by Christian beliefs.
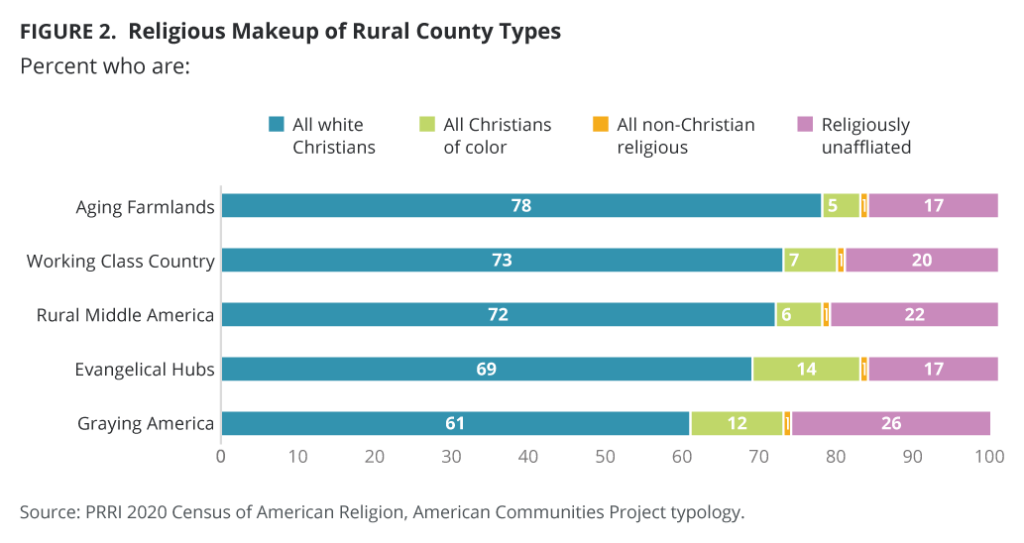
Around three-quarters or more residents are Christians, including 73% of Graying America, 78% of Rural Middle America, 80% of Working Class Country, 83% of Aging Farmlands, and 83% of Evangelical Hubs. White evangelical Protestants make up more than four in ten residents of Evangelical Hubs (45%) and Working Class Country, but their shares are smaller in Aging Farmlands (34%), Rural Middle America (30%), and Graying America (26%). White mainline Protestants make up around one-fifth to one-quarter of these communities, including 19% of Evangelical Hubs, 21% of Graying America, 23% of Working Class Country, 26% of Rural Middle America, and 30% of Aging Farmlands. Shares of white Catholics are larger in Rural Middle America (15%), Aging Farmlands (13%), and Graying America (12%) than in Working Class Country (8%) and Evangelical Hubs (5%).
While these five community types are mostly white, their geographies and incomes vary. Incomes are lower in Working Class Country counties, centered in Appalachia, and Evangelical Hubs counties, in Appalachia and throughout the South. Along with the African American South next door, these communities comprise the traditional “Bible Belt.” Despite their similarities, cultural tensions often surface as a result of racial and residential segregation.
The three other community types, all middle-income, dominate in the Midwest and the West. Aging Farmlands counties are gathered in the Great Plains. Rural Middle America fills 599 counties in the country’s upper half, from Maine to Montana to Washington. Graying America counties fill the West and are also scattered across the Great Lakes region, the far Northeast, and Florida.
Groups of Christians of color are extremely small in these communities. Less than one in ten residents of Evangelical Hubs are Black Protestants (6%), while four percent of residents of Graying America are Hispanic Catholics and two percent are Hispanic Protestants. Other than these small shares, Hispanic Protestants, Hispanic Catholics, and Black Protestants make up one percent or less of the population of these communities. Residents who follow non-Christian religions make up less than half of one percent of these rural and working-class communities.
Interestingly, around one-quarter of residents of Graying America are religiously unaffiliated, compared to smaller shares of Rural Middle America (22%), Working Class Country (20%), Evangelical Hubs (17%), and Aging Farmlands (17%).
Race and Faith Experiences Outside the Cities
Aside from Big Cities and Urban Suburbs, the only other communities where less than half of residents are white Christians are Hispanic Centers, Native American Lands, and the African American South.
Around one-quarter of residents of Hispanic Centers are Hispanic Catholics (27%), while an additional nine percent are Hispanic Protestants. Even in Hispanic Centers, there are still significant shares of white evangelical Protestants (21%) and white mainline Protestants (12%). Residents of Hispanic Centers are some of the least likely to be religiously unaffiliated (17%).
In Native American Lands, 30% of residents are Other Christians, the category of Christians that includes Native Americans, while about one-third as many are white evangelical Protestants (11%), white mainline Protestants (11%), or white Catholics (8%). Interestingly, Native American Lands include the largest shares of religiously unaffiliated Americans (32%) of any community type.
In the African American South, counties concentrated from Virginia to Texas with a median 37% Black population, nearly three in ten residents are Black Protestants (28%), while a similar share are white evangelical Protestants, 13% are white mainline Protestants, and five percent are white Catholics. Different church denominations dot the landscape. In daily life, Blacks and whites tend to segregate, including at church, but in some communities it’s common for Blacks and whites to come together to worship on holidays, including Easter and Thanksgiving. Just 14% are religiously unaffiliated, the smallest share of any community type. With the large share of Black Protestants and white evangelical Protestants, the African American South has the largest share of Christians of all community types (84%).
Unique Community Types
Three community types have notably different religious patterns from the other community types: Military Posts, College Towns, and LDS Enclaves.
Military Posts counties are often more religiously diverse than the surrounding counties. One-quarter of residents are white evangelical Protestants, while 17% are white mainline Protestants and nine percent are white Catholics. Black Protestants make up nine percent of the population, other Christians make up eight percent, Hispanic Catholics make up three percent, and two percent are Hispanic Protestants. Around one-quarter of residents are religiously unaffiliated (24%).
College Towns counties are also more diverse and less white Christian than surrounding counties: 23% are white evangelical Protestants, 20% are white mainline Protestants, and 12% are white Catholics. Small percentages are Christians of color: Black Protestants (4%), Hispanic Protestants (2%), and Hispanic Catholics (2%). College Towns are the only communities outside urban or suburban types where one percent of residents are either Jewish, Buddhist, or Hindu. More than one-quarter of residents are religiously unaffiliated (28%).
Finally, and unsurprisingly, LDS Enclaves counties are predominantly made up of Latter-Day Saints (46%). Around one in ten residents are white mainline Protestants (11%), white evangelical Protestants (10%), or white Catholics (6%). Christians of color make up small shares of the population here: Three percent are Hispanic Catholic, two percent are other Christians, and one percent are Hispanic Protestants. No other religious groups exceed half of one percent, and 21% are religiously unaffiliated.
Russia’s war of aggression has pulled America together to stand in solidarity with the Ukrainian people. But typically after these moments of unity — whether during a war, the early period of Covid, a natural disaster, or some other major event — public discourse devolves back into divisive rhetoric.
Conventional wisdom says that the reason our unity is fleeting is that Americans are polarized, leading to endless gridlock and festering problems.
But polarization is both a misdiagnosis and an excuse for why we seem unable to address the fundamental issues facing our country, and for why we plunge further into division once the glimmers of unity inevitably fade.
The Harwood Institute for Public Innovation, with the support of the American Communities Project, recently conducted 16 in-depth focus groups with Americans from cities and small towns, suburbs and rural areas, and a Native American reservation to find out the real state of our union today.
Our study, Civic Virus: Why Polarization Is a Misdiagnosis, reveals that Americans insist they are not polarized. Nor do they feel antagonistic toward their fellow citizens. I talked about the report with MSNBC’s Chuck Todd on Meet the Press Daily, who said, “It examines what might be at the heart of so much of what drives today’s toxic politics.” Here’s what’s we found:
People are separating and segregating themselves from one another due to unrelenting fear and anxiety about what’s happening around them and to them.
Many leaders, news media, and social media are intentionally stoking polarization for their own self-interest — producing a ceaseless surround sound that is engulfing people, subjecting people to an alternate reality that confuses, disorients, and destabilizes them.
Seeing no way out, people have an instinctive fight-or-flight response with many breaking up into smaller camps to protect themselves and gain validation, while others retreat from engaging at all.
Divisions in the country are intrinsically about social and psychological conditions — such as fear, anxiety, and isolation — rather than about ideological polarization.
When unity fades and divisive rhetoric returns, we see Americans have a very human reaction to the troubling cross-currents that undermine public life and their personal lives. They are in a perpetual state of fight or flight, only momentarily interrupted by passing events.
The good news is that while rhetoric about polarization locks us in, a different understanding of what’s happening unlocks a new path forward.
Let me be clear. The pursuit of unity, for its own sake, pushes aside real differences that as a society we need to work through. There are real differences in our nation.
If we want to rebuild the nation, then we need to move beyond the hollow rallying cry for unity. Seeking consensus is fruitless and a waste of time. Our task is to be much more practical and realistic about what it takes to move out of our current bind. We need to find targeted areas of agreement and begin working on things together.
An essential start is to reframe public discussion to focus on people’s shared aspirations about what we seek to create and stop tearing each other down. We must also bring people together across lines that have been used to divide. And we need to create more safe spaces so people can see and hear one another, instead of assuming the worst about each other’s intentions and beliefs. Only when people can talk about what they are for and what we seek to create, will they begin to regain a sense of possibility about moving forward.
While large-scale actions may be needed, they are unlikely to gain widespread support now. More progress is likely in our local communities, where we can start small, with achievable actions and concrete projects, and grow our efforts over time. That’s how we can get things rolling and restore people’s belief that they can get things done together.
I don’t just believe this is possible; wishful thinking won’t get us anywhere. I’ve seen this in my work with communities for over 30 years in hard-hit, even traumatized places like Flint, Michigan; Mobile, Alabama; and Newtown, Connecticut.
I’m seeing it right now in Reading, Pennsylvania; Lexington, Kentucky; and Clarksville, Tennessee — three communities that are moving forward on new community-driven education and community agendas at a time when acrimonious debates on such topics as critical race theory, school board elections, banning books, and masks signal nothing but division.
While each of these communities is very different in terms of its demographics, economics, and history, they created similar agendas for education that focus on such areas as the need for more mental health support for young people, after-school activities, teachers who look more like the community, and addressing inequities across schools, among others. These agendas show that people share common concerns about young people. And they demonstrate that by creating the right conditions, people can move beyond fight or flight and hot-button issues. Now, The Harwood Institute is launching the next phase of work in the communities to turn these agendas into concrete action. At the heart of this work is demonstrating how it’s possible amid the current challenging environment to take shared action and strengthen our civic culture.
It’s time to get beyond the false notion of polarization. But that requires taking practical steps that build a new trajectory of hope, one small step after another. There is no quick fix for the problems we face. Fight or flight is real, and we need meaningful responses to it if we seek to move our nation forward.
The United States is in a very different, and better, place on Covid-19 today than it was at the start of 2022. The omicron variant came and went quickly — cases have fallen, but only after creating record peaks in cases across the country.
Through the lens of the American Communities Project, however, the story looked different depending on the community type and two important factors:
how densely populated the community type is, and
how much of the population was vaccinated.
Places that are densely populated and where people live in tight clusters had higher case rates from January 1 to February 17. Big Cities, Military Posts, College Towns, and Urban Suburbs, for instance, all had 30% or more of their total Covid-19 cases during that time period — the highest of all 15 community types.
More rural communities — Aging Farmlands, Rural Middle America, and Working Class Country — had 26% or fewer of their total Covid-19 cases in that time period. The three rural locales had the lowest figures of the 15 types. The numbers suggest that there was natural “social distancing” that offered protection against contracting omicron.
Covid Deaths
But looking at Covid deaths, the story looks to be much more about vaccinations. The community types with the highest death rates — Middle Suburbs, Rural Middle America, and Working Class Country — all had two-shot vaccination rates below 60%. Those three communities experienced at least 13% of their total Covid-19 deaths from January to mid-February 2022.
The numbers suggest a complex equation of density and vaccination rates determined how badly omicron hit communities. Some densely populated places couldn’t escape omicron infections, but vaccinations warded off the worst impacts. Meanwhile, some rural places seem to have been sparsely populated enough to avoid high death rates, despite low vaccination numbers.
The places hit the hardest seem to be ones with some density coupled with low vaccination rates.
Communities with High Case Rates
Four of the top five communities for high case rates fit with omicron’s highly contagious nature. College Towns, Big Cities, Military Posts, and Urban Suburbs are all either densely populated or contain densely populated housing clusters — dorms and barracks.
One of the trademarks of omicron was how it infected many who were trying to be vigilant around the virus, even those who masked and were careful with social interactions. That explains the high case numbers in places with tighter Covid restrictions, including big urban areas, college campuses, and military bases. With omicron, even the cautious got sick.
But it’s interesting to note that even with these higher infection rates, the death rates in these communities were more likely to be in the middle of the pack. They were not especially low, but low considering their higher infection rates.
One possible reason is high vaccination rates. As of February 17, Urban Suburbs and Big Cities had the highest vaccination rates among the ACP types. College Towns and Military Posts had lower vaccination rates, but are home to more young people, which might have prevented higher death rates there.
The African American South
African American South communities are an outlier in the group, with higher case rates and lower vaccination rates, but also lower death rates. This set of numbers requires more study, but one possibility is the higher case rates are driven by a few places with larger populations and higher rates. African American South communities tend to be rural, but also include some counties with larger cities, such as New Orleans and Greenville, N.C., both of which were far above the case rate for the type.
Those numbers could have pushed the case figure higher while the rural nature of other counties kept the overall death number lower. In the end, most people who got omicron did not die, so higher case rates in a few densely populated places could have pushed up the overall case rate for a community type that is full of many rural places.
Communities with High Death Rates
The community types with higher death rates may tell the more important story in the data. They are a collection of rural and urban places — some densely populated and some not — but mostly with lower vaccination rates.
Most interesting on the list may be the Middle Suburbs. They had the largest percentage of total Covid deaths between January 1 and February 17: 15% of all Covid deaths occurred in the six-week span. That was true even though their case numbers were among the lowest in the ACP, about 25% of all their Covid cases in that period.
Why? They have relatively low vaccination rates, under 60%, and they are fairly-densely populated. So as omicron spread, it found more unprotected people.
The same may be true, to a lesser extent, in the Exurbs. Those communities had about 13% of all the Covid deaths they’ve experienced in the period between January 1 and February 17, 2022. While they are not as densely populated as the Middle Suburbs, they often have town centers and places where people gather. They have higher vaccination rates, but still under the 65% mark.
Also with relatively high death figures during omicron were Rural Middle America and Working Class Country. Both had lower case rates between January 1 and February 17. In Rural Middle America, 25% of all their cases came at this time. In Working Class Country, the figure was 26%.
The Role of Politics
There is one other crucial point to consider for all those high death rate locales: They all voted for former President Donald Trump in the 2020 election by double digits.
Normally, drawing a line from politics to deaths from a virus would be a stretch, but that’s not true with the way this pandemic has been politicized. Mitigation efforts such as masking or even getting the Covid vaccine became directly tied to politics and whether people considered themselves supporters of Trump or not.
Some politically conservative communities, such as the very sparsely populated Aging Farmlands, were able to compensate for low vaccination rates by being so spread out that transmission of omicron was more difficult. But in communities like the Middle Suburbs and Rural Middle America, the combination of low vax rates, low mitigation actions, and just enough density appears to have created a toxic mix.
See our complete coverage of Covid-19 case rates, death rates, and vaccination rates:


 Despite less-than-stellar food environments in many parts of the country, about 80% of Americans nationally and within the 15 community types say they do cook their meals frequently. And people report a discerning consciousness in their choices. More than 70% of residents in all 15 community types prefer cooking with fresh rather than frozen or canned food. At least 64% in 13 types try to buy food grown or produced locally; the exceptions are Big Cities and Hispanic Centers at 61%.


 Rich Harwood is President & Founder of