Probing the Divides Between Communities on Vaccination Rates
Covid-19 vaccination rates continue to rise across all the community types in the American Communities Project, but not at the same rate. Some places that were initially slow to get jabbed have seen a notable uptick in injections, but others have slowed.
The net result: The national full vaccination number is about 52%, but there is a wide gap between the top and bottom community types (the Urban Suburbs and Evangelical Hubs, respectively) and it has not closed. This trend continues the uneven landscape that may make containing the virus difficult. However, the speed at which vaccinations are increasing in other places might also be viewed as a hopeful sign for those communities. (A person is considered fully vaccinated two weeks after receiving the second dose of the Moderna or Pfizer vaccine or receiving one dose of the Johnson & Johnson vaccine.)
Those are just two of the findings in a vaccine data project between the US COVID Atlas at the Center for Spatial Data Science at University of Chicago and the ACP at Michigan State University.
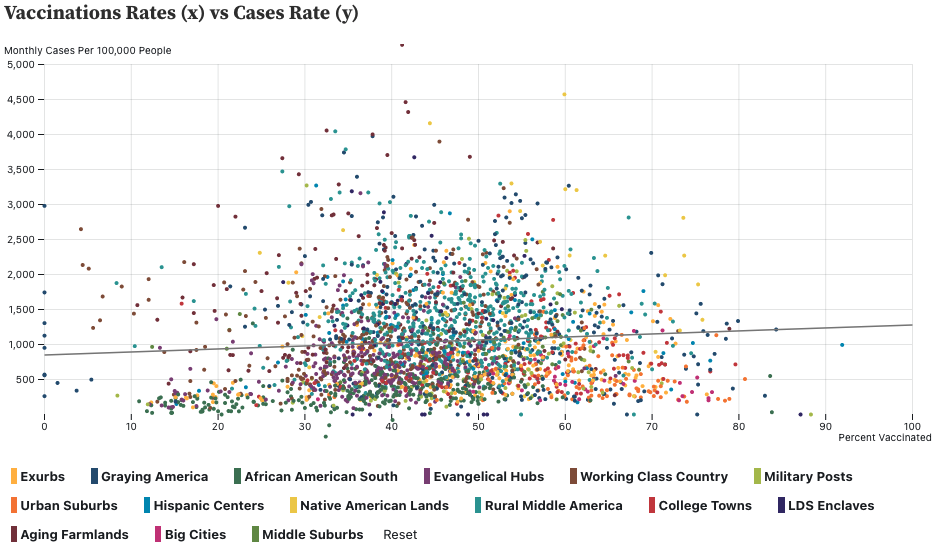
On the whole, the data suggest that the big dangers from Covid — serious cases and hospitalizations — are likely to be a function of the kind of community in which you live and the people with whom you socialize.
Climbing Above 50%
When the ACP and the US COVID Atlas last checked on vaccination rates in our 15 types in late September, we found seven of them had full-vaccination rates of 50% or more. That number has now climbed to 10 communities types where the fully-vaccinated rate is above 50%.
They are, in order of vaccination rate as of November 11:
- Urban Suburbs,
- Big Cities,
- College Towns,
- Native American Lands,
- Exurbs,
- Graying America,
- Middle Suburbs,
- LDS Enclaves,
- Hispanic Centers, and
- Military Posts.
Those last three types are the new entries on the over 50% list.
In addition, since September the top community types, the Urban Suburbs and Big Cities, have both climbed above the 60% fully-vaccinated marker.
Meanwhile, five community types remain stubbornly under 50%. From the highest to the lowest rates, they are:
- Rural Middle America,
- African American South,
- Aging Farmlands,
- Working Class Country, and
- Evangelical Hubs.
Those last two types were actually under 40% fully vaccinated at the beginning of November.
You can see those numbers on the charts below and see the changes over time. (Note: Due to incomplete data, Texas and Hawaii were excluded from this analysis.)
Making Progress, Fast and Slow
Look at the line chart above and you will see sharply different slopes for some communities. There are clusters around the 10% and even 25% vaccinated marks, but after that point they tend to climb at very different rates.
For instance, the populations of the Urban Suburbs and Rural Middle America hit the 25% fully vaccinated mark within days of each other (April 18 and April 21, respectively), but then the Urban Suburbs shot up. They hit the 50% mark on July 1 and the 60% mark on October 6. As noted above, Rural Middle America has yet to hit 50% of its population vaccinated.
In each of the types, parts of the populations were eager to get vaccinated. Most of the types hit the 10% mark within three weeks in March. But after that very different attitudes about Covid vaccines seem to surface depending on the community type.
Those different attitudes continued through the rise of the Delta variant this fall.
Consider the five community types still under 50% fully vaccinated. Since September, they have been on different paths.
The Military Posts and African American South, in particular, have seen their vaccination rate climb sharply, in the eight-point range since this same date in September. The Evangelical Hubs have seen a slower increase, about 6.3 points since September.
Those numbers are above the median increase in vaccination rates in all the types, 6 points.
But the other three types have seen vaccination rates rise more slowly. Working Class Country has climbed by about 5.6 points. Rural Middle America has increased by about 5.3 points. And the Aging Farmlands have inched up only 4.2 points.
Those slow increases, combined with the lower overall vaccination rates in those places, suggest getting the nation on the same page with the vaccine is likely going to take time — if it ever happens.
The combination of factors driving vaccine hesitancy are complicated. Some of it may be about sparsely populated places feeling less threatened because there are fewer large gatherings. Some may be about government distrust, particularly among communities that lean to the right politically as many rural communities do.
But the uptick in at least some of those rural communities is a positive sign we will continue to watch.