What’s Driving Wide Variations in Vaccination Rates in Different Communities
The 4th of July has come and gone without the United States reaching its Covid-19 vaccination goal — 70% of all adults having at least one dose. In the end, about 67% of adults were poked at least one time by the nation’s birthday.
The American Communities Project offers some insight into where the country is falling short and some idea of why — demographics, geography, and politics all seem to play roles.
A team of researchers at the University of Pennsylvania recently published a short piece in the journal Vaccine about social media conversations around the Covid vaccine using the American Communities Project types. Beyond the illuminating dissection of the online chatter, the piece also contained the remarkable chart below, showing large disparities in the percentage of people who had been fully vaccinated in each community type through early June.
Covid-19 Vaccination Rates by ACP Type
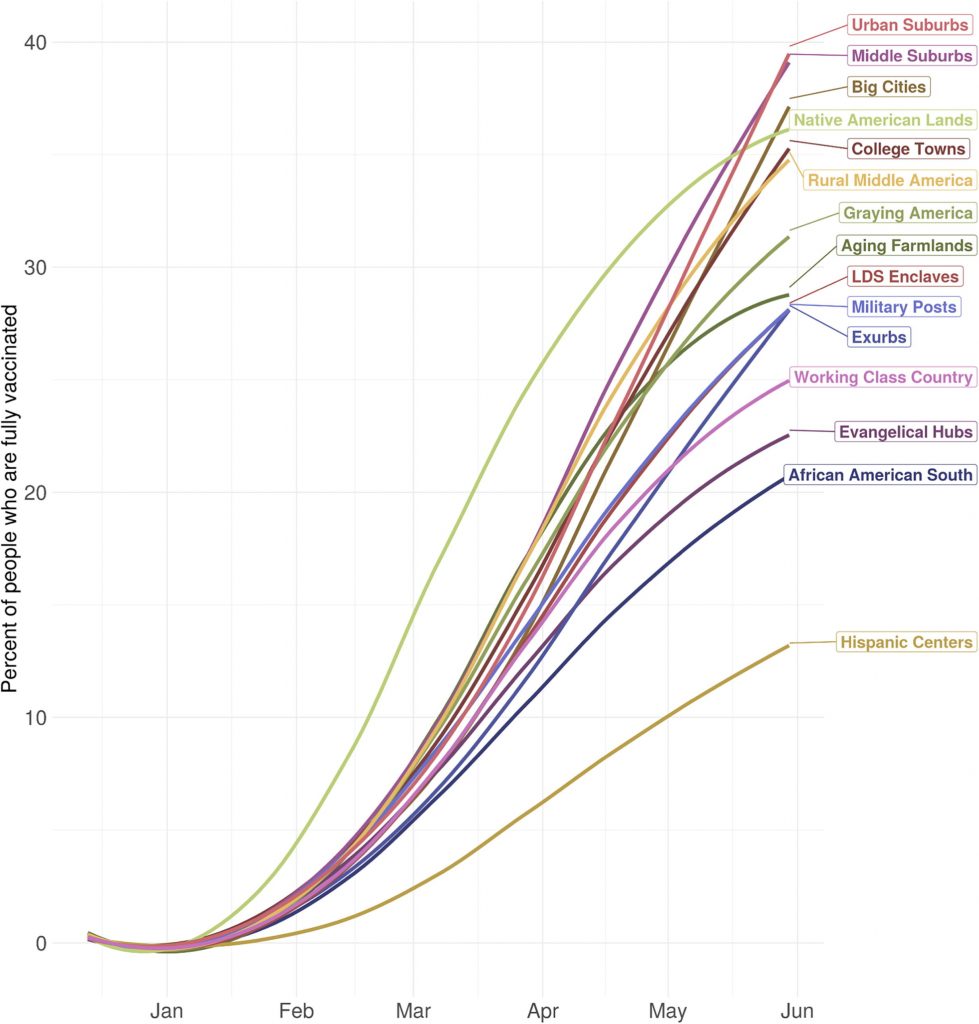
While the data are not up-to-this-minute, the discrepancies between community types are large and suggest storylines worth exploring.
Communities with Large Minority Populations
The first thing that jumps out in the chart: the lower vaccination rates in Hispanic Centers and the African American South. They are the two lowest types on the chart, and Hispanic Centers are below even 15%.
Those numbers fit with more recent findings from the Kaiser Family Foundation that Black and Hispanic populations were getting vaccinated at rates below their percentage of the population.
The reasons are harder to discern. Some of it may be vaccine hesitancy. Early poll data showed these populations were more concerned about the vaccine than other groups. But other factors may include vaccine availability (many of those communities are fairly rural) and fear of losing work time and pay or immigration concerns.
However, Native American Lands stand out at the exception among communities of color. In early June, they were near the top of all the community types, with more than 35% of their population fully vaccinated. That places them up high with large urban communities.
A few points stand out about the Native American Lands. First, they were hit very hard by the virus last year and, for that reason, may have needed less convincing to take get their shots. Second, the tribal lands in those communities tend to have a centralized leadership structure that garners respect. When leaders there spoke, community members were probably more likely to listen.
High Rates in Urban Communities
At the top of the list for fully-vaccinated places in June were the three most densely populated community types in the ACP: Urban Suburbs, Middle Suburbs, and Big Cities. All were north of 35%.
Those communities are very different places. The Urban Suburbs are wealthy with large numbers of people with college degrees. The Big Cities are diverse with a barbelled population — rich and poor, college-educated and not. The Middle Suburbs are generally less-diverse blue-collar communities around big and smaller cities.
They even hold different political leanings: Big Cities and Urban Suburbs lean heavily Democratic while Middle Suburbs tilt Republican.
And yet, despite those dissimilarities, they look very similar in vaccination rates. That suggests that, at least early on in the vaccine campaign, there was an advantage to being more tightly packed into urban areas.
The Riddle of the Exurbs
Proximity and population density doesn’t explain all the differences in the data, however. Rural Middle America and Graying America were both above 30% fully vaccinated in early June. Meanwhile, in the Exurbs, which are often at the edges of metro areas, the fully-vaccinated rate was below 30%.
That number is low for where the Exurbs “should” have been on vaccinations in early June. Those communities are not very rural — many of them are home to good-sized population centers.
They also tend to have higher levels of educational attainment. About 36% of the 25-and-older population has at least a bachelor’s degree. That’s four percentage points higher than the national average. Earlier this year, some opinion surveys found that Americans with higher levels of educational attainment were more likely to want to be vaccinated.
So why is the Exurban rate so low? The divisive political environment may be a factor. Republican Donald Trump won the Exurbs by 12 percentage points in 2020, and the social media analysis by the UPenn team found words such as “Trump” and “fraud” to be big parts of the vaccine conversation in the Exurbs from December to February.
That would help explain the lower vaccination rates in Working Class Country and Evangelical Hubs. These are more rural ACP types where Trump won by more than 40 percentage points in 2020 and where the bachelor’s-degree figures are much lower.
The larger questions are whether these community type differences persist, to what degree, and for how long? Some disparities, in availability and hesitancy, and were bound to be a part of the initial vaccine rollout, but as time goes on and the Covid variants continue, the situation becomes more serious.