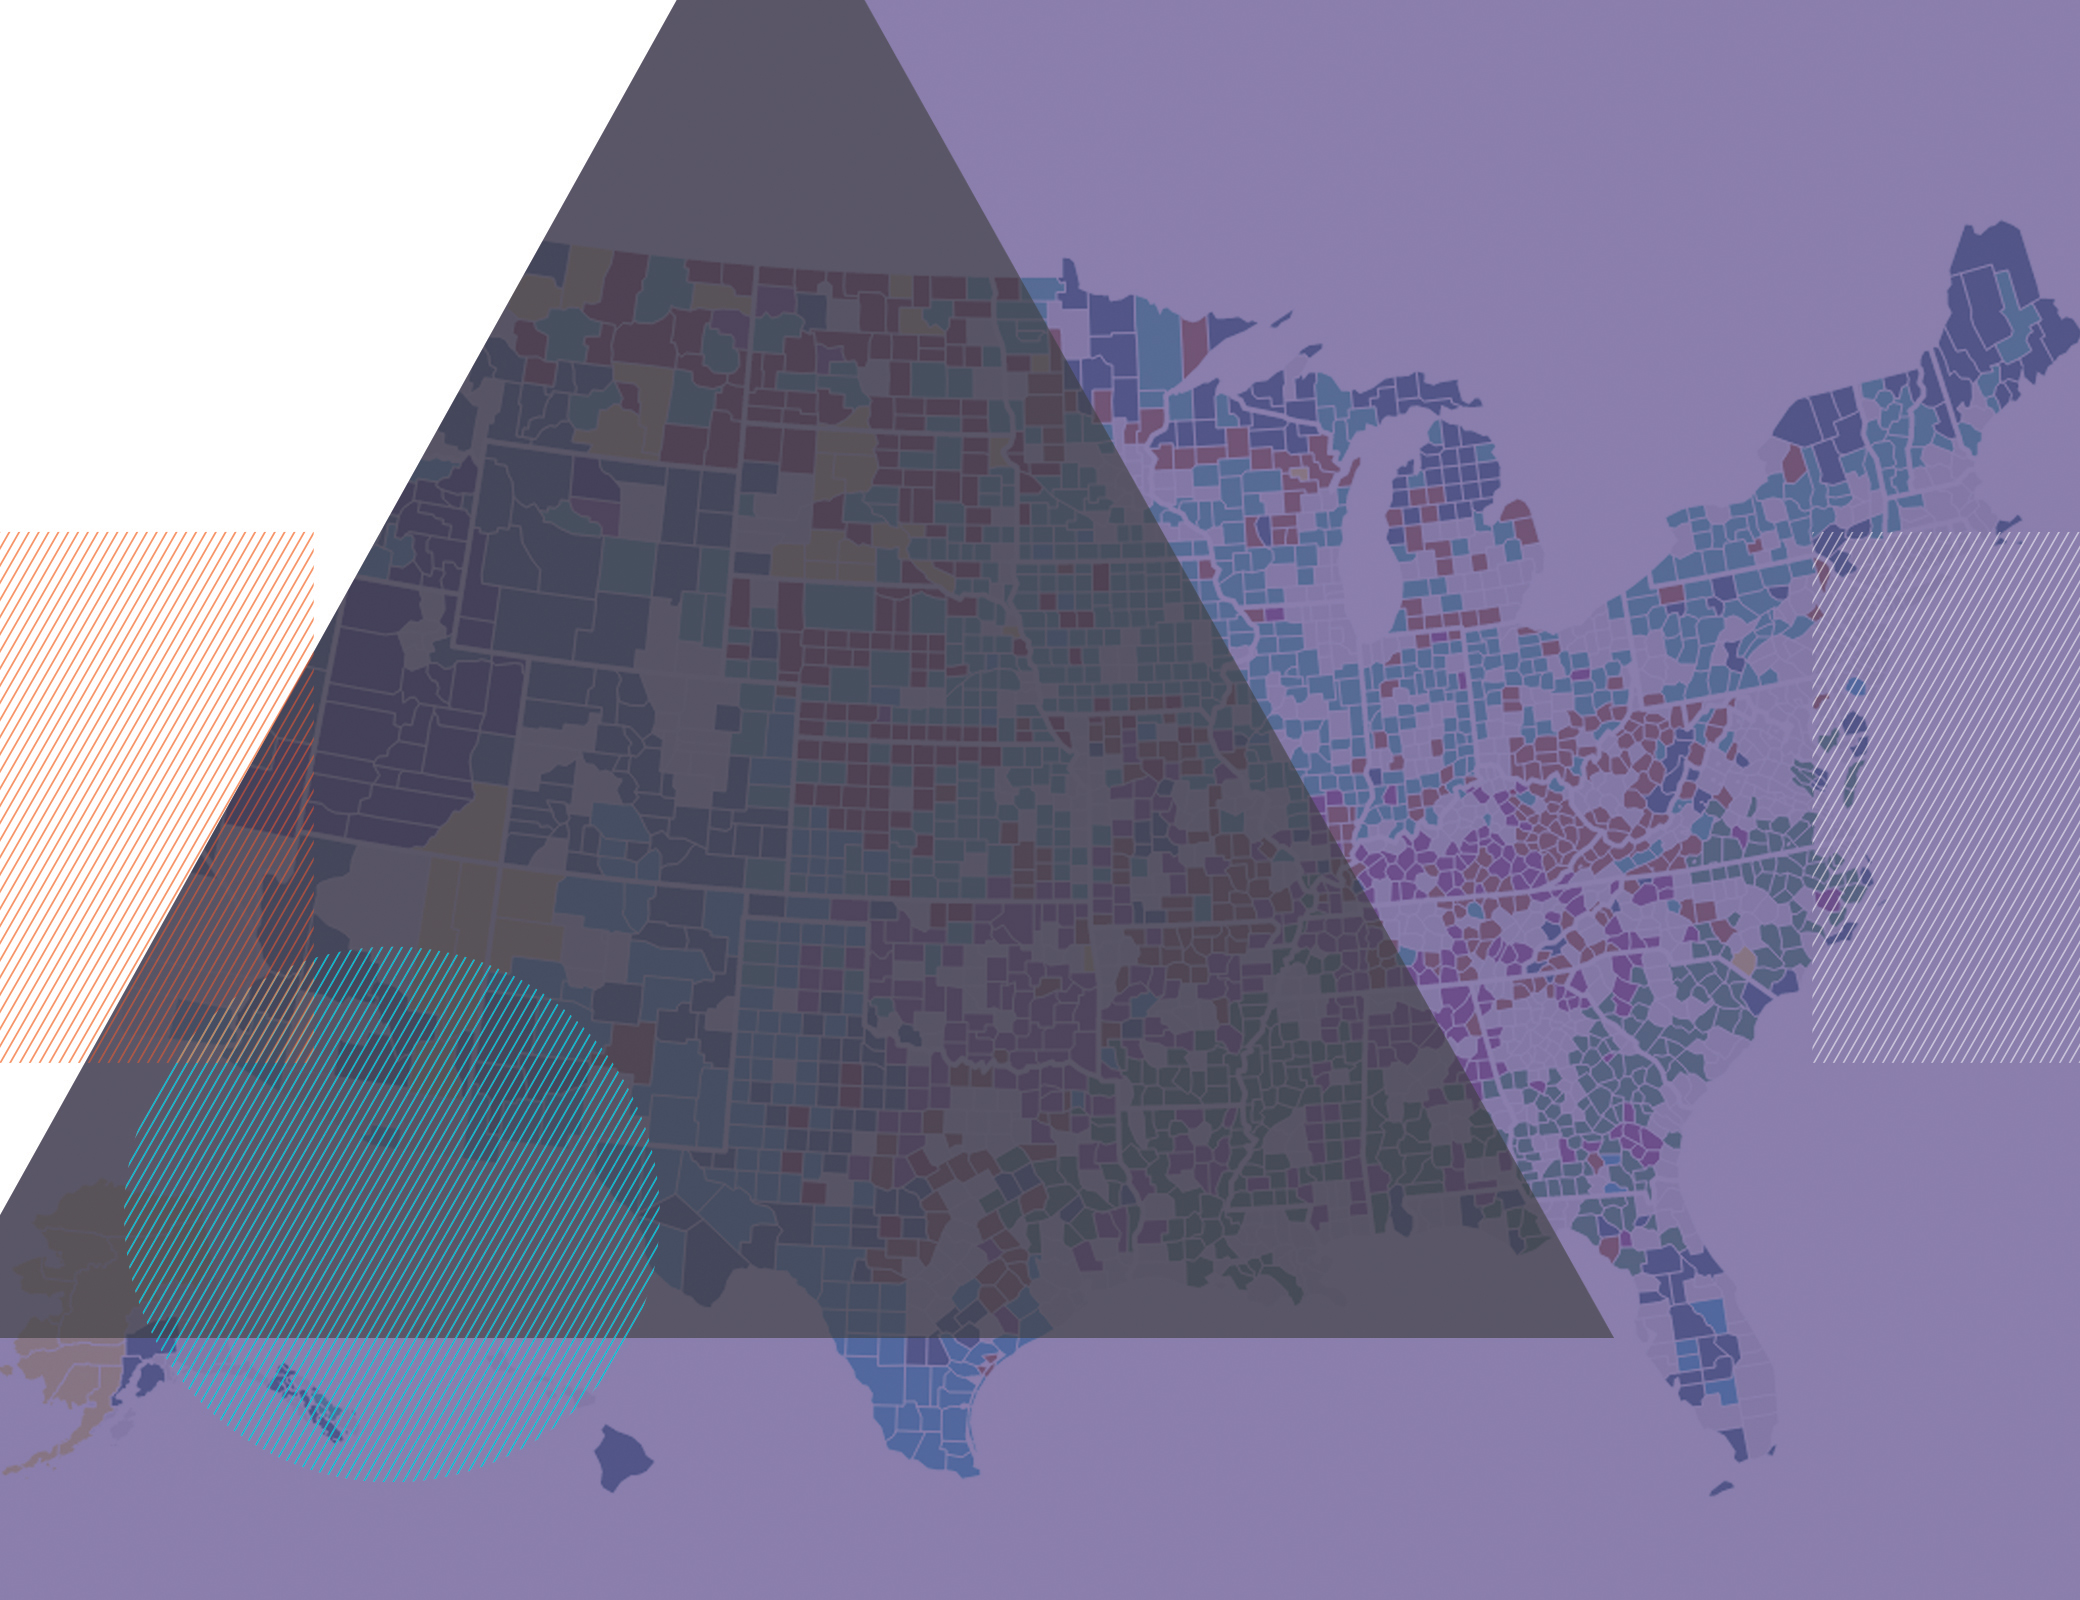
Editor’s note: In January, researchers from Princeton and the University of Michigan, funded by the Robert Wood Johnson Foundation, released an analysis of “Deep Disadvantage” for every county in the United States. The analysis used data on poverty and deep poverty rates, life expectancy and low birth weight, as well as social mobility to craft an “Index of Deep Disadvantage.” Every county in the country was given a score to understand “What does disadvantage look like in America? And where are the nation’s most disadvantaged communities?”
The American Communities Project has filtered those county data through our 15 county types to understand the larger trends in economic deep disadvantage. In this series, the ACP explores which communities tend to struggle, which ones thrive, why, and how some communities break the pattern of others in their type. The four parts are: Communities of Color, Urban Communities, Rural White Communities, and Young and Mobile Communities.
Economic disadvantage in the United States in 2020 is driven by more than the urban/rural or red/blue divides that dominate the news. Factors such as income, health, and economic mobility all play major roles — and when you combine them with the geography in the American Communities Project the contours of disadvantage in the nation become clear.
The divides are stark, particularly along racial and ethnic lines. Some rural white communities see little disadvantage, some are steeped in challenges. Communities of color tend to face harder situations, but, on the whole, Hispanic communities do much better.
It’s hard to know what the current COVID-19 outbreak will mean for communities with large numbers of African Americans, Native Americans, and Hispanics. Some may see less serious impacts because of their less urban nature. Most of these communities were featured in the ACP’s 2019 report “A New Portrait of Rural America.” Fewer people can mean less impacts from social distancing. But it’s also possible that in these communities, where more people live close to the margins, the economic impacts will be just as harsh and possibly harsher.
An overall look at the 3,100-plus counties in the United States finds some good news. Only about 5% fall into the category of Most Disadvantaged. At the same time, 50% of U.S. counties fall into the top two categories, Advantaged and Most Advantaged.
In fact, between the Neutral, Advantaged, and Most Advantaged categories, the data suggest that 80% of U.S. counties provide residents with an environment that at least does not serve as an impediment to their well-being. When combining the Index with the 15 ACP county types, however, the pockets of disadvantage become clearer, particularly in communities with large populations of people of color — the African American South, Hispanic Centers, and Native American Lands.
Communities of Color Counties
Native American Lands
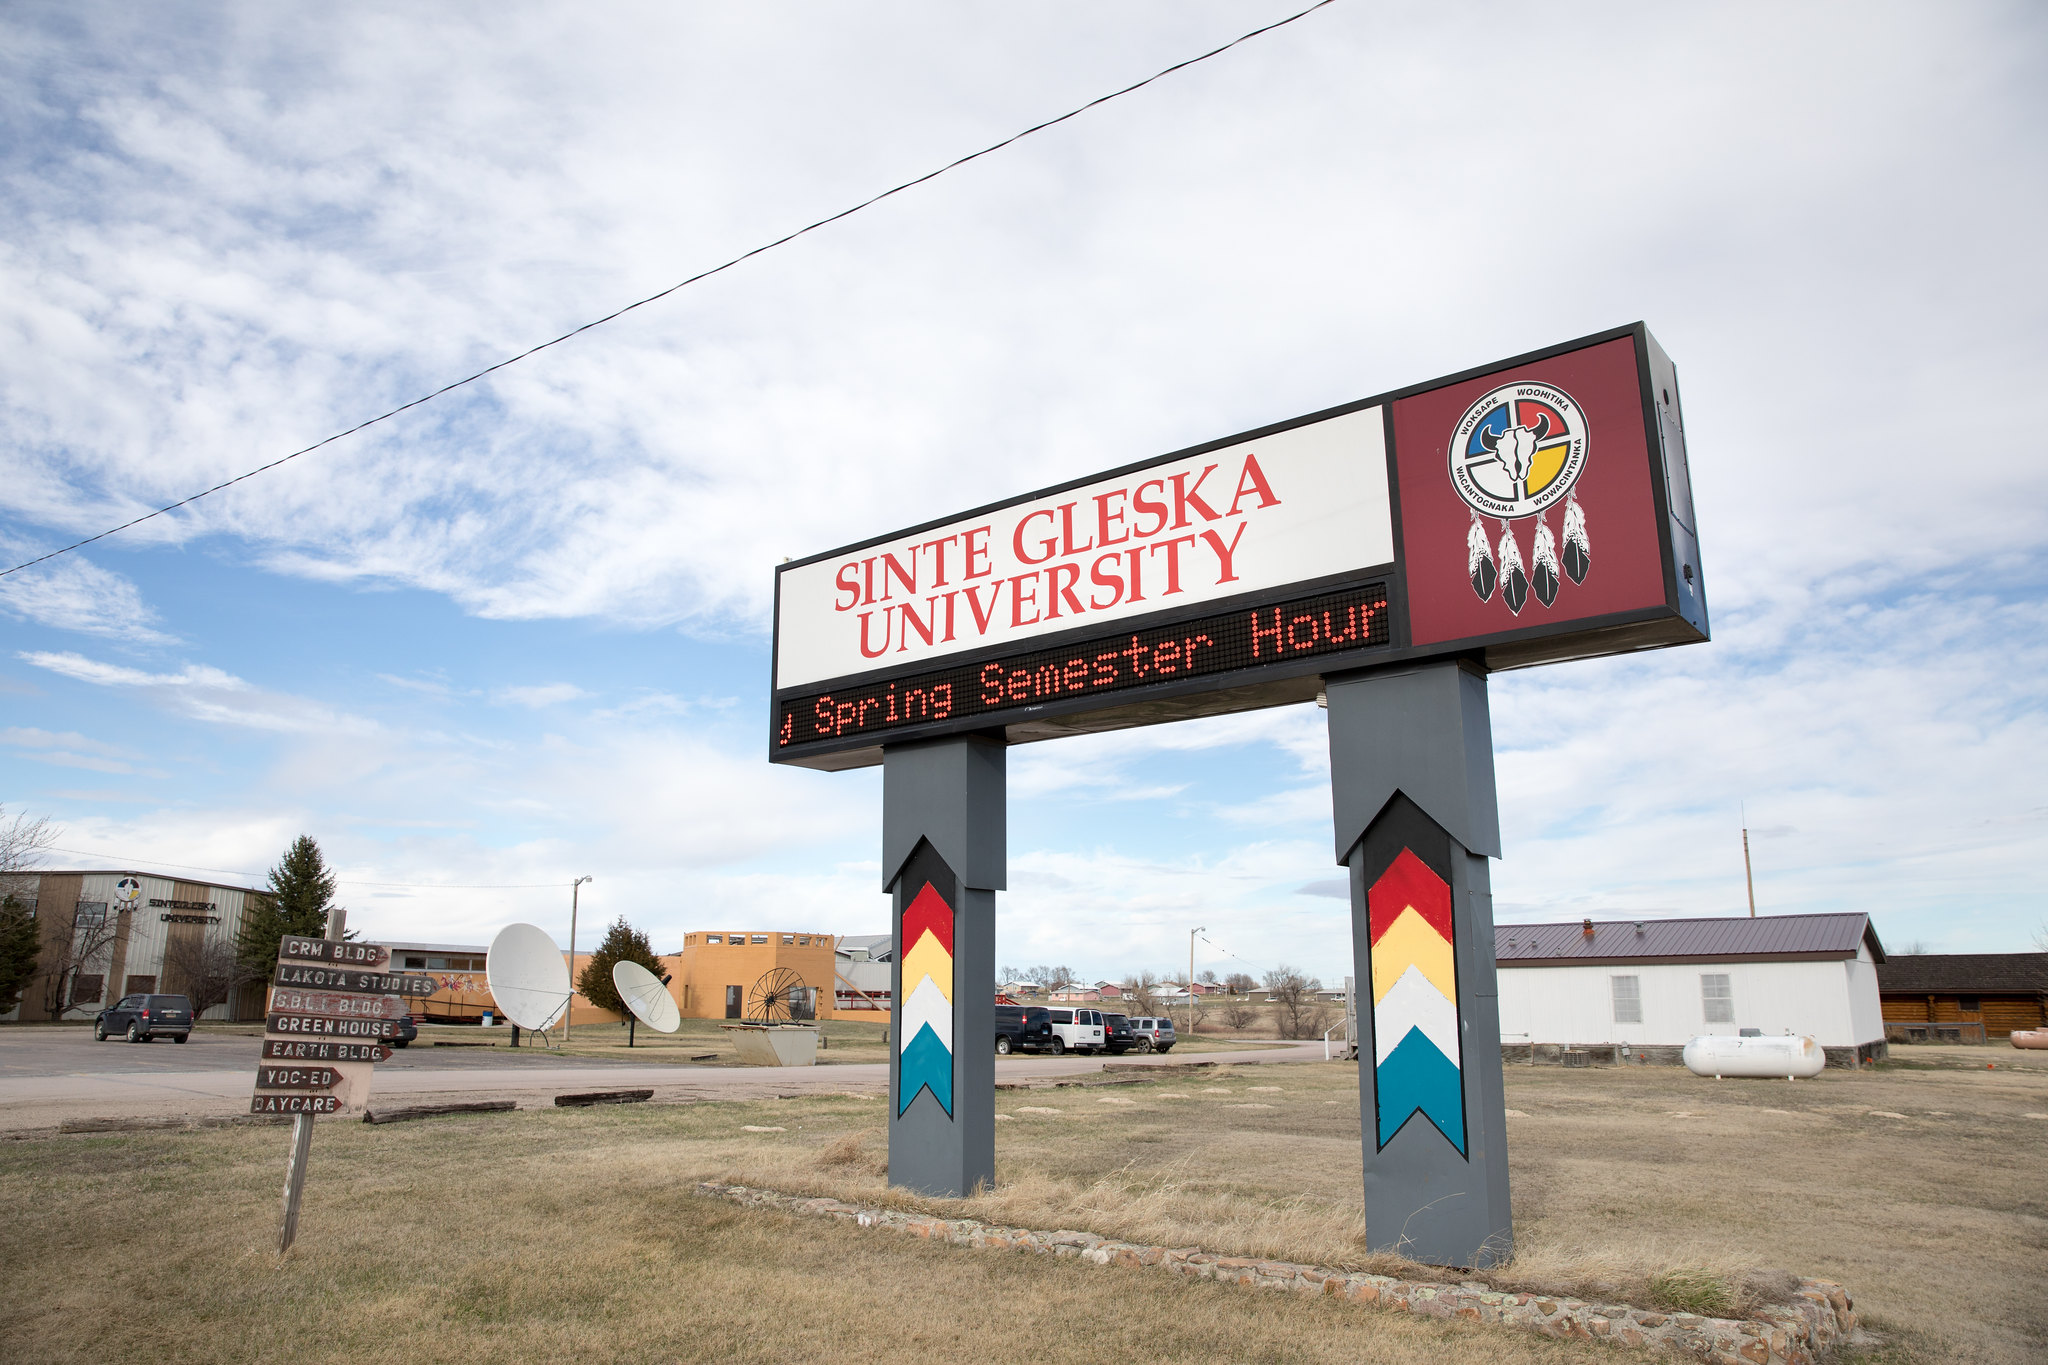
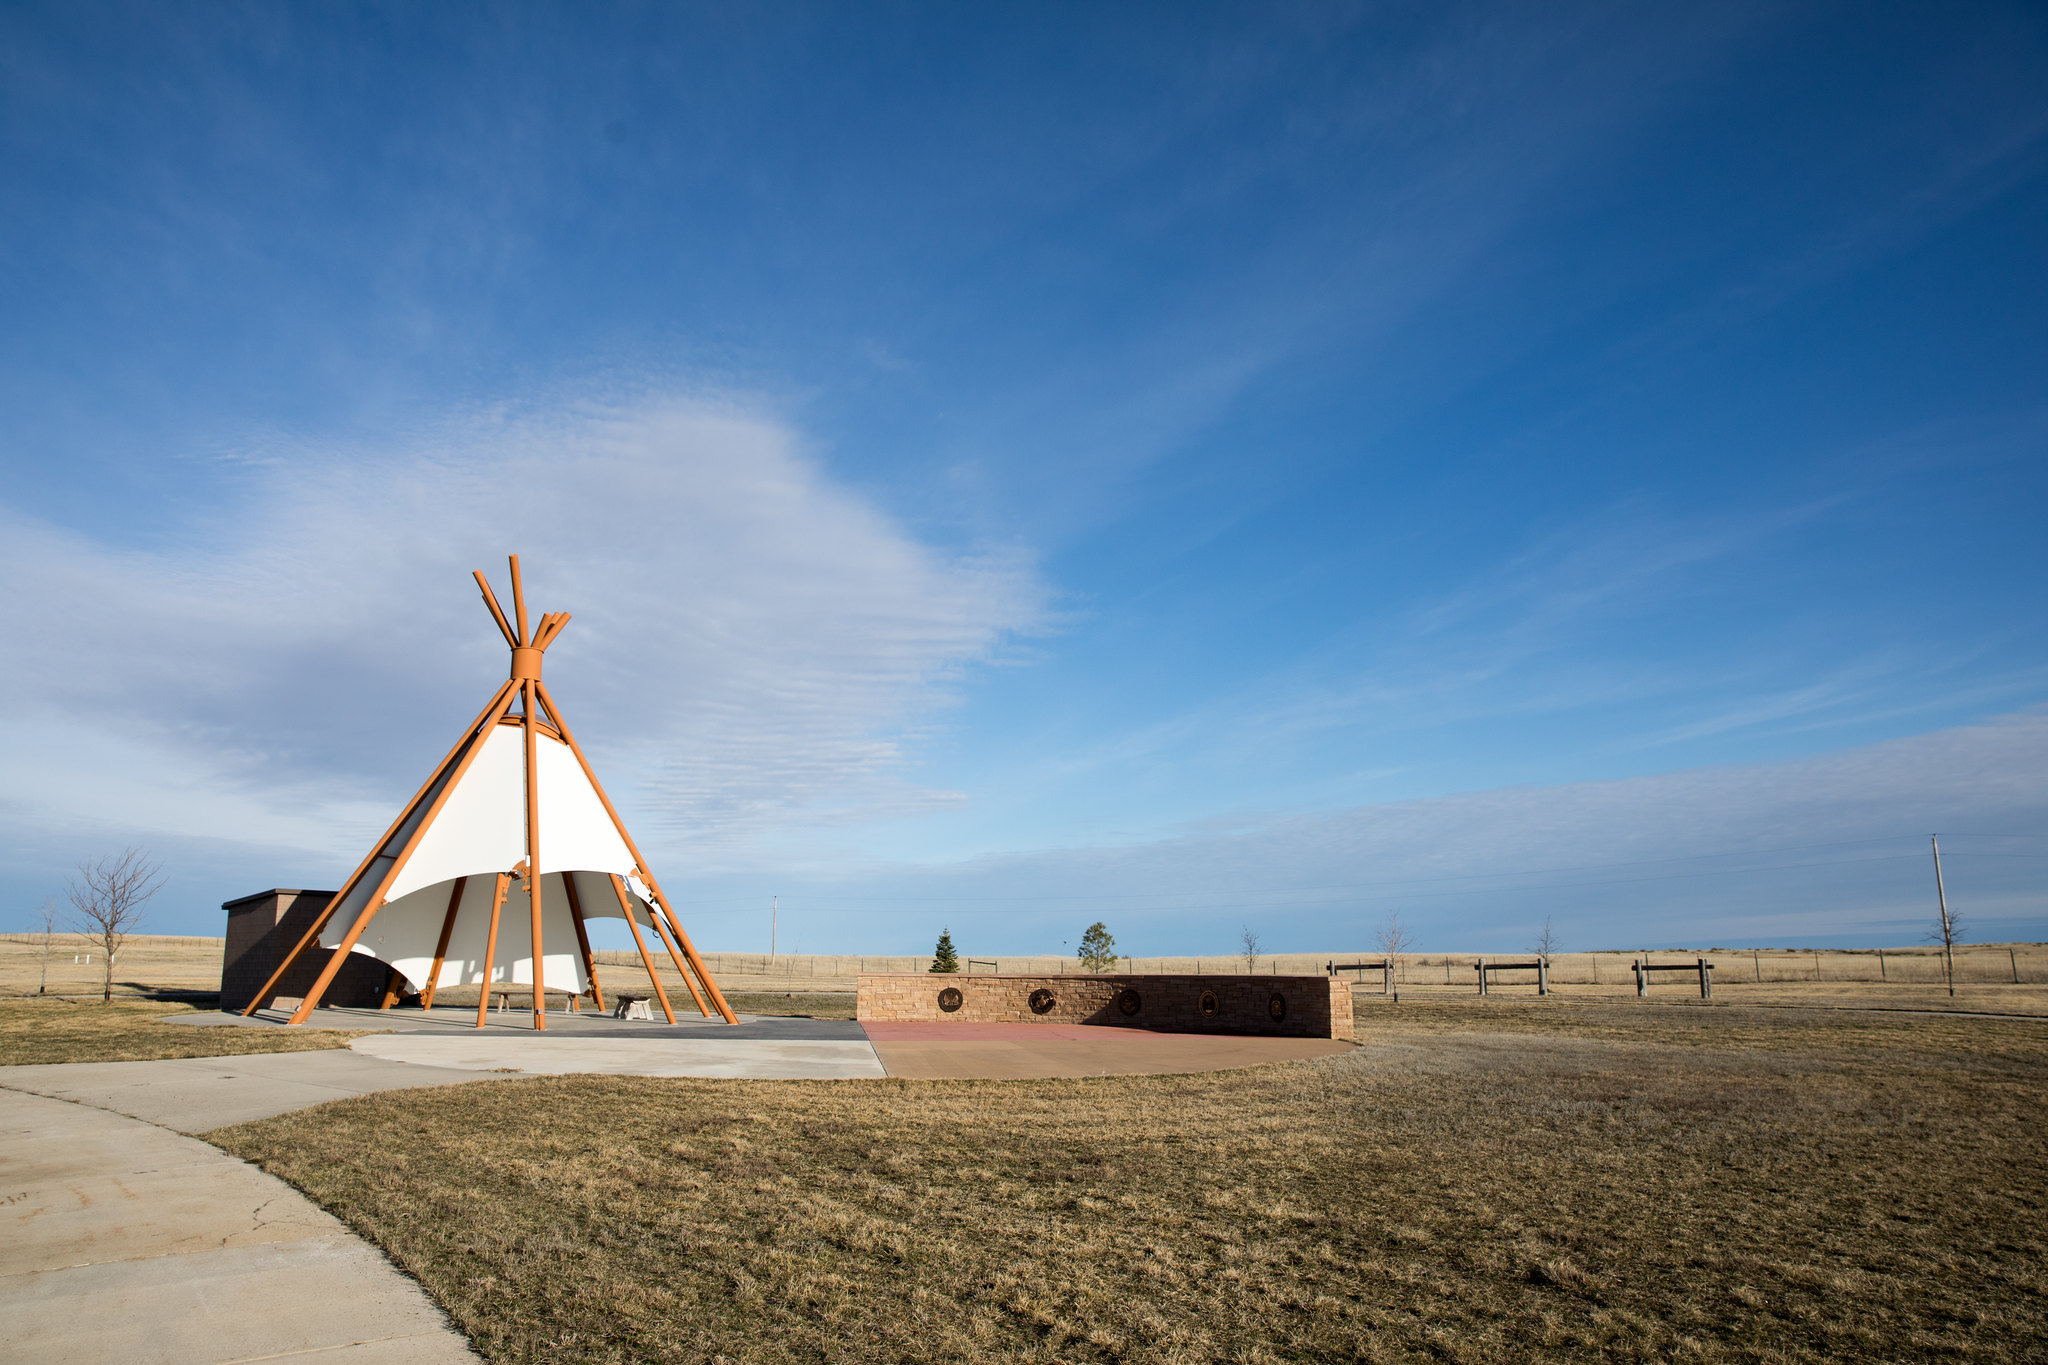
The Native American Lands fare particularly poorly. More than 40% of those 43 counties fall into the Most Disadvantaged group, while another 30% fall into the Disadvantaged group. (See the red areas in the map above.) That means 7 in every 10 Native American Lands counties fall into negative territory. The challenges of these communities can be complicated and range from rural isolation and long-struggling economies to latent (and less latent) discrimination. But the figures here lay out the amount of work that needs to be done in these communities.
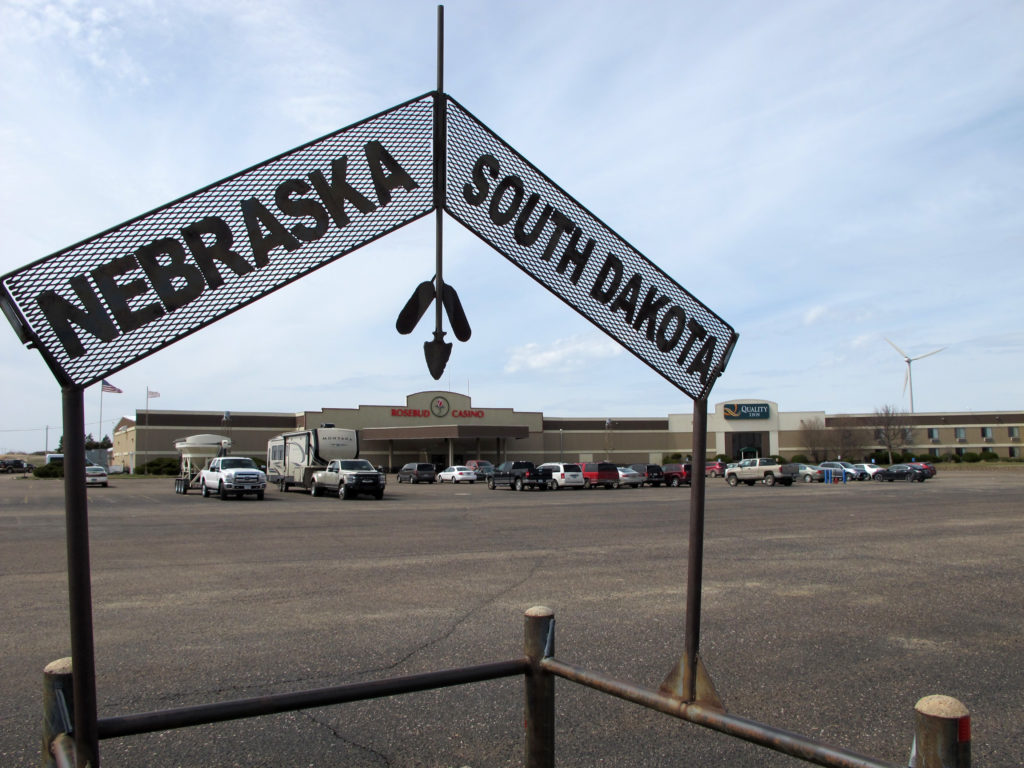
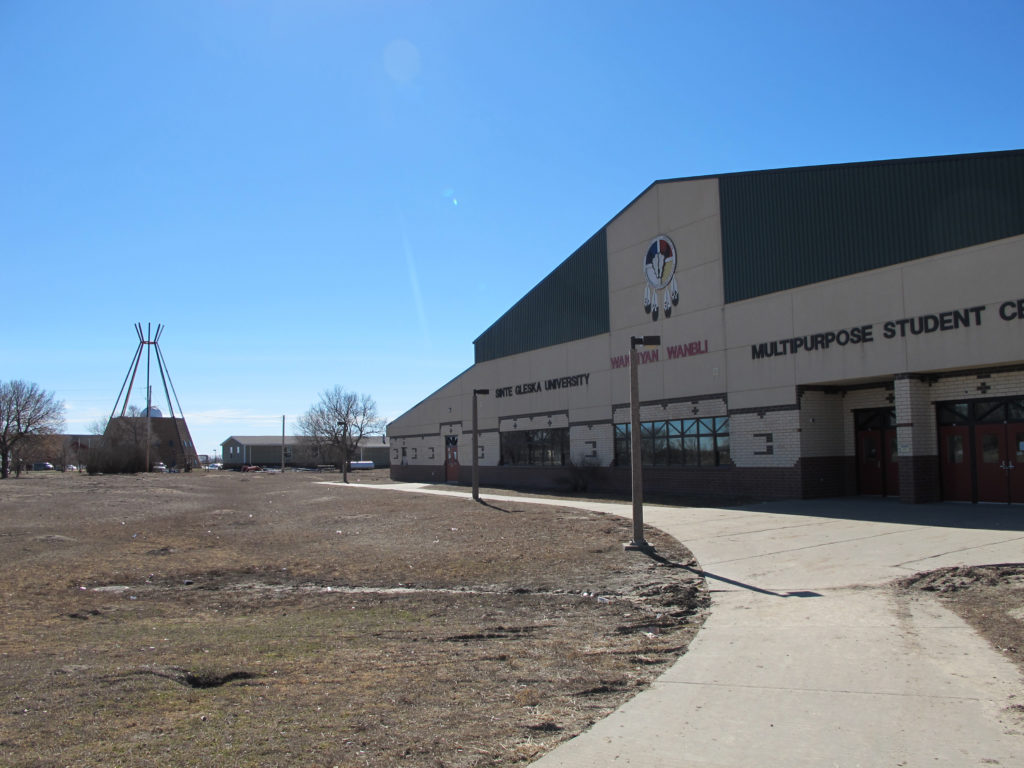
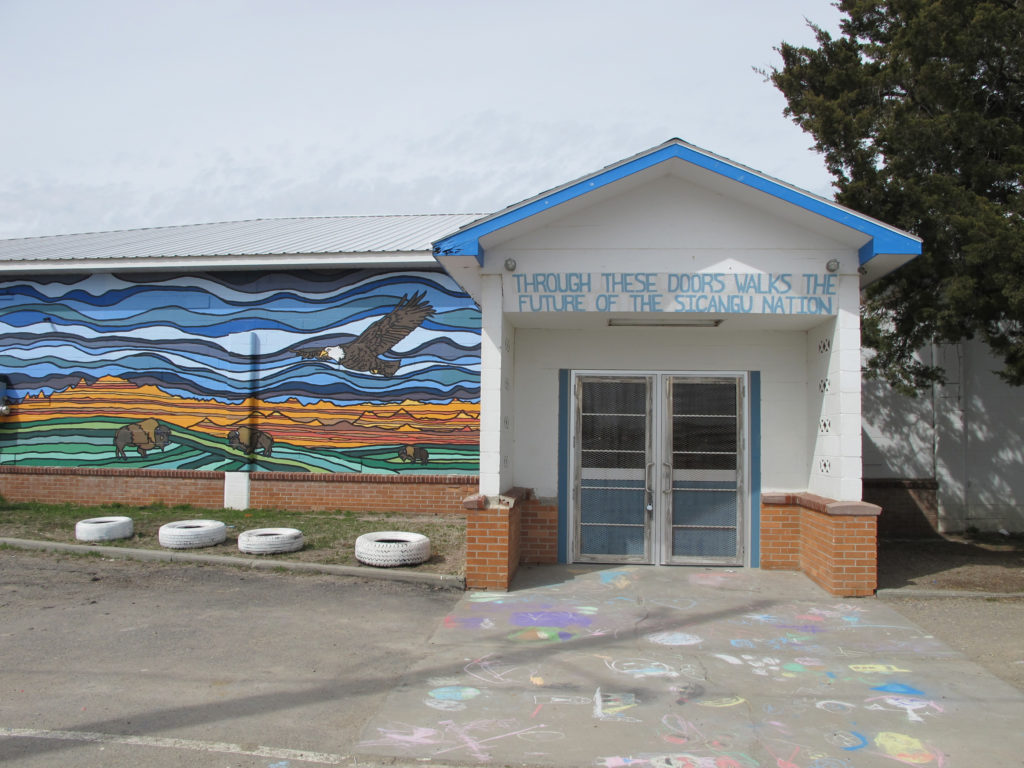
Last year, the ACP visited Todd County, South Dakota, a Native American Lands county in the Most Disadvantaged group, for our rural report. Residents there are working hard to address the difficulties on the ground.
There are a few bright spots. Roberts County, South Dakota, falls into the Advantaged group, with more mobility and a longer life expectancy. The county is also seeing population growth. And five areas in Alaska fall into Advantaged or Most Advantaged. But most of these counties are facing an uphill climb that is steeped in long-term socioeconomic struggles.
African American South
Many of the 370 counties of the African American South also face serious economic hurdles; nearly 80% fall into the Most Disadvantaged or Disadvantaged categories. Many of these counties, most based in the Deep South, share the same challenges. Away from main highways and often without real ties to the global economy, opportunity is lacking. Indeed, some have been struggling for decades with the decline of small manufacturing and small-scale agriculture.
That’s something the ACP saw last year when visiting St. Francis County, Arkansas, an African American South community, for the rural report. The county and its seat, Forrest City, are trying to revitalize a local TV factory and tackle lingering racial tensions. The deep divisions between white and African American residents in St. Francis County are similar to the conditions of other African American South communities. Removing obstacles to economic growth begins with residents recognizing and addressing these divides.
Hispanic Centers
The 161 Hispanic Centers look notably different from the other two minority-heavy community types. Only 20% fall into the report’s Disadvantaged groupings, while 45% are in the Advantaged groups. (See the blue spots on the map above.) One big reason for those differences may be the kinds of communities these tend to be — more directly tied to the broader economy as agricultural and small-town, urban-like hubs.
Finney County, Kansas, a Hispanic Center the ACP visited for the rural report, falls into both those categories. The community is home to a large Tyson Food processing plant, the area’s big Walmart, and other chain stores. Indeed, these small-town hubs are the kinds of communities that tend to draw and hold large Hispanic populations.
It’s worth noting that the Hispanic Center counties also hold a smaller percentage of Disadvantaged counties, 20%, than the nation as a whole, 21%. While much has been written about the tensions and challenges around immigration in the United States, the relative economic success of the Hispanic Centers is a reminder that the picture is more complicated than portrayed.
“To improve health and well-being, people need to participate in the democratic process on a local and national level. Strong election turnout indicates that individuals feel empowered to take action, are engaged with decision-making, and want to influence change,” so states the Robert Wood Johnson Foundation in its culture of health work.
That number can vary a lot from election to election. In November 2016, voter turnout nationally was 55%. In November 2018, turnout was 50%, according to the United States Election Project. That’s high for a midterm.
And here’s one early sign of such engagement for November 2020, according to Gallup data: 64% of American adults said they are more enthusiastic about voting than usual, according to the poll taken in October 2019, 13 months before the election. Typically just over half of Americans are enthused six months or more before a presidential election.
Breakdowns point to elevated enthusiasm across demographic slices, including age — now front and center in this campaign, from vetting the presidential candidates to analyzing the issues dividing boomers from millennials and gen z potential voters.
61% of people ages 18 to 34 said they were more enthusiastic than usual about voting (34% said they were less enthusiastic);
62% of those ages 35 to 54 said they were more enthusiastic (28% said they were less enthusiastic);
66% of those ages 55 and over said they were more enthusiastic (25% said they were less enthusiastic).
Filtering Age and Geographic Groups Through the ACP
But one thing that’s clear in the American Communities Project data: Those voter segments are not evenly spread around the country. So with the 2020 election now eight months away, how does America’s voting-age population look through a dual lens of age and geography? To find out, the ACP has conducted a new analysis, beginning with the overall voting-age population county by county and in the ACP’s 15 community types, then zeroing in on potential young and senior voters county by county and in the 15 types. (Note voting eligibility laws vary by state. These requirements can be found at vote.org, a nonpartisan organization.)
Some Highlights
The urban centers are also youth centers. Young people stand out in Big Cities (47 diverse, segregated, stratified counties): 27% of people ages 18 to 29 dwell in cities. That’s just one part of the large leftward lean of these communities.
Graying America and Rural Middle America, both considered rural types, are senior hubs: 16% of people 62 and over live in one of these two kinds of communities. That age breakdown is an important part of these communities’ cultural conservatism.
Power of the Urban Suburbs (106 multicultural, well-educated, dense, monied counties around cities): 22% of the 18-and-over population live here; 21% of youth and senior cohorts live here. These percentages show a more balanced mix of younger and older voters than other places.
Rise of the Exurbs (222 counties on the fringe of metro areas scattered throughout the country, which can be dense or diffuse): 11% of the voting-age population live in the Exurbs, which have been a bastion for the GOP establishment; and 10% of youth and seniors live here, the third-highest community type for both groups.
The Battlegrounds
The turnout of different age groups in November is likely to play a large role in what happens in these communities and races. So far, the data indicate that 2020 will be a turnout election, driven more by bringing out supporters than by changing minds. Below is a look at some key 2020 battleground states, and the prominent county types in each:
Arizona: Graying America found across the state; Native American Lands in the west; a couple of Hispanic Centers on the border; and Maricopa County, the massive Big City county containing Phoenix, in the south-central part of the state.
Florida: A veritable potpourri of county types, including Graying America up and down the state; African American South counties along the panhandle; the Big City of Miami-Dade; Urban Suburbs, containing Tampa and also near Orlando and Miami; Exurbs and Military Posts in the north.
Georgia: Many African American South counties in the middle and lower tiers; Evangelical Hubs in the north and south; more than a dozen Exurbs on the fringe of Big City Fulton County, containing Atlanta.
Michigan: Graying America and Rural Middle America bordering the Great Lakes, Working Class Country in the southern tier; and Big City Wayne County, containing Detroit.
Minnesota: Rural Middle America on the top and bottom tiers; Working Class Country in the middle of the state; 10 Exurbs around Big City Hennepin County, containing Minneapolis.
North Carolina: African American South counties grouped in the eastern part of the state; Evangelical Hubs concentrated in the west, a handful of Military Posts in the south; and Wake County, a Big City county in the research triangle area.
Pennsylvania: Rural Middle America in much of the middle of the state; College Town Centre County, containing Penn State University; Urban Suburbs and Exurbs around Big City Philadelphia County; the Urban Suburbs of Allegheny County, containing Pittsburgh; and Middle Suburbs east and west outside the metro areas.
Wisconsin: Rural Middle America in the middle and lower sections, Graying America in the upper tier, and Working Class Country in the upper and middle portions.
Of the 53,683,256 people who make up the 18-to-29-year-old voting-age population, 26% (14,045,038) live in places that the American Communities Project classifies as rural: the African American South, Aging Farmlands, Evangelical Hubs, Graying America, Hispanic Centers, LDS Enclaves, Native American Lands, Rural Middle America, and Working Class Country.
Of the 60,628,688 people who make up the 62-and-over voting-age population, 33% (20,077,954) are located in the nine rural community types. This is a significant departure from the 18-to-29-year-old grouping, and further highlights the age and place divisions in this election season.
Editor’s note: The American Communities Project explored rural America across nine community types in our second report released in September 2019, and supported by the Robert Wood Johnson Foundation. We also took deep dives into six communities of different types, including a Native American Lands community.
If you set a New Year’s resolution this year that was financial in nature, you are in good company: 89% of Americans set financial goals to start the year in 2019. We at Oweesta, a national Native nonprofit based in Longmont, Colorado, are blessed to be part of the journey of thousands of individuals each year who are making just these kinds of financial goals for themselves. Oweesta — a word which means money in the Algonquian language of the Mohican — believes very deeply in these individuals. These beliefs are embedded in our core DNA. Our values statement reads: We believe that when armed with the appropriate resources, Native peoples hold the capacity and ingenuity to ensure the sustainable, economic, spiritual and cultural well-being of their communities.
Your ability to meet your financial goals, however, does not happen in a vacuum. We are all embedded in a complex political, social, and economic fabric that works in concert with our individual choices to determine our financial well-being. For Native American, Native Hawaiian, and Alaska Native communities, this includes significant structural barriers and historical injustices, as Native communities experience some of highest poverty and unemployment rates in the country. (The American Communities Project classifies these communities as Native American Lands; the map below shows their locations across the country.)
It is not surprising then that Native American financial capability remains among the lowest of all minority populations in the nation. According to a 2016 study by the FINRA Foundation, Native people are the least likely of all population groups, including other minorities, to plan for retirement, have an emergency fund, or have a checking account.
How We’re Building Financial Skills
These personal finance challenges — coupled with our deep belief that Native communities can take control of their financial futures if given the appropriate tools — led Oweesta to create the financial education curriculum Building Native Communities: Financial Skills for Families. Created more than 20 years ago in partnership with First Nations Development Institute, the curriculum walks through the financial fundamentals in a culturally-relevant way. For Oweesta, this means our curriculum:
Uses relevant examples and imagery
Focuses on the financial capability concerns that are most relevant to Native communities
Uses empowering examples that draw on Native American history and culture
Understands wealth and personal finance from a community-focused perspective that resonates with cultural values
Oweesta provides dozens of train-the-trainers to Native-led organizations serving local communities each year, empowering them to teach the curriculum in their own community. In 2019, 79% of all individuals who attended our train-the-trainers started or led financial education programs that reached more than 8,000 Native individuals last year.
After years of working to improve the financial capabilities of Native communities through the Building Native Communities curriculum, in 2012, Oweesta began a five-year program evaluation of the long-term impact of our financial education efforts. In collaboration with local partner organizations, Oweesta followed 425 individuals for a year after they completed their financial education classes from 2015 to 2018. While a full copy of the report can be found here, the results were, at their core, simple. These financial education efforts were having a profound impact on program participants and — in fact — entire communities. To be specific, individuals were saving more, less likely to use predatory lenders, and felt more empowered over their financial future after taking the class.
Even more compelling than any of our survey data were the stories that flooded in with the responses. Over and over again individuals shared experiences of feeling more in control of their day-to-day lives. Our participants had paid down debt, improved their credit, and bought their first homes.
Building Native Communities: Financial Skills for Families certified trainers and leaders from across Indian Country. Photos courtesy of Oweesta.
Looking Forward
As Oweesta looks to 2020, we are reinvigorated by the strength and success of these individuals. We renew our commitment to supporting Native communities in building their financial capabilities not only through our existing Building Native Communities: Financial Skills for Families program but also through the new programs we’ve launched this past year. In 2019, we began a financial coaching training program, designed to empower practitioners to provide one-on-one or family-centered financial coaching to community members. Such coaching is inherently client-driven, helping individuals set and meet their own financial goals on their own timeline.
In December, we released a youth version of our much-loved financial education curriculum to connect with young people ages 14 to 22. Curriculum development was led by an advisory team of Native-practitioners across Indian Country who were inspired by the seventh-generation teaching that youth are our future.
Gallup Central High School students participating in a financial literacy training hosted by First Nations Oweesta.
So, if you are considering setting a financial goal for yourself at the start of this year — or perhaps even a goal for this decade — we say to you this: Go ahead, we believe in you. And, if you want support in your journey, we recommend finding a local nonprofit for financial coaching.
Krystal Langholz is Chief Operating Officer of First Nations Oweesta.
This year, the American Communities Project took a deeper dive into rural America and explored the complexities under that two-word phrase. With the holidays here, the ACP looks at the cultural and consumer differences in the many kinds of place that define the nation’s rural landscape with the help of MRI-Simmons.
So, what does the holiday season look like in the 2,243 counties and nine county types that make up rural America in the ACP? It depends on where you are.
Shopping Habits
Holiday shopping is more likely to be a family affair across the rural American landscape — 35% of people in rural America said they prefer to shop with their family compared with 32% of the country overall. But the numbers look very different by community type.
The numbers are highest in the Hispanic Centers. There, 41% of those surveyed said they prefer to shop with their families. In the Aging Farmlands, the figure is only 32%. The other types are scattered in between these two.
Some of the differences between Hispanic Centers and Aging Farmlands might be about family composition. Hispanic Centers tend to hold more young families, meaning family shopping is more possible, while the Aging Farmlands tend to have fewer families overall. But the net result is a very different dynamic around the shopping experience.
In may be a surprise that residents in rural communities also reported being slightly more likely to “shop frequently” than people in the nation overall, according to the consumer data — 32% versus 30% overall. The number is highest, 37%, in the Mormon-heavy LDS Enclaves, which tend to be home to larger families. The Hispanic Centers are a close second at 34%, again perhaps because families simply need to shop more.
But on a uniquely holiday-related statement — I find it hard to resist my child’s requests for non-essential purchases — there’s more unity. Rural communities and the nation as a whole at least said that it’s not that hard to say no. Only 19% in both segments agreed with that statement.
There are some differences across the rural types. In Hispanic Centers, 21% said they have a hard time saying no, while in the Aging Farmlands, the figure is much lower at 16%. Most communities, however, sit between 18% and 20% on the statement.
Where Residents Shop
When it comes to where rural Americans will likely be shopping this holiday season, geography and store locations matter, and the consumer landscape simply looks different depending on where exactly you are in rural America.
Consider the Dollar General chain of stores. Nationally, about 19% of Americans frequent those stores, but in rural America, the figure is 24% — and much higher in some kinds of communities.
Dollar General’s reach into rural America has been well-documented — most are located in towns with fewer than 20,000 residents — and the chain’s expansion has been epic. NBC News recently reported that Dollar General is opening about 20 stores a week. Its main target is lower-income families, which as we noted in our rural report this fall, are bigger parts of the African American South and Working Class Country.
But the real rural appeal of the chain may be the size of its stores. In an era where much of brick-and-mortar retail is about massive square footage, Dollar General outlets have smaller footprints that make more sense in rural communities. In the process, local rural retailers have discovered a new foe.
At the other end of the spectrum, of course, many Americans will do their holiday shopping at Walmart. At a time when divides are often the discussion point, Walmart is a great uniter. A staggering 62% of Americans overall said they shop at Walmart. In rural communities, the figure is lower but still relatively high at about 51%.
On the whole, Walmart is one retailer with a big enough national footprint to register large customer bases in urban and rural communities. Across nearly all the ACP rural types, at least 26% of those surveyed said they shop at Walmart.
The exception is the sparsely-populated Aging Farmlands, where just 4% said they shop at the mega stores. Physical distance still dictates a lot of where people shop in those communities, and the nearest Walmart can be hours away in some locales.
A Toast to 2020?
When the clock strikes midnight on December 31, rural Americans will likely be celebrating a little differently than the rest of the country — or least be sipping something different in their glasses. Nationally, 51% of Americans have had a drink in the past 30 days. However, in the ACP’s rural communities, the figure drops to 46% — and in some places it is much lower.
As you might expect, the LDS Enclaves are the least likely to have had a drink in the last 30 days — only 17% said they had imbibed. In the African American South, the figure is 33%. And in the Native American Lands, 37% reported they had any alcohol.
The outlier is the Aging Farmlands. More than 57% of the people who live in these communities said alcohol has touched their lips in the past month.
That means the most rural community type in the ACP is more likely to have a drink this New Year’s Eve than any of its rural counterparts or the nation as a whole — proving once again that rural stereotypes often do not hold.
“Leisure has been, and always will be, the first foundation of any culture,” German Catholic philosopher Josef Pieper wrote in his 1952 seminal title Leisure: The Basis of Culture, which traces leisure’s history from the ancient Greeks down through the ages.
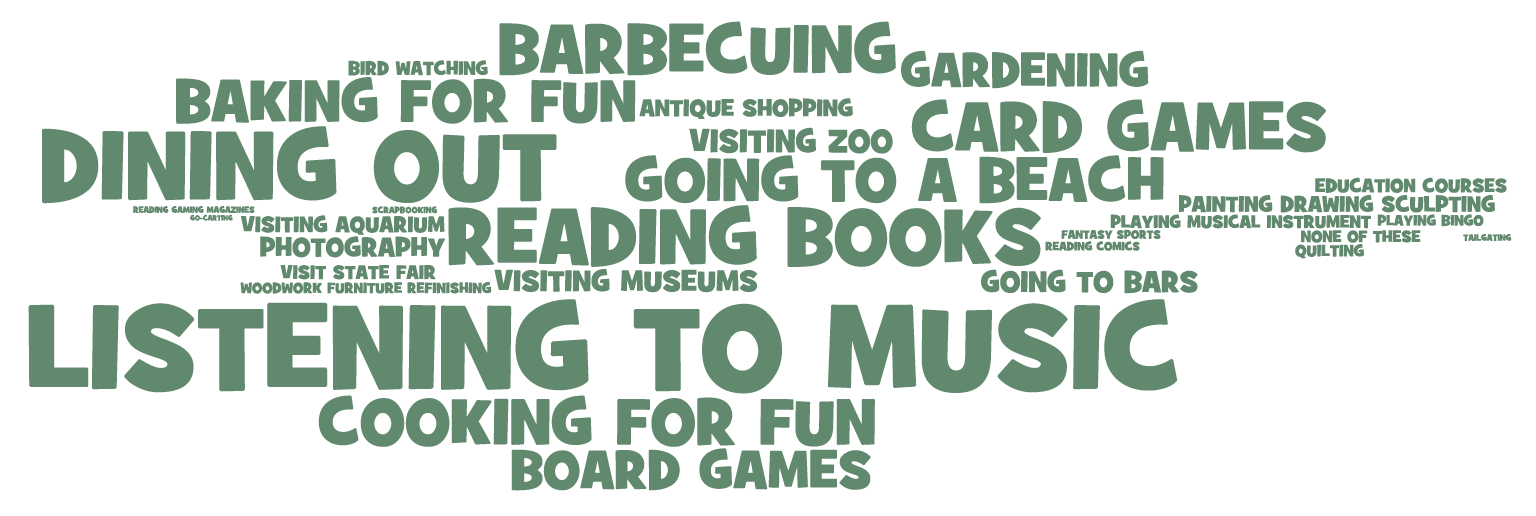
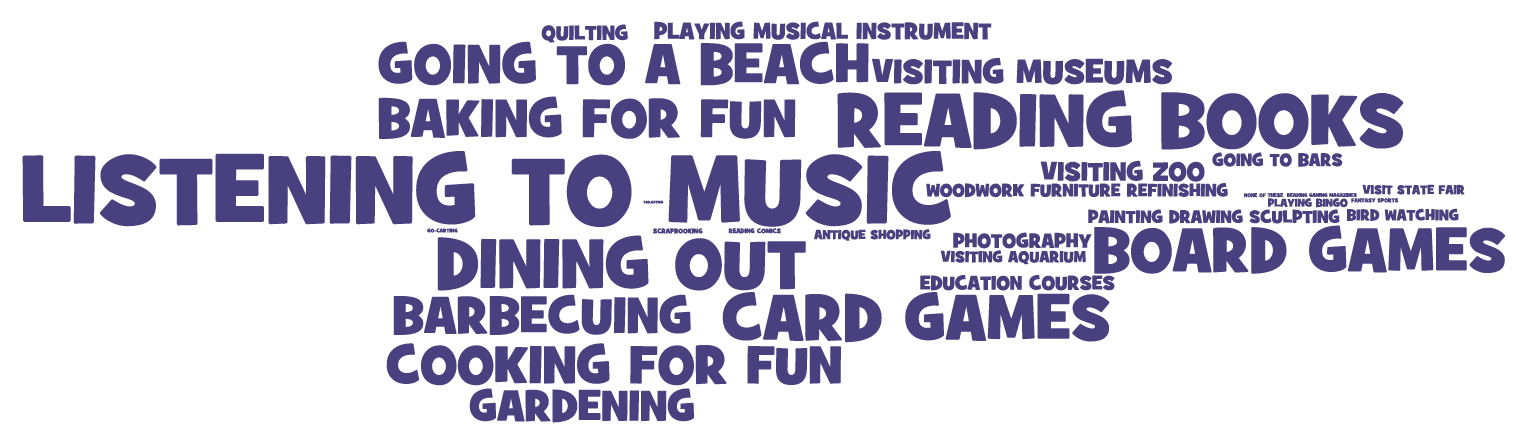
Today with so many facets of American life funneling into an ongoing culture war, conventional wisdom would suggest that Americans break apart in their leisure choices, too. To the contrary, Simmons National Consumer Survey shows that Americans nationwide continue to enjoy the same leisure activities by significant margins — listening to music (65%), dining out (55%), and reading books (46%), for starters. This similarity holds when drilling down into geographic groups, based on a new American Communities Project analysis of Simmons’ data.
The firm asked respondents about 30 different leisure activities/hobbies they engaged in during the last 12 months, as shown in the word cloud below. It’s true that some community types stand out for residents’ participation in niche activities, such as antiquing, bird watching, going to bars, painting/drawing/sculpting, and playing bingo. However, here, too, Americans in different communities can find common ground.
In the Simmons National Consumer Survey, respondents were asked to mark the leisure activities or hobbies in which they participated in the last 12 months. There were 31 choices, which included “none of these.”
Activities With Widespread Appeal
Last year, we wrote that listening to music was the most popular leisure activity in America and the common denominator among all community types, based on the 2017 Simmons survey. That remains the case in the 2018 survey. Besides music, reading, eating, playing games, and preparing food top the list of leisure activities/hobbies — all underscore universal values of learning, connection, and nourishment.
The word cloud below illustrates the popularity of the hobbies asked about. The larger the word or phrase, the greater the number of people across the country participate in that hobby.
Spotlight on Reading and Cooking
While there’s been a lot of discussion about the waning number of readers in the digital age as well as a heightened focus on other ways Americans consume books, as a recent Pew Research Center survey showed, both the chart and word cloud illustrate that reading books remains one of the most popular hobbies across community types. LDS Enclaves, filled with younger residents seeking good, clean fun, outpace all other groups at 56%. Hispanic Centers, also dominated by youth but where many new immigrants may struggle with English reading comprehension, are at the bottom of the pack at 39%. College Towns gravitate toward the higher end, at 49%, but not overwhelmingly so. Twelve community types stand at or above 45%.
From youth to seniors, about a third of residents in each community type reported cooking for fun in the past year. In College Towns, 36% reported doing so while 33% in Graying America said the same. Food is a big deal in college. College Towns’ recent struggles with food insecurity are well-known, as we reported last year; the 2019 County Health Rankings analysis found that 14% of residents in College Towns are considered food insecure. Meanwhile, food insecurity affects 13% of residents in Graying America. At the same time, food can be freely available on college campuses and in retirement communities.
According to the 2019 County Health Rankings, these five community types stand out for having unfavorable housing and neighborhood circumstances that can make cooking for fun (and baking and barbecuing) challenging. Gallup’s latest Well-Being Index also shows many residents in these areas have trouble affording food.
Severe Housing Problems Average:% of households with at least 1 of 4 housing problems: overcrowding, high housing costs, lack of kitchen facilities, or lack of plumbing facilities. (Source: 2019 County Health Rankings)
Food Environment Index Average: Index of factors that contribute to a healthy food environment, including income and proximity to a grocery store. (Source: 2019 County Health Rankings)
Not enough money to buy food (Source: 2018 Gallup Well-Being Index)
African American South
16%
6.2
31%
Big Cities
22%
7.6
21%
Hispanic Centers
17%
7.6
30%
Native American Lands
25%
4.7
30%
Urban Suburbs
19%
8.2
17%
Popularity of Hobbies by Community Type
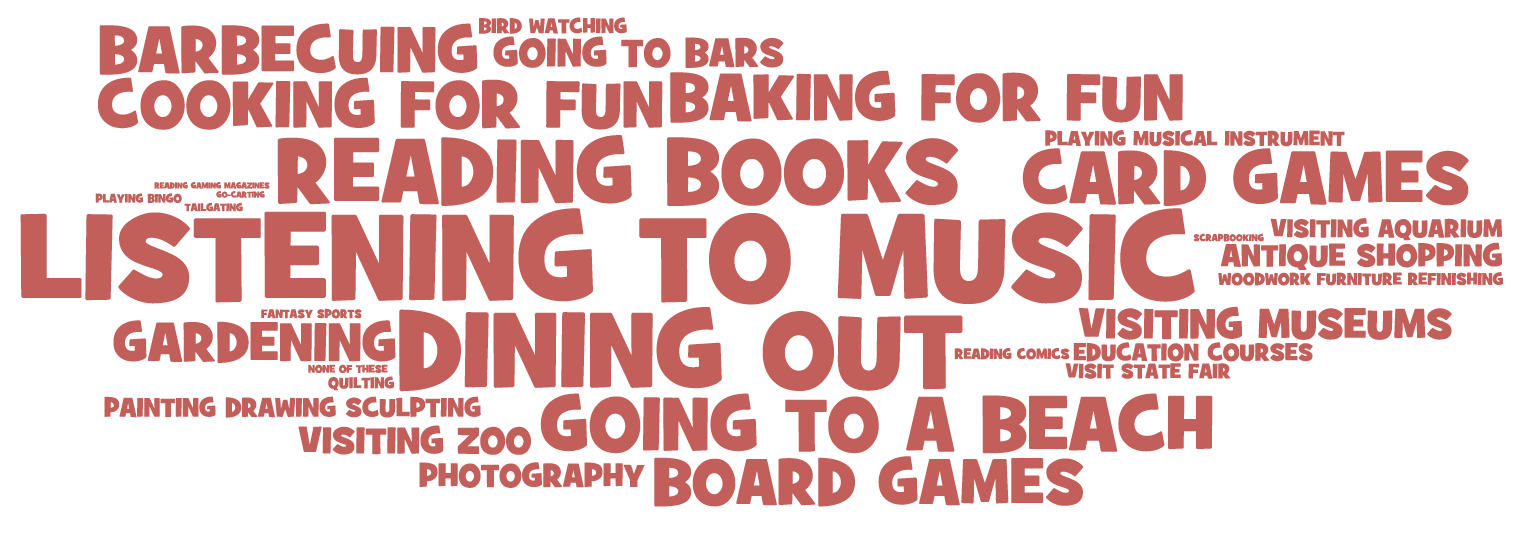
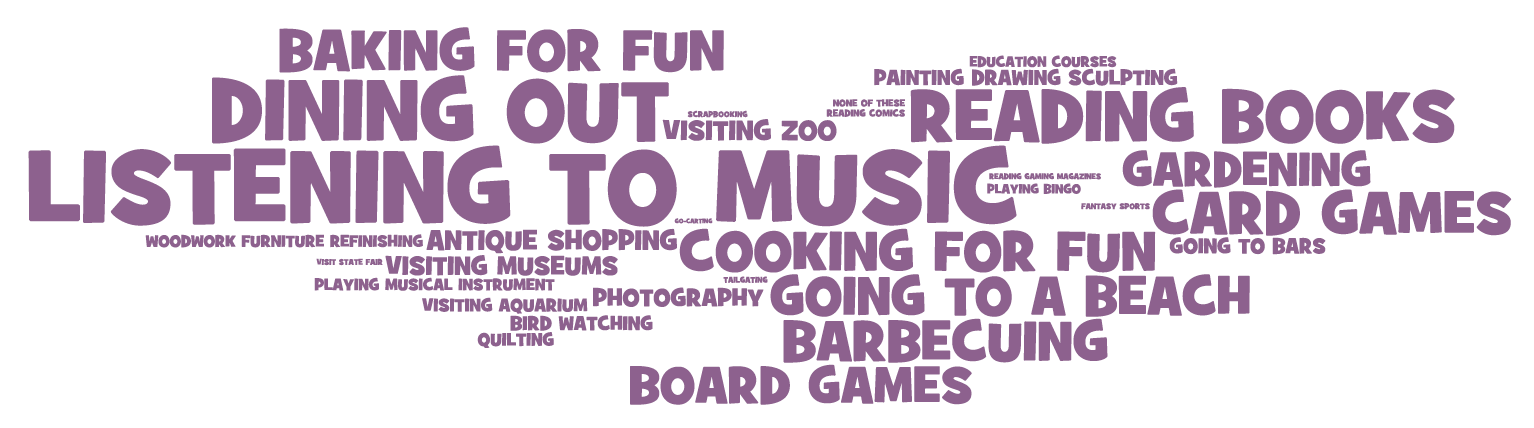
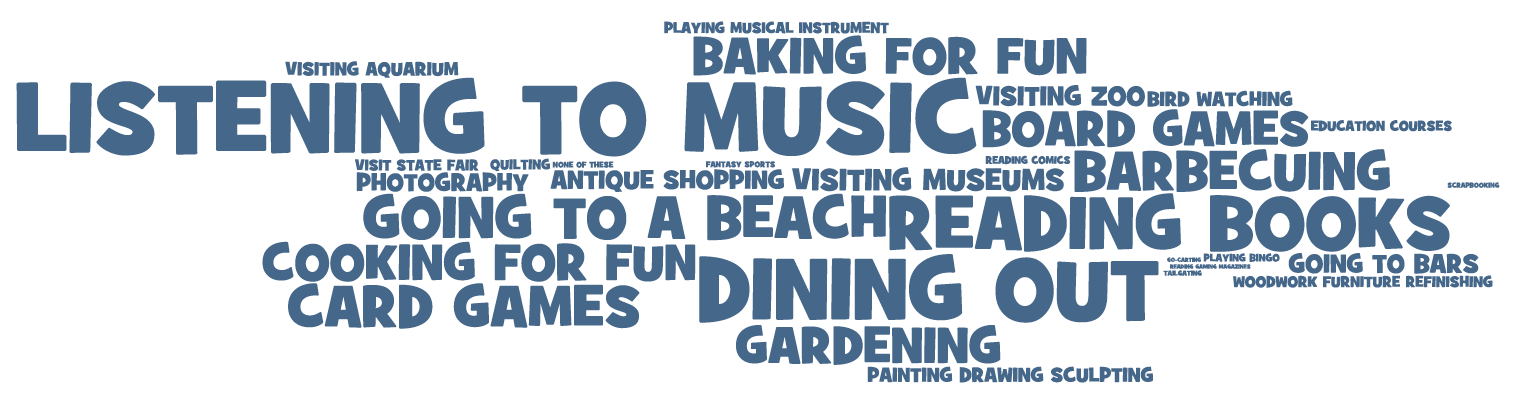
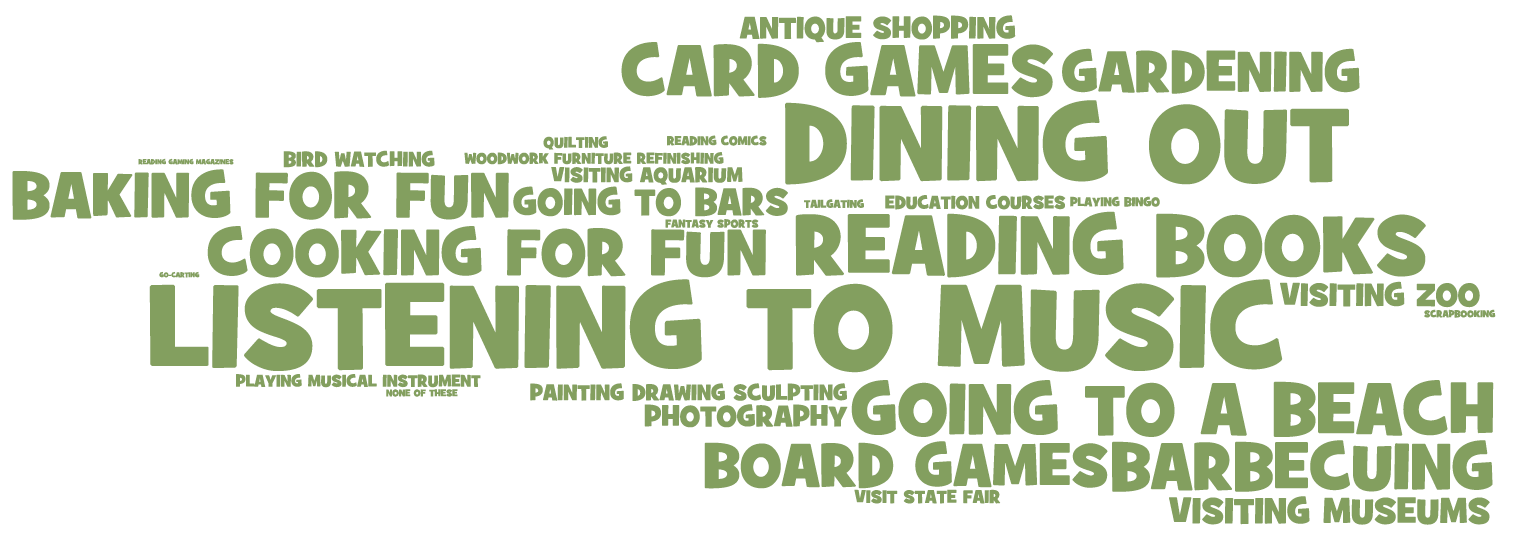
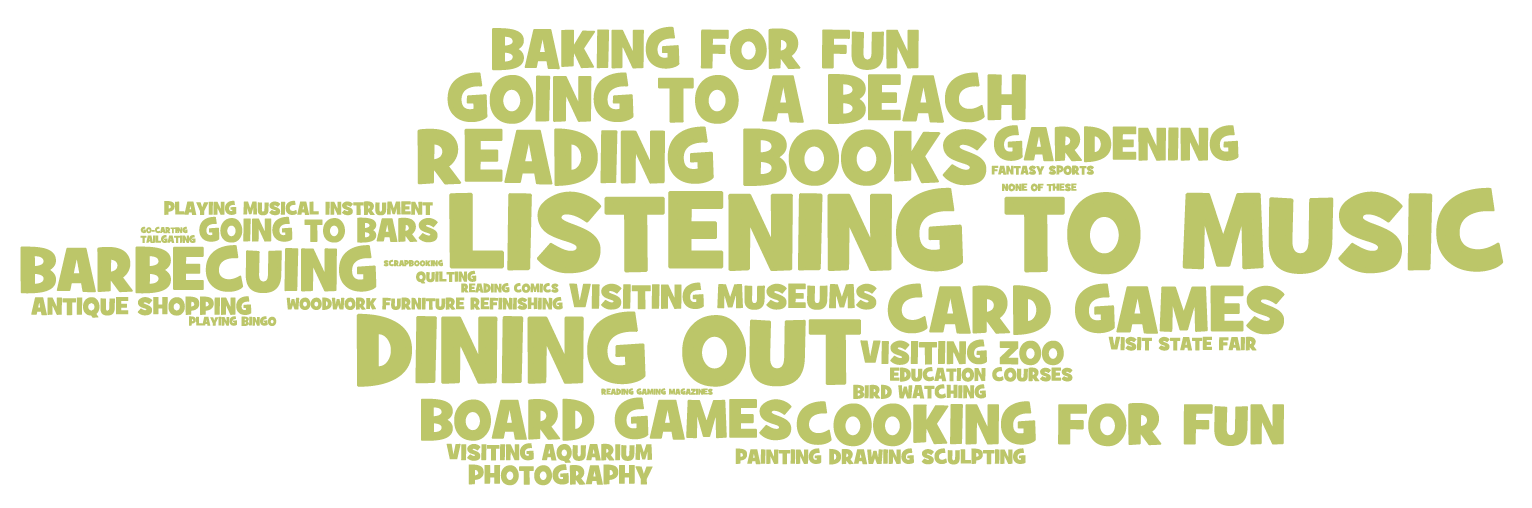
Below is a closer look at how hobbies stack up in each of the ACP’s 15 community types. The bigger the word or phrase in the word cloud, the more people said they participate in that hobby.
African American South Hobby Cloud
Aging Farmlands Hobby Cloud
Big Cities Hobby Cloud
College Towns Hobby Cloud
Evangelical Hubs Hobby Cloud
Exurbs Hobby Cloud
Graying America Hobby Cloud
Hispanic Centers Hobby Cloud
LDS Enclaves Hobby Cloud
Middle Suburbs Hobby Cloud
Military Posts Hobby Cloud
Native American Lands Hobby Cloud
Rural Middle America Hobby Cloud
Urban Suburbs Hobby Cloud
Working Class Country Hobby Cloud
Community Niche Hobbies
As indicated above, less popular overall but still occupying a sizable chunk of Americans’ leisure time are several different activities, including:
gardening (28%);
going to bars/nightclubs/dancing (19%);
antique shopping/shows (14%);
painting, sculpting, drawing (12%);
bird watching (10%);
playing bingo (7%).
This is just a sampling of the 30 different leisure activities/hobbies Simmons asks about. There’s much activity overlap among community types, and some hobbies are popular or unpopular in particular kinds of places. It’s worth noting that about 7% of respondents said they didn’t participate any of the 30 choices. Residents in the African American South, Big Cities, Hispanic Centers, and Native American Lands were more likely than average to check this response.
When digging deeper into the degree to which community types fall above or below these averages, it’s clear that gardening is more popular in whiter, more rural communities as well as the Middle Suburbs. These communities cover a broad age range. Gardening is less popular in communities of considerable ethnic and racial diversity, whether these populations are in rural, urban, or suburban areas. (Scroll over the bars below for percentages.)
Similar to gardening, a broad swath of the country enjoys antique shopping/shows more than average. The rural and suburban regions include the heavily white Aging Farmlands, Rural Middle America, Middle Suburbs, Working Class Country, Exurbs, and College Towns. Antique shopping is much less popular in Big Cities as well as youth-dominated LDS Enclaves and Hispanic Centers. African American South counties rank much below average, too.
Not surprisingly, College Town residents groove on going to bars. Older Middle Suburban and Aging Farmland residents are more likely to go out to bars and dance, too. The activity seems anathema to more religious communities, including LDS Enclaves and Evangelical Hubs. Residents in communities of color are also less likely to take to the bar scene.
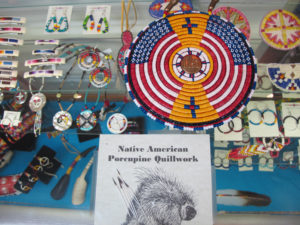
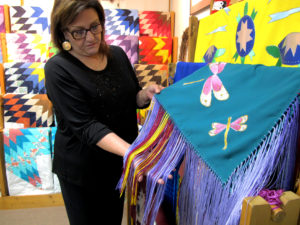
Painting, sculpting, and drawing are major activities in Native American Lands, where art is often a prized part of the culture. In another youth bastion, College Towns, many students, staff, and faculty take up this art hobby. Working Class Country, much of which rolls along the striking Appalachian and Ozark mountain landscapes, is also home to more artists than average.
Bird watching is a preferred pastime in a range of rural and exurban counties, where there’s ample space for observing. People are much less likely to participate in denser cities and suburbs as well as Hispanic Centers.
Residents in communities of color, including the African American South, Hispanic Centers, and Native American Lands, as well as religious Evangelical Hubs and LDS Enclaves are much more likely to play bingo than other groups do. Bingo is not as desired in rural community types, including Aging Farmlands and Rural Middle America. Graying America, with its high senior population, has an average number of bingo players, which is why it’s not depicted below.
A Solid Foundation
Overall, this research shows Americans have several kinds of activities in common when they’re not working, providing time for coming together this holiday season — and beyond.
Wealth can be a difficult thing to measure in rural America, especially with the naked eye. Conspicuous consumption is a rarity. But a look inside the bank accounts of different rural communities shows just how varied the wealth picture can be, according to an analysis by the American Communities Project.
Some Overall Findings
The federally-insured deposits per household in the median Aging Farmlands county are more than three times higher than the figure in the median Native American Lands.
Aging Farmlands also stand above the median for all U.S. counties.
More racially diverse rural communities tend to have lower average deposits.
Bank Account Data Reveals More Divides
The figures, examined using the rural community typology the ACP unveiled in its September report, A New Portrait of Rural America, show a remarkably uneven economic landscape and explain why developing a single strategy for rural development is a challenge.
To get a sense of the wealth in communities, the ACP took 2018 county-level bank deposit data from the FDIC and sorted it through the 2,243 counties and nine community types in our new rural typology. We divided the county dollar figures by the households in each county to get a sense of the average amount per home.
The differences in the numbers were revealing, even when looking at counties that sit near one another. For instance, in Gove County, Kansas, (Aging Farmland) the overall average deposit per household was more than $121,000, while in neighboring Trego County, another Aging Farmland to the east, the figure was less than $41,000 per household.
The Broad Strokes and Confines of the Rural Wealth Picture
To be clear, these numbers do not represent what the average household in these communities actually has in its bank account. They are not a perfect approximation of wealth. The numbers could overstate the wealth picture in communities with fewer people and one or two wealthy households or businesses. Similarly, they could understate the wealth picture of a place with a cluster of poverty and a large share of middle-income homes.
But the figures do give a sense of the hidden assets found within a community. And viewed through that prism and the rural typology of the ACP, some clear patterns emerge.
The Aging Farmlands stand head and shoulders above other rural communities. The median county has an average insured deposit of $81,800. The next closest rural community type is the Hispanic Centers, where the median county sits at $54,900.
Those numbers are remarkable by themselves — and speak to the unique characteristics of those places.
Where and Why Deposit Rates Are in High Relief
The Aging Farmlands are land rich, but face a people problem. As we noted in the report, and in Gove in particular, many of these counties are simultaneously losing population and seeing the average size of farms grow. That’s a set of circumstances that would trend toward large dollar amounts in a small set of bank accounts. The numbers provide more evidence that the economic challenges of “rural America” are not all about distressed communities and lack of capital.
Meanwhile, the higher deposit numbers in the Hispanic Centers may be driven by a larger number of businesses in them. Many tend to be home to businesses that have served as magnets for immigrant populations. That was true in Finney County, the Hispanic Center we visited for this fall’s report, which actually is the median county for FDIC deposits in its type. Among other employers in the rural hub is the massive Tyson Fresh Meats plant that employs 3,000 people, which may skew the deposit number there.
The small-town communities of Rural Middle America, have some of those same rural hub qualities — higher population density and more businesses — and have a similar FDIC deposit median figure, $54,600. But higher median household income and lower income inequality figures in Rural Middle America communities show that bank deposits are, at best, a limited measure of a community’s overall economic health. Even in communities with similar deposit figures, the economic outlook can be very different.
Beyond Surface Layer: Community Types with Capital Challenges
One point that does stand out in the data: the median counties for two additional communities with large populations of color have considerably lower deposit numbers than rural community types as well as the national and rural median county.
In these places, the challenge isn’t freeing up local capital, it is often attracting or building capital — a tougher obstacle to overcome and one that calls for its own set of solutions.
And those challenges reach beyond communities of color to the largely white rural counties of Working Class Country, where the median county has an average deposit of $38,400 per household. Those more remote counties tend to have lower incomes and lack economic engines or highways to allow for easy transit of goods or people.
Taken together, the federal bank deposit numbers offer yet another example of the complexities of “rural America.” That phrase that has come to mean a single coherent place in Washington, but in reality it is deeply fragmented. The unevenness in these figures provides more evidence that any set of policies aimed at aiding rural communities needs to account for the varied realities of these places.
by American Communities ProjectOctober 03, 2019Print
On Sept. 26, 2019, the American Communities Project published a report on rural America, supported by the Robert Wood Johnson Foundation. Four videos from the release event follow.
Session 1: The American Communities Project Director Dante Chinni reveals report findings.
Session 2: Rural community leaders share their stories and insights with the ACP’s Ari Pinkus.
Roberto Becerril, Project Manager, Neighborhood & Development Services, City of Garden City in Finney County, Kansas
Daniel Busch, Mayor of Salem in Fulton County, Arkansas
Ellen Huber, Business Development & Communications Director, City of Mandan in Morton County, North Dakota
Ericka Nicholson, Director, Gove County Economic Development in Gove County, Kansas
Cedric Williams, Mayor of Forrest City in St. Francis County, Arkansas
Session 3: The ACP chats with Dee Davis, president of the Center for Rural Strategies, and Matthew Chase, CEO/executive director of the National Association of Counties, about key learnings and next steps.
by Dante Chinni and Ari PinkusSeptember 25, 2019Print
In 2019, rural America is a place that many discuss and debate but few actually understand well. In the minds of much of the citizenry, it is often a mythic realm, its boundaries and terrain defined by pop cultural imagery and datelines from small towns — amber waves of grain in front of an old red barn punctuated by a news account from a region defined as Appalachia.
As conversation grows about how to address or “fix” the challenges in the nation’s rural places, such a simple interpretation will no longer do.
The geographic, demographic, and socioeconomic landscape of rural America is remarkably diverse. Depending on the community in question, rural America can be hilly and remote, or it can begin at an exit off an interstate with flat lands stretching to the horizon. Its racial and ethnic composition can look like America from 50 years ago, or it can be ahead of the demographic changes that are reshaping the country. Its economy might be driven by tractors and commodity prices but more often by small factories and the retail trade.
Rural America, in other words, is not a monolith. Its wide-ranging, evolving communities have different strengths, face different trials, and need different policy solutions.
This report from the American Communities Project (ACP) at The George Washington University uses data and on-the-ground reporting to explore those differences and blow up the mythology that too often has come to define rural America. The analysis here, funded by the Robert Wood Johnson Foundation, should inform the growing discussion about the “urban/rural” divide by showing the enormous complexity underpinning the phrase “rural America” in 2019.
The work here reinforces the idea that where you live matters a great deal to how long and how well you live, even within areas collectively defined as rural. It also explores misconceptions about the relationship between health and geography. Cross-analyzing data, including numbers from the County Health Rankings and Roadmaps, Gallup, and Simmons Consumer Research, the American Communities Project’s work here illustrates the gaps in opportunities for health.
The term “rural America” is not a simple one to encapsulate. Depending on your source, there are densely populated urban metropolitan areas that hold rural terrain and, thus, could be considered rural America. At the same time, there are some definitions of rural America that exclude small-town urban centers.
The map below contains the counties that are considered rural by the Health Resources and Services Administration definition as they fit into the nine rural community types of the American Communities Project.
Across our analysis of these communities, there are six major findings — and a list of important factors driving them.
Major Findings
The physical and demographic landscape of rural America is remarkably diverse. While there is a tendency to view rural America as the cultural world portrayed in Grant Wood’s famous American Gothic painting — of a white farm couple posing with pitchfork in front of their farmhouse and barn — there are more than 500 rural counties in the African-American South, Hispanic Centers, and Native American Lands where the median white, non-Hispanic population is under the national average.
The economic challenges and opportunities in rural America vary greatly. The average median household income in the rural Latter-Day Saints (LDS) Enclaves is roughly $55,000. In the African American South, it is less than $38,000. In the LDS Enclaves, the childhood poverty rate is 15%. In the African American South communities, the rate is 33%, which is 11% above the rural median.
Education matters. The three community types with the highest unemployment rates are also below the rural America average for some college education. The data suggest that, even with the immense diversity of rural America, improving education is key to a better life and more opportunity. A push toward extending educational expectations to community college could pay large dividends.
There are stark differences in health care as evidenced in health insurance rates. In the rural Working Class Country, only 9% of the population is without health insurance. In the rural Hispanic Centers, the figure is 18%.
Some parts of rural America are seeing dramatic losses in population, but other kinds of communities are growing. Nearly 80% of the rural communities in the African American South have lost population since 2010. But fewer than 50% of the rural counties in Graying America have lost population since then — and overall the population of those counties has grown.
Infrastructure, real and digital. Across rural America, there is little correlation between population and paved roads. Some of the most densely populated places, such as the African American South, have fewer miles of road than the sparsely populated Aging Farmlands. Internet connections and speeds also look very different in different community types. In rural Hispanic Centers, 80% of the households have a high-speed Internet connection, but in Native Americans Lands, the figure drops to 40%.
These findings underscore the nuance and complexity of rural America today. The larger point behind all these differences, however, is simple. When policymakers and funders look to create rural-focused solutions, they should not focus on silver-bullet, one-size-fits-all answers. The diversity of rural America can be a strength, but it also means single solutions are unlikely to work in all rural communities.
A Snapshot in Data
Many of the differences outlined in the bullet points above can be seen on the interactive map below, click on a county or enter its name in the box to see how it compares to its larger rural type on a number of different factors.
The Nine Rural Community Types
= median of all rural counties
Population change 2010-2018
Percentage white, non-hispanic
Percentage uninsured
Percentage in fair/poor health
Percentage with at least some college education
Median household Income
Miles of road in county
Median home value
For the remainder of this chapter, we analyze data from the nine rural community types across five broad topics: demographics, economics, infrastructure, daily life, and health care.
In subsequent chapters, we explore the ACP rural landscape with profiles of six different rural communities we visited:
two counties in Arkansas — Fulton (Working Class Country) and St. Francis (African American South);
two counties in Kansas — Finney (Hispanic Centers) and Gove (Aging Farmlands); and
These profiles put faces, voices, and real communities behind the numbers. We chose places proximate to one another to show how quickly rural America can change. You can get in a car in one kind of community and get out in a completely different one, all without leaving “rural America.”
In short, in data and on the ground, rural America looks nothing like the monolith it is often portrayed as in the media and in Washington.
We believe this report is a call for a new understanding about the complicated set of places that make up the majority of the nation’s land. The different community types we outline here hold different strengths and face different challenges. They are driven by different economies and different kinds of populations. Simply put, there is no one-size-fits-all approach to policies for rural America.
We hope this report is an important step toward people gaining that understanding.
Demographics
While rural America is often thought of as a sea of similarity — largely white and generally older than the country as a whole — the demographic look and feel can change on a short drive. The races and ethnicities that define one rural community can be very different from those in a rural community nearby. And while much of rural America has seen population declines, the drops are far from uniform. The differences are stark in the community types of the ACP.
Race and Ethnicity
On the most basic level, rural America, as defined in this report, is less diverse than the nation as a whole. The median county in our collection of 2,243 rural places is 87% white, non-Hispanic. The mean for all rural counties is 78% white, non-Hispanic, still less racially and ethnically diverse than the nation overall. (In the U.S., the mean is 60% white, non-Hispanic.) But the 2,243 counties look much more complicated through the prism of the ACP typology.
Among the 306 rural counties in the African American South, the median county is only 56% white, non-Hispanic. It’s also 36% African American, almost three times the national average. In the 153 Hispanic Center counties in rural America, the median locale is only 40% white, non-Hispanic. Meanwhile, it is 53% Hispanic, almost three times the national figure of 18%. And in the rural Native American Lands communities, 43 counties, the median county is only 29% white, non-Hispanic, while it is 59% Native American.
There are outliers in the other direction, of course. In the Aging Farmlands (161 counties), Working Class Country (321 counties), and Rural Middle America (551 counties), the median counties are more than 90% white, non-Hispanic.
The broader point in the data: The overall numbers for race and ethnicity in rural America mask key subtleties. Such distinctions mean that policymakers may need a more nuanced lens as they address the challenges in these communities. Outreach and approaches that work in Gove County, Kansas (95% white, non-Hispanic) may not work as well 87 miles away in Finney County (40% white, non-Hispanic). We visited both counties for this report, and you can read profiles of each in later chapters.
That diversity also means more attention needs to be paid to the racial and ethnic differences that can define rural communities. There is a tendency to think of “rural” as meaning small and homogenous. But in some communities, such as those in the African American South, there are historic divides that serve as deeply rooted challenges that need to be addressed and overcome. We saw that dynamic on display St. Francis County, Arkansas, where the community is digging in to address the issue.
Age
Another dominant media narrative regarding rural America: It is home to a rapidly graying populace. On the whole, the 2,243 counties we examined are older than the nation at large. Using the median and the average to measure the counties, 20% of the population is 65 years or older. That compares to an overall national average of 16%, a notable four-point difference. However, this does not capture the nuance at the community level.
In several of the communities we visited, we heard that finding licensed child care was a real challenge. The strains were particularly evident in Finney County, Kansas, the Hispanic Center we visited, where local leaders are working with existing child-care providers to become licensed child-care centers.
In the Hispanic Centers and LDS Enclaves, the median figures for the 65-or-older population (15% and 16%, respectively) are close to the national average. At the other end of the spectrum are Graying America and the Aging Farmlands, where the 65-or-older population of the median county is 24%. That’s a nine-point difference in the 65-or-older population in our rural types.
The data also show that, proportionally, large populations of young people are living in parts of rural America. The median counties for seven of the nine rural types sit at or above the national average for the population under age 18, 22%. And the overall rural median and average for that age group are exactly 22%. That suggests that a key challenge in these communities is holding onto people as they pass from adolescence to adulthood, when they graduate high school and plan their next life steps. Economic opportunity, or lack of it, plays a role in those numbers. We saw and heard this while visiting rural communities.
Importantly, the Native American Lands stand out for having an extremely young population. Only 12% are 65 or older and nearly a third are under 18. But those figures are deceptive. The reason for so few older people in those communities is a very high mortality rate. The life expectancy in the median Native American Lands county is lower than the medians for the other communities we examined.
Taken together, however, these age numbers underscore the larger point: Rural America is about more than navigating retirement plans and collecting Social Security checks. In some rural communities, child-care can be as much or more of a challenge than elder care. In others, concerns center on adult battles with depression and addiction. For most of these places, a major challenge is creating jobs that will enable them hold on to people in their prime working years.
Many Sizes and Densities of Rural
The many rural communities in the 2,243 counties explored here have diverse environments and the differences become clear when examining the populations. The median county in our rural county group has a population of 17,743, but the numbers across our collection of rural counties vary sharply, creating very different kinds of places.
The data on population also reveal that rural America may not be emptying out as quickly as some suggest. On the whole, 64% of the 2,243 counties in our rural group have lost population since 2010, but in terms of raw numbers, rural America has grown by about 1.4 million in that time. To be clear, that’s very slow growth. It’s a fraction of a percentage point compared with the roughly 63 million people who live in these counties, and it lags far behind the national growth rate of 6%.
More to the point, the story of population growth or decline varies greatly by community type.
Some types, such as the African American South, have seen widespread population losses, with 79% of the group’s counties losing population. But in other places, such as Graying America, fewer than 50% of the counties have declined. And in Graying America counties collectively, the overall population number has climbed by about 174,000 since 2010.
The population losses in rural America may be felt most strongly in the Aging Farmlands. Roughly 76% of those counties have lost population since 2010 and, perhaps more important, many started from a low baseline. That means further losses can have large impacts on local businesses and schools as well as local culture and mindset. Overall, the Aging Farmlands have declined by a mere 18,000 since 2010, but that number is enough to equal an almost three percentage point drop for the type.
The news media and popular culture often focus on the urban/rural divide, and the population density of urban areas does make those places different from their rural counterparts. But the data here make clear that racial and ethnic diversity is a large part of the story in rural America. In that way, the communities of rural America are not so different from the urban areas they flow around.
The depopulation trend impacting some rural counties is not radically different from the exodus to the suburbs that remade so many metro areas in decades past. And the racial tensions in some rural communities, such as those in the African American South, are not dissimilar to those in the nation’s urban centers.
In a broader sense, all the numbers here emphasize the need for a new understanding of rural America as a multidimensional and multicultural landscape that defies simple answers and definitions. For anyone looking to effectively serve these communities, it is vital to understand the racial and ethnic complexities within them.
Economics
For many rural communities, economic development sits at the heart of local concerns and planning. Analyses that show urban America driving economic expansion are not lost on rural chambers of commerce and neither are the forecasts that show the tech sector as an engine of future growth. But as the U.S. economy is being remade, the communities of rural America bring a diversity of backgrounds and strengths to the table. Their economic paths in the coming years will almost certainly be varied as well.
Income and Inequality
Probably no single indicator encapsulates the many different rural Americas more than median household income. The range in our 2,243 counties is massive. In some places, such as the LDS Enclaves and Rural Middle America, the median income ($54,900 and $53,200, respectively) are very close to the national median ($57,600) and above the median for our rural sample ($46,600). But other communities, such as the African American South ($37,900) and Native American Lands ($41,900), lag far behind.
It’s truly a complicated picture. That’s a range of $17,000 in household income in these different kinds of rural communities. Some of those differences may be due to regional cost of living, but those disparities don’t account for the entire range. In some communities, the differences in household income are more about steeper economic challenges and deeper historical deficits.
In some communities with large populations of color, there can be other economic disparities existing within a single place. Racial divisions are often seen as an ingrained part of urban America. Stories of white flight, redlining, and socioeconomic segregation are written into the histories of most major American cities. But those same divides can appear in rural locales. For instance, in St. Francis County, Arkansas, an African American South community we visited, the median household income for African Americans is only about $28,300, while the figure for whites is more than $10,000 higher at $39,500. And stories of white flight are deeply tied to it as well. In Finney County, Kansas, a Hispanic Center we visited, the median household income for Hispanics is about $42,300, while for white, non-Hispanic households it’s $61,600. And in that county, efforts are underway to foster dialogue across groups. For example, the Garden City Cultural Relations Board consists of seven members across racial, social, ethnic, religious, and economic backgrounds, which seek to promote cultural diversity.
Income inequality has become a major topic of conversation in policy circles. While the rural communities we looked at tend to have lower scores on inequality overall, the numbers for some communities are still high. Income inequality is defined as the ratio of household income at the 80th percentile to income at the 20th percentile. Overall, the 2,243 counties we analyzed had an income inequality score of 4.4, below the national figure of 4.9. But the counties in the African American South and Native American Lands were exceptions.
Both community types scored above 5.0 on inequality, with the Native American Lands scoring the highest at 5.3. In both cases, the inequality, again, primarily stems from income differences between racial/ethnic groups. The inequality number is lower in the other big minority community type we studied, Hispanic Centers. In those communities, the inequality number, 4.5, was just above the overall rural number and below the national figure. That may be because those communities tend to hold more and better job opportunities. Certainly, we saw this in Finney County, Kansas.
Yet the larger trend in the data is that income inequality is a less prominent concern in rural America than it is in the nation as a whole. That’s the good news. The more complicated point is that such greater equality may be due to a lack of high-income households in rural America.
Occupations and Employment Opportunities
Behind some of the income differences in the 2,243 counties we looked at are differences in the industries that dominate. Rural America may be seen as the land of rolling fields and tractors, but in reality, agriculture is not a big driver of employment in most rural communities. In fact, the biggest employer in all the communities we examined was “educational service, health care, and social assistance.” More than 20% of the people in every community worked in this field, though the largest percentage of those working in the Aging Farmlands, 21%, are tied to agriculture.
In many rural communities, the schools and/or the hospital, if there is one, are the largest employers and town anchors. These institutions can’t easily close when the economy takes a downturn or pull up stakes for better opportunities elsewhere. It’s one reason these assets are crucial to their communities.
Beyond that category of work, manufacturing is still a leading employer in many of the 2,243 counties we studied. The sector accounts for 16% of the jobs in Rural Middle America and the Evangelical Hubs, 15% in the African American South and 14% in Working Class Country. Retail is also a big industry in a number of the county types. And agriculture plays a major role in the Aging Farmlands (21%), Hispanic Centers (16%), Native American Lands (10%), and LDS Enclaves (10%). In every other type, agriculture accounts for 6% or less of employment.
The Native American Lands stand out for having a higher number of jobs in “public administration” (11%), but that is due in part to the federal employees living in those communities.
The rising service sector is also less of a story in rural America. That’s because retail trade tends to have a smaller role in these communities. Smaller populations have meant fewer stores for decades and online shopping has added to that story. Online retail has also had a special impact in these communities, giving rural consumers choices they have not had available to them historically when there were one or two small stores downtown or a Walmart in the town nearby. In many of these communities “shopping local” has long offered limited options.
Education, Unemployment, and Poverty
Any serious discussion of the economy cannot exclude the important role educational attainment plays in a community’s hopes for growth and a better future. Data show the gap growing in the earning potential between those with an education beyond high school and those without one. In 2015, an analysis of Census data found that college grads earned 56% more than those whose highest level of education was a high school diploma.
A 2017 analysis form the Bureau of Labor Statistics found that the difference in weekly earnings between those with a high school diploma and those with just some college experience was $62 — that’s more than $3,200 a year, and the numbers climbed sharply as the education levels increased.
Higher levels of education, however, serve more than the workers; they serve the community as well. A better-educated populace is more likely to draw new employers and more good-paying jobs, a goal for many rural communities. Businesses increasingly want well-trained and skilled workforces that can adapt to a fast-changing economy.
And the data show educational attainment is one important area where rural America stands apart from the rest of the country. Overall, 54% of those between the ages of 25 and 44 have some time in college under their belt. That is 11 points lower than the 65% national figure for that age group. Again, however, the figures vary greatly by community type.
The numbers are particularly low in the rural communities with large populations of color. In the African American South, Hispanic Centers, and Native American Lands, the figure is under 50%. But the numbers are above 60% in Rural Middle America, the LDS Enclaves, and the Aging Farmlands, where the “some college” number sits at 68%.
Those numbers belie some of the common misconceptions about rural communities as places where education is not a top concern. The most rural of our rural county types have higher rates of educational attainment than the nation as a whole. But they also show that concerns about lower education rates among people of color should not be contained to just urban places. Again, reductionist views of rural America miss the larger point: that single solutions to challenging social problems are likely to be ineffective in rural America. While higher educational attainment is a goal for all communities, there are varying levels of need in rural communities.
Using the broadest measure of the 2,243 counties we examined, unemployment in rural America roughly matches the national average. The national unemployment rate was 4.4% in 2017, with the rural America clocking in at 4.5%. But the similarity in numbers masks a lot of nuance. In some communities, the rate was below the national figure; in others, it was above. In both cases, the percentages differed substantially among the various county types.
In the Aging Farmlands, LDS Enclaves, and Rural Middle America, the unemployment rates were 4% or lower. But in the African American South and Native American Lands, the figure stood at 6%. More interesting, the figures here don’t seem to have a common driver. For instance, the Aging Farmlands and Rural Middle America are driven by different industries (agriculture and manufacturing) and are at opposite ends of the population density scale. What’s behind the differences?
Education stands out as a factor. The three community types with the highest rates of educational attainment also have the lowest unemployment rates. The three community types with the highest unemployment rates are also below the rural America average for some college. Those data suggest that one of the best ways to help the many different economies of rural America may be to invest in improving education. An effort to make at least some time at a community college part of community expectations could be a boon to local chambers of commerce — and building relationships with those schools could pay dividends.
The one exception seems to be Hispanic Centers, which have the lowest educational attainment rates but also have an unemployment rate that matches the national average and rural America median. The vibrancy of these economies is a key reason. Many tend to be small urban hubs in larger rural areas, places that are commercial centers often with a base around agriculture processing.
When it comes to children living in poverty, the connections between educational attainment and economic opportunity are clearer.
A third of children in the African American South and Native American Lands live in poverty. The same is true for a quarter of the children in Hispanic Centers. The rates are far lower in the Aging Farmlands, Rural Middle America, and LDS Enclaves.
Financial Well-Being
Financial well-being in rural America on the whole could be improved, but there are clear fissures among different kinds of communities, according to Gallup’s recent well-being research. Note that Gallup’s breakdown encompasses all 3,100-plus counties across America. Here we zero in on the nine rural types.
At least 40% of residents in rural-oriented communities have worried about money in the past week. The most rural community types — Native American Lands and Aging Farmlands — have the highest rates at 45% each. The African American South, Working Class Country, and LDS Enclaves are close behind at 44%; Evangelical Hubs report 42%; while Hispanic Centers, Rural Middle America, and Graying America stand at 40%.
What makes this worry more tangible: More than 15% of people in predominantly rural community types say they do not have enough money to buy food. The variance runs from roughly 30% in predominantly African American, Hispanic, and Native American communities to under 20% in more moderate-income, predominantly white ones.
To be clear, none of these numbers are completely explanatory or determinative when it comes to the economic opportunities and challenges in rural America. For instance, unemployment rates may be low and education rates high in the Aging Farmlands, but there are unique challenges in those places as we heard when we visited Gove County, Kansas. High land prices combined with a trend toward massive acreage have made it tougher for young people to get started and stay in their hometowns. And while there are deep challenges in some Native American Lands, there are also innovative approaches to economic development in some communities, as illustrated by REDCO’s work in Todd County, South Dakota, home of the Rosebud Sioux Tribe. (See our community profiles on Gove and Todd counties.) Meanwhile, many of the Hispanic Centers, are seeing population growth with young non-native families and schools that need to focus on students coming from homes where English may not be spoken.
Any plan to spark economic development and change in rural America has to take those differences into account.
Infrastructure: Real World and Virtual
For an economy to thrive, people and ideas and products have to be able to move in the physical world and online. That imperative can be a challenge in rural communities. In those locales, acreage is often vast and the connections between cities, towns, and homes can be tenuous. Fewer people usually means fewer roads, and lower population densities tend to lead to less interest from telecommunications companies to hardwire homes. Those trends are clear in the data, but so are marked differences at the community-type level.
Looking at miles of road, the median rural counties in the LDS Enclaves and Rural Middle America types are at the high end of our sample at 1,273 miles and 1,152 miles respectively. At the other end of the spectrum, the median counties for the African American South and Working Class Country are not even at 900 miles of road.
More interesting in the road data, however, is the lack of a correlation between people and mileage. For instance, the community type with the highest median population, the Evangelical Hubs with more than 23,000 people, has some of the lowest numbers for miles of road at 990. Meanwhile, Rural Middle America, with a median population of more than 22,000, has a median road miles number of 1,152 — that’s 16% higher.
Some of this divide is regional and might be explained by state-level decisions on resources. The communities of the African American South also have relatively high population numbers, a median of more than 20,000, and very low numbers for miles of road. One key element they share with the Evangelical Hubs: They are largely based in the Southeast. The greater miles of road in the Aging Farmlands is also noteworthy, especially considering the low populations of those places. Perhaps it is a sign of communities that understand the importance of transportation in places that live and die by the ability to move commodities from farm to market.
When it comes to digital infrastructure, the picture is nuanced. In terms of broadband Internet access, the rural counties in our analysis do quite well on mobile connections. In all rural types, the median county has at least 98% of the population with a 5 megabytes-per-second download speed and 1 megabyte-per-second upload speed, the Federal Communications Commission’s definition of mobile broadband.
Those high mobile broadband penetration numbers are not a surprise when you visit rural communities. Even in remote locales, the mobile Internet is often the dominant connection to the outside world, for everything from road closures to crop prices.
But when the conversation shifts to a fixed connection, with much faster speeds of at least 25 Mbps per second on downloads and 3 Mbps per second for uploads, the numbers look very different. There are sharp differences across the 2,243 counties. The broadband deployment numbers in Rural Middle America, 85% of the population, are not far off from the overall U.S. figure, 94%. But the figures for other community types are much lower. In the Native American Lands, the figure is 58%. In the African American South, the figure is 68%.
But the digital divide in rural America is not just about racial and ethnic differences. The median broadband figure for the Hispanic Centers, 80%, is much higher than largely white Evangelical Hubs, which sit at 69%. That may be something of a surprise considering that the Evangelical Hubs are among the more densely populated communities in our rural sample.
In general, however, our rural counties lagged the national figures on fixed broadband deployment — some by large percentages. And in a world where everything from entertainment to work can be contingent upon a strong Internet connection, that rural lag can add to the challenges for communities that are trying to attract people and employers.
Online News and Social Infrastructure
Even with those differences and challenges in rural America, however, one tech outlet holds immense power across all the different kinds of communities we examined: Facebook. In every one of the nine rural community types, more than 40% of the people report that they visit Facebook at least once a month, according to data from the consumer research firm Simmons-MRI.
Those numbers stand out across the board in these communities when compared to other social media and news sites — from Craigslist and Twitter to FoxNews.com and CNN.com. And the comparisons aren’t really close. FoxNews.com and Twitter tend to be in the very low double-digits. Craigslist is a little higher, but doesn’t break 20% anywhere.
Facebook has become something of a one-stop everything shop in rural America — a place to keep up with friends and headlines in communities where the local newspaper has taken a hit. In smaller communities, Facebook also serves as the local yellow pages, with local businesses using the platform to host their sites. In Todd County, our Native American Lands county, we heard how people’s Facebook pages are sometimes the most reliable ways to reach them. It is the online address that never changes. Facebook may not be a government entity, but in rural America is almost serves as a public utility.
In a larger sense, these financial, employment, and infrastructure data show that there is no single, cohesive rural American economy. The 2,243 counties sit in different situations, are driven by different industries, and face different challenges.
Housing Strides and Strains
If a person’s home is often their largest investment, rural America sits in a different place than much of the nation. For the most part, these communities did not experience the housing boom that the rest of the country did in the first half of the last decade.
The median housing value in all the types we looked at was under $200,000 — and in some places, the value was far under that amount.
For instance, in Hispanic Centers, Native American Lands, Evangelical Hubs and the African American South, the median home value was less than $100,000. That gives some indication of the wealth in these communities and of a big challenge they face. Lower values mean less for the community to collect in property taxes and less individual home value for residents to borrow against.
There are, however, some upsides to those lower values, a big one being higher home ownership rates. Less valuable homes also mean more affordable homes overall. In our 2,243 rural counties, roughly 75% own their homes. That compares to a national rate of about 64%.
There are some notable differences across rural America. The Native American Lands have the lowest home ownership rate at 63%, while Aging Farmlands, Working Class Country and the LDS Enclaves are all above the 75% figure. That’s a key anchor for citizens. It’s harder to leave a community when one is a homeowner. And selling a home in a place with a declining population can be difficult.
When it comes to severe housing problems, including overcrowding, high costs, and the lack of kitchen or plumbing facilities, the disparity between communities of color and mostly white communities comes into view. Consider the 9% rate in Aging Farmlands, compared with the 21% rate in Native American Lands — and both community types are 100% rural. The U.S. overall average for housing problems stands at 18%. This suggests opportunities to build affordable housing in Native American Lands, where the population is growing. In the Aging Farmlands, where populations tend to be declining, housing rehabilitation could take priority.
Homes in rural America tend to be at least 40 years old. Many older homes are found in whiter communities with older residents. For example, the medians in Aging Farmlands and Rural Middle America top the 50-year mark; Graying America bucks this trend.
Median Age of Home Structures by Community Type
Aging Farmlands
1959
Rural Middle America
1965
Hispanic Centers
1975
Graying America
1978
Native American Lands
1978
Evangelical Hubs
1979
Working Class Country
1979
LDS Enclaves
1979.5
African American South
1980
New housing units are most robust in two younger and older predominately white communities: LDS Enclaves, where more than a quarter of the population are under 18, and Graying America, where about a quarter of the population are 62 or over. The most rural places, Aging Farmlands and Native American Lands, have seen the fewest new units.
Daily Life and Health Care
A widespread belief swirls that rural Americans grow and raise a lot of their food, and therefore have better food access. This is not the case. The Food Environment Index, which takes into account distance to the nearest food market as well as income, ranges widely in the ACP rural universe. It’s highest in Rural Middle America at 8.2 and lowest in Native American Lands at 4.9. In the African American South, where the median household income is also lower and resources seem less abundant, it’s 6.4. Meanwhile, in the Aging Farmlands, dominated by agriculture but where exporting food to other markets is the focus, the index is 7.6. This matches the median for all nine county types in rural America. In the U.S. overall, the median is 7.7.
Health-Care Gaps
Lack of health-care access is a significant pain point across rural America. For example, uninsured rates reveal a wide disparity, with white communities faring much better than communities of color. The medians by community type are below.
Hospital closures, a prevailing concern in rural America today, also vary depending on community type. Evangelical Hubs have suffered the most with 28 closures, and the African American South next with 18.
The rural hospital issue has garnered a lot of attention in recent years, and the Center for Optimizing Rural Health has examined the situation in great detail, for those interested in learning more or addressing this problem.
When a hospital closes in a rural community, the impacts stretch beyond health. An analysis from the Kansas City Federal Reserve Bank looked at communities with hospital closures between 2011 and 2016 and found subsequent declines in economic growth and net employment in those communities. Communities without closures saw their economies and net employment grow in that time.
Considering the employment data we cite in this report, those numbers are not a surprise. In every one of the nine rural community types we visited, “educational services, and health care and social assistance” was the No. 1 industry for overall employment. (It was tied for first in the Aging Farmlands.) Closing down a rural hospital kicks a leg out from under the economy in many rural places. It takes away an institution in places where those kinds of employers can be scarce.
Along the lines of limited care access, the number of primary physicians and dentists per population also varies depending on the kind of rural community in question. For seven of the eight community types, a median of one doctor serves more than 2,000 people. Only Graying America, where about a quarter of the population are age 62 or older, comes in under 2,000 people to one doctor. Compare those figures to the U.S. overall at 1,330 to 1. (Hover over the dots to see the population figures.) More rural telemedicine services could help to narrow this access gap. Meanwhile, Gove County, an Aging Farmland we visited, breaks the mold with five M.D.’s per 2,600 population.
The ratio of dentists to the rural population overall and within individual community types shows a more extreme difference than the ratio of primary care physicians. Half of the community types, including heavily African American and Latino communities, are above 3,000 to 1. Compare the rural figures to the U.S. overall at 1,460 to 1. (Hover over the dots for population details.)
Well-Being and the Future of Rural America
Key indicators show that community well-being is relatively strong in rural America, according to Gallup’s recent research. Again, note that Gallup’s breakdown encompasses all 3,100-plus counties across America. Here we look at the nine most rural types. Take community pride, for one. In all these county types, a clear majority express pride in where they live. Homogeneous LDS Enclaves, Rural Middle America, Evangelical Hubs, and Aging Farmlands climb to percentages in the high 60s and low 70s.
More than 70% of residents in rural county types report feeling safe and secure in their communities. Residents in nonwhite and more diverse communities do not feel as safe as populations in homogeneous, white communities.
There is a great deal of citizen engagement for community betterment happening in rural communities. At least 20% of residents in predominantly rural community types say they have been recognized for improving where they live in the past 12 months; nationally, the rate is the same. Only Aging Farmlands, which are 100% rural, outpace the pack at 28%. Graying America, the African American South, and Native American Lands come in at 22%. Working Class Country stands at 21%. Hispanic Centers, Evangelical Hubs, and LDS Enclaves report 20%.
Those are high scores on issues that people want addressed when they are looking for a community to call home, and these issues impact the many different kinds of rural community we studied in this report. All of which is to say, despite the challenges in some areas, rural America still has a lot to offer in 21st century America. Growing and serving it in a rapidly changing world, however, will require a new and more complex, granular understanding of the many kinds of community that define it.
To learn more about rural America and the county-level data in this report, visit:
The Center for Rural Strategies, the nonprofit that aims to build opportunities for small towns and rural communities by building coalitions and partnerships, and by advancing strategies that strengthen connections between rural and urban places. The center also runs the Daily Yonder, an online news site devoted to rural America.
The County Health Rankings and Roadmaps, the comprehensive annual analysis of health measures and their underlying factors, is a wealth of knowledge and the backbone of the data in this report.
Todd County, South Dakota, 2019. Rosebud Reservation. Photo courtesy of the Robert Wood Johnson Foundation. (c) 2019 Annabel Clark and (c) 2019 Josh Kohanek
More than a millennium before gold was discovered in South Dakota’s Black Hills in 1874, spurring the last great gold rush in the continental U.S., the Lakota people were born in these hills and roaming the surrounding plains. Today, one of seven Lakota tribes, Sicangu Lakota Oyate (“Burnt Thigh Nation”), also known as the Rosebud Sioux Tribe, is confined to the Rosebud Indian Reservation located in Todd County and parts of four other counties in the state. A Native American Lands community in south-central South Dakota bordering Nebraska, Todd County was named after John Blair Smith Todd, a Civil War general and Dakota Territory delegate to the U.S. House of Representatives.
Residents say their roots here go back at least 2,000 years, likely longer, citing research from Sinte Gleska University, the accredited four-year tribal university on the Rosebud Reservation in Mission, South Dakota, as well as NASA’s tracking of star constellations. “We plan on being here for another 2,000. This is where we come from. We can’t separate ourselves from this land. This is our home. The bones of our ancestors are buried here, and we have a sacred duty to watch over and protect it,” says Wizipan Little Elk, CEO for REDCO, Rosebud Economic Development Corporation. Formed in 1999 by the Rosebud Sioux Tribal Government, REDCO defines its purpose: “to generate revenue and create economic opportunity for the Sicangu Lakota Oyate and surrounding communities.”
What becomes clear in conversations is how trust underpins prosperity. Residents say trust has been broken and opportunity lost as a result of many U.S. government policies and practices spanning more than 150 years: severed treaties, killings, racism, forced sterilizations, forced relocations onto reservations and placements in boarding schools, and a lack of promised quality health and social services.
While the social, economic, and health adversities remain extreme in Rosebud — Todd is classified as a persistent poverty county — residents exude pride in their heritage and possess a steely mindset to bring restoration. Several organizations and institutions, including REDCO, Sinte Gleska University, Tokala Inajinyo Suicide Prevention Mentoring Program, Rosebud Sioux Tribe Head Start, and the Boys & Girls Club of Rosebud, are leading efforts to address daily problems, revolutionize Rosebud, and sustain the community’s promise for future generations.
Todd County Within Native American Lands and Rural America
Some bright spots for Todd County’s future: Its population has grown 5% since the 2010 census, countering the trend of rural America. Its youth population stands out at 41%, even among Native American Lands, where the median is 31%. In contrast, in broader rural America just 22% are under 18.
Yet the socioeconomic factors for youth are currently unfavorable. In Todd, 56% of children live in poverty, compared with 33% in Native American Lands and 22% in rural America. Nearly three-quarters (74%) live in single-parent homes. In Native American Lands, the median reaches 50%, while in rural America it’s 32%.
Todd’s median household income sits at $29,046, below the $41,900 median in Native American Lands and well below rural America’s $46,600. (In 2017, the federal poverty line was $25,094 for a family of four.)
Educational attainment is on the lower end of the scale. In Native American Lands, just 72% graduate from high school, and Todd’s rate is 56%. Compare that with the 90% median rate in rural America, according to the 2019 County Health Rankings. In Todd, 49% of 25- to 44-year-olds have some college education compared with 48% in Native American Lands and 54% in rural America overall.
On housing, 30% report severe housing problems in Todd, compared with 21% in Native American Lands and 13% in rural America. Problems include overcrowding, high costs, or lack of kitchen or plumbing facilities.
Todd struggles with many health challenges. Principally, the premature death rate is 22,124, considerably higher than the Native American Lands rate of 15,500. Both soar above the median in rural counties of 8,641, according to the Rankings. This refers to the years of potential life lost before age 75 per 100,000 population (age-adjusted).
Todd County’s teen births are 110 per 1,000 in the female population ages 15-19, much above the 65 median in Native American Lands and the 34 median in rural America.
Unlike many places in rural America, smoking is a persistent health behavior in Todd. The adult smoking rate is 39%. Native American Lands show a rate of 27%, while rural America’s is 18%.
Access to health care is very poor with a primary care provider ratio of 10,155: 1. Native American Lands’ ratio is 2,225:1, similar to rural America’s 2,288:1.
Todd’s food environment index — accounting for income and closeness to healthy food — is 5.1 compared with Native American Lands’ 4.9. Both rank much lower than rural America’s 7.6. It’s noteworthy that 41% of households in Todd County receive SNAP benefits — it’s the seventh-highest percentage in the U.S.
From Peace Treaty to Persistent Poverty: Noting History
The Lakota’s struggle to preserve their homeland has been a defining feature of life here. The 1868 Treaty of Fort Laramie was intended to bring peace between Native Americans and whites by establishing the Great Sioux Reservation, which included South Dakota, parts of northern Nebraska, and eastern Montana. That hope evaporated after Gen. George Custer led a U.S. military expedition into the Black Hills with miners seeking, then finding, gold. The 1870s were marred by war.
According to Little Elk, U.S. encroachment started with a specific strategy. “Part of that strategy was the decimation of the buffalo. The buffalo were really the lifeblood for us. We don’t really see any difference between us and the buffalo….They provided our food, our shelter, our spiritual ceremonial items, our housing for teepees, utensils. Buffalo hides, in addition to horses, were the primary item of trade, the primary currency for us.”
An intricate system of various parts including buffalo had worked together for the Lakota’s endurance. As REDCO colleague Michael LaPointe, an economic development specialist, describes: “We had a pre-reservation economy. We had forms of government, institutions, and social service systems, but … the federal government never recognized those systems as existing and instituted its own policies that were so detrimental and really decimated an entire culture, an entire group of people….
“At the end of day we’re still reeling from those effects from those policies that were instituted at the highest levels of government. So our social and economic indicators … always lag in the bottom 10 [counties in the country].”
The Community’s Quest to Upend the Status Quo
Data as the Building Blocks for Change
Bringing crucial numbers to the fore identifies where the needs lie. While the U.S. Census reports that Native Americans account for 2% of the population, the 2018 Frontline Solutions report “We Need to Change How We Think: Perspectives on Philanthropy’s Underfunding of Native Communities and Causes” found that 0.23% of philanthropic funds are given to organizations led by Native Americans. Philanthropy News Digest noted “that support for Native American organizations and causes fell by nearly 25 percent between 2006 and 2012, even as overall foundation giving increased significantly.”
REDCO is taking initiative to start from scratch with data toward helping people live healthier, more prosperous lives, says LaPointe. REDCO’s Executive Assistant Katrina Fuller has been helping with the data collection for its comprehensive economic development strategy. “It was the most difficult thing I’ve had to do because you know for a fact these numbers are all wrong. That sign in Mission says there’s what, 1,200 people here. There’s not 1,200 people in Mission; there’s a lot more than that,” Fuller says.
The discrepancies are wide and differ by source. As an example, Fuller says, the U.S. Census recorded that 13,800 people live on the reservation, the Indian Health Service reported about 29,000, and the tribe’s enrollment report listed about 34,000.
LaPointe articulates why the chasm matters. “If you’re going to end poverty, who are you going to end it for? How many? That’s a very fundamental base question. If you can’t answer that accurately, then how’s your solution going to work. These are completely moving targets, some of which REDCO’s hit and moved along. From a statistician’s point of view, there’s a lot more to be done.
“My goal is to be able to get to a point where we’re going to build econometric models and see what variables are going to have the biggest impact in turning people’s lives around,” LaPointe affirms.
Reengineering an Economy for an Undefined Future
Rosebud Casino. Photo by Megan Jula.
On the Nebraska-South Dakota border just off U.S. Route 83 stands an economic pillar: Rosebud Casino, owned and operated by the Rosebud Sioux Tribe. But generally businesses on the reservation are owned by non-natives while a majority of native enterprises run in the underground economy, says REDCO’s Development Officer Eileen “Taffy” Lafferty. These include catering, quilt-making, beading, selling wood, and being a shadetree mechanic. “You don’t pay taxes; you don’t have a business license, but you support your family. So if you look around, a lot of our kids don’t have role models of native businesses,” Lafferty says.
In similar respects, many people on the reservation only use cash and do not bank, Lafferty says. She points to the community’s fraught relationship with the only financial institution on the reservation, Wells Fargo, because of its support of the Dakota Access Pipeline. And the bank’s sole location in Mission is inconvenient for many residents who live miles away and cannot access reliable transportation.
REDCO’s Development Officer Eileen Lafferty discusses the giving versus saving mindset of residents and teaching financial literacy.
Also in Mission are two grocery stores within two miles of each other. Family-owned Turtle Creek Crossing Super Foods contains a large sit-down area for meals. Its website entreats shoppers with 10 points, including: keeping dollars in the local economy, creating local jobs, nurturing the local community, helping the environment by buying locally, and investing in local ownership. Down the road, Buche Foods, owned by a fourth-generation grocer, has a pay-at-the-pump location.
Todd County, South Dakota, 2019. Rosebud Reservation. Turtle Creek Crossing Super Foods. Photo courtesy of the Robert Wood Johnson Foundation. (c) 2019 Annabel Clark and (c) 2019 Josh Kohanek
LaPointe notes that Rosebud’s leakage rate — calculated when people leave to buy goods and services elsewhere — is high at 83%. According to the 2017 South Dakota Sales and Use Tax Report, $148 million in household income leaves the Rosebud Reservation every year, and the 2019 U.S. Bureau of Economic Analysis reported that approximately $252 million per year exists here. REDCO wants to recapture what’s leaving and capture what’s here to support more native-owned businesses.
On reservation housing, two issues predominate. The community is short 4,000 housing units, and many homes, contaminated by meth, have been boarded up.
While the community wrestles with these daily challenges, a long-range plan for Rosebud’s future is in its formative stage. As REDCO leaders prepare thick binders and update a running spreadsheet and project schedules with ideas and plans, Little Elk explains the need for detail: “Rosebud Sioux Tribe Constitution says that we have a duty to consider the impact of our decisions on the next seven generations.”
When his team had to figure out what such consideration meant for strategic planning, they decided to create a 175-year plan to explore far-reaching questions: “Where are we going to live? Where are we going to get our energy? What are we going to eat? Where are we going to get our food from? Are we going to have clean water? What does education look like? Where are we going to work? What kind of jobs are we going to have? What’s our relationship with technology going to be? What’s our relationship with AI going to be? Are we going to have a colony on Mars?… You can SWOT [Strengths, Weaknesses, Opportunities, Threats] this stuff out, looking at assets and opportunities,” Little Elk says.
The changing environment is agitating everything — but community leaders aren’t wasting time despairing. Little Elk explains, “We’ve been talking about the need to have a more holistic approach to development, locally and globally… We’re having to deal with climate change. We didn’t have anything to do with it, but we’re the ones that are being severely impacted by it….
“I think we have solutions we can provide to the rest of the globe. When we talk about farming and developing local economies and natural systems … those are going to be the solutions that are essentially going to ensure the continuing of the human race on this planet.”
It is firmly keeping with one of REDCO’s core tenets, sustainability: “Thinking of the 7th Generation and creating a self-sufficient environment. Moving away from dependence to uphold our sovereignty.”
Reasserting Lakota Culture
Quillwork and jewelry at Soldier Woman. Photo by Megan Jula.
Artwork at Soldier Woman. Photo by Megan Jula.
Just off U.S. 83 in Mission, Soldier Woman Art & Gift Gallery draws customers from around the world, carrying intricate artwork, crafts, and jewelry from Native American artists who use quill and beads among other fine materials. Artist and member of the Rosebud Sioux Tribe Linda Szabo owns and operates the gallery, where artists’ workmanship earns rave reviews online.
Linda Szabo, owner of Soldier Woman. Photo by Megan Jula.
It’s one of the many ways residents bring to light the community’s unique culture — across life stages. As Kevin DeCora, professor and chair of the human services department at Sinte Gleska University, puts it: “We have our Lakota culture, and that, in a sense, is what is really healing a lot of people and bringing back good things for these communities.”
The Lakota’s Seven Sacred Rites form the foundation to “live that spiritual way with action,” DeCora says. Two well-known ceremonies are The Sweat Lodge and The Sun Dance. Then, there’s The Making of Relatives, promoting the idea that no one is alone and there are no orphans. “We’re going to pull you into our family,” DeCora explains.
In the ceremony Preparing a Girl for Womanhood, a girl learns about her body, how to take care of herself, and how to be a mother. While away in a teepee for four days, a girl begins to understand how powerful she is. The ceremony usually occurs around a girl’s first period; DeCora says he took his daughter to one this past year. “This wasn’t happening 15 or 20 years ago,” he says, mulling if that’s because people didn’t understand what the ceremony was all about or didn’t know how it was supposed to proceed.
The Vision Quest is for boys in puberty as they take the path to become men. Boys learn how to make an altar and set it on a hill marked by a medicine man. While building their altar, they remain outside for four days and nights without food and water. “They ask the creator for a vision of how they’re going to live their life so it gives them purpose and direction,” DeCora says.
Lakota cultural elements are also woven into educational programs for children and adults. At Head Start, Director Vonda Pourier-Whipple shares how they inculcate youth.“We have our cultural basis. So they’re learning bits of the language. They label everything in our language. They try to impress upon the kids … the colors, the kinship system, certain foods, body parts….” Her team provides cultural trainings for parents by parents who teach skills they’ve mastered, like shawl-making and drum-making. “If we lose our culture and language, then we lose who we are as Sicangu Lakota Nation,” Pourier-Whipple notes.
Witnessing Triumphs and Trials in Education
Sinte Gleska University, founded in 1971 and named for a war chief and statesman, is one of 37 tribal universities in the American Indian Higher Education Consortium. The university’s mission is “to provide the people of the Sicangu Lakota Nation with an experiential-based program within the context of cultural and traditional values. All programs are designed to provide students with professional and academic skills necessary for employment and personal development.”
Sinte Gleska University. Photo by Megan Jula.
Sinte Gleska fulfills this role — and more. “It educates people and gets them out there and ready to go into jobs that are going to help people like human services,” DeCora says. “We have hundreds of graduates over 40 years that are all working with bachelor’s degrees in mental health, criminal justice, chemical dependency. So they’re working in the alcohol treatment programs, in the juvenile detention facilities, in adult correctional facilities, in the courthouses.”
One graduate making an impact is William Long, who after earning his bachelor’s degree, received the Rosebud Sioux Tribal Council’s support to start the Sicangu Youth Program in 2018, focusing on life skills.“He came through here. He understands mental health; he understands genocide, assimilation, intergenerational trauma. Now that he’s in charge, he’s starting to put mental health pieces in there to move people toward the ceremonies,” DeCora says. Long is working on his master’s degree here now.
Moving down the educational pipeline, Pourier-Whipple runs the largest tribal program as director of the Rosebud Sioux Tribe Head Start and Early Head Start. When she first started in 2010, the budget was $2.1 million. With Head Start duration funding, the budget is increasing to $6.4 million. Head Start’s child-faculty ratio is 10:1; Early Head Start’s is 4:1.
In addition to providing education, Pourier-Whipple and her team contend with entrenched social problems. “It’s intergenerational trauma. [Whether it’s] addictions, sexual abuse, it trickles down from generation to generation until you make a stand yourself and say, ‘Hey, I’m not going to live that life. I was raised that way. But I’m not going to raise my kids that way.’… It’s so hard for some people to do that. They’re enmeshed in it. ”
To help parents move onto a straighter path, parent education is available for the 315 families in Head Start and the 88 families in Early Head Start. “The problem that we run into is … the kids will tell Mom, ‘I don’t want to go to school today,’” says Pourier-Whipple. As a result, regular student attendance remains a problem.
Some parents do participate in the education designed for them, then want to become part of the team, she says. Access to attend Sinte Gleska University is a valuable incentive, Pourier-Whipple attests. Head Start pays tuition for a class, and an employee receives a pay increase after earning a degree.
“When I started in ’87…I was supposed to have an [Associate in Arts], but I was one class short,” Pourier-Whipple reveals. “After I got my AA…I got an increase…and then they paid for a class. I’m like, I think I’ll just keep going and ended up getting two bachelor’s degrees and then a master’s degree. The biggest strengths here are our college and our culture.”
Employees handle about 60 kids at a time. Their help takes many forms, including providing transportation around the reservation and even to pediatric dental appointments in Rapid City, South Dakota, more than two and a half hours away.
Currently, Head Start employs 116 people, with 25 additional positions set to open. While the program is growing, Pourier-Whipple always worries about staff outages. “On any given day, you’re going to have seven to eight people calling in, so you’re trying to scramble around. It’s people in this office who have to go in because we only have two classroom rovers.”
All teachers with degrees are paid $20 an hour, comparable to the closest school districts, but Pourier-Whipple has higher aspirations, namely that every classroom position in this program be paid more than the three surrounding school districts. “Hopefully that helps us retain our staff,” she says.
Todd County, South Dakota, 2019. Rosebud Reservation. Children involved with activities at Early Head Start. Photo courtesy of the Robert Wood Johnson Foundation. (c) 2019 Annabel Clark and (c) 2019 Josh Kohanek
Turning Over Well-Being Challenges
Tokala Inajinyo Suicide Prevention Mentoring Program confronts the problem of suicide head on by training youth to be peer mentors. Project Coordinator Jessica Two Eagle, who started here as a counselor in 2014, reveals her motivation for working in this field: “I would say from a young age, losing a lot of classmates from suicide.”
Today, she says social media is one of the bigger stressors for young people and affects the unrealistic expectations they have for themselves. It’s leading to suicidal thoughts at younger ages.
In addition to offering suicide prevention services for youth and adults, the program meets groups in jail and the Juvenile Detention Center, and conducts anger management classes for the public. Opportunities to explore spirituality are available, too. The program regularly hosts events for the Rosebud Sioux Tribe’s 20 communities, and staff spread the word to outlying communities through social media, radio, and fliers. They also provide QPR (question, persuade, refer) training to help people recognize the warning signs of suicide and intervene.
For his part, DeCora says he’s certified 216 high school students in QPR. He’s also a master trainer for Applied Suicide Intervention Skills Training (ASIST), which he applies all over the area.
Finding Purpose Among Youth
Entrance to the Boys & Girls Club of Rosebud. Photo by Megan Jula.
Another positive force for youth is the Boys & Girls Club of Rosebud, which includes centers in Mission, Rosebud, and Parmelee, South Dakota. The staff comprises seven full-timers and 19 part-timers among the three locations. Executive Director Glen Marshall, who grew up in the suburbs of Minneapolis, Minnesota, finds purpose in helping children here develop. “I love that I get to do this, working with youth, providing something that would not be there otherwise, like our dinner program, or lacrosse, or baseball, or whatever,” he says.
About 485 kids are enrolled in the program, and about 135 kids attend the club daily, Marshall says. The elementary school program encompasses grades K-5 while the teen program includes grades 6-12. Two points of pride: turning a ’60s bowling alley and restaurant into an active teen center and starting a new academic tracking system.
The club uses its Facebook page to share updates of activities and events. For kids from low-income families whose phones may have been shut off or their phone numbers changed, Facebook is a steady communication channel because people can log in to their profile using someone else’s phone. Staff often use Facebook Messenger to communicate with parents because it can be the best way to get ahold of them, Marshall says.
What keeps him up at night are “kids with really bad home lives, with a lack of support and safety they need.” At the same time, Marshall sees a lot of hope: “We’ve got some youth coming up that are really motivated with an understanding of their culture…there’s a lot of people making efforts in that area.”
From Local to Global: Recognizing Universal Connections
As residents describe how culture and spiritual practices connect them to one another, REDCO’s Wizipan Little Elk stresses what binds the Lakota to all humanity. “We want what everyone wants: to have a say over our land, to be able to worship God, and to raise families in a safe and healthy environment. I think sometimes people like to get all mystical about everything… but we are the same as everybody else in those respects. We have our own language, and we have our own stories; we have our own customs and cultural practices and beliefs. That’s just what makes us unique, like any other group of people in the world,” he says.
Todd County, South Dakota, 2019. Rosebud Reservation. Photo courtesy of the Robert Wood Johnson Foundation. (c) 2019 Annabel Clark and (c) 2019 Josh Kohanek
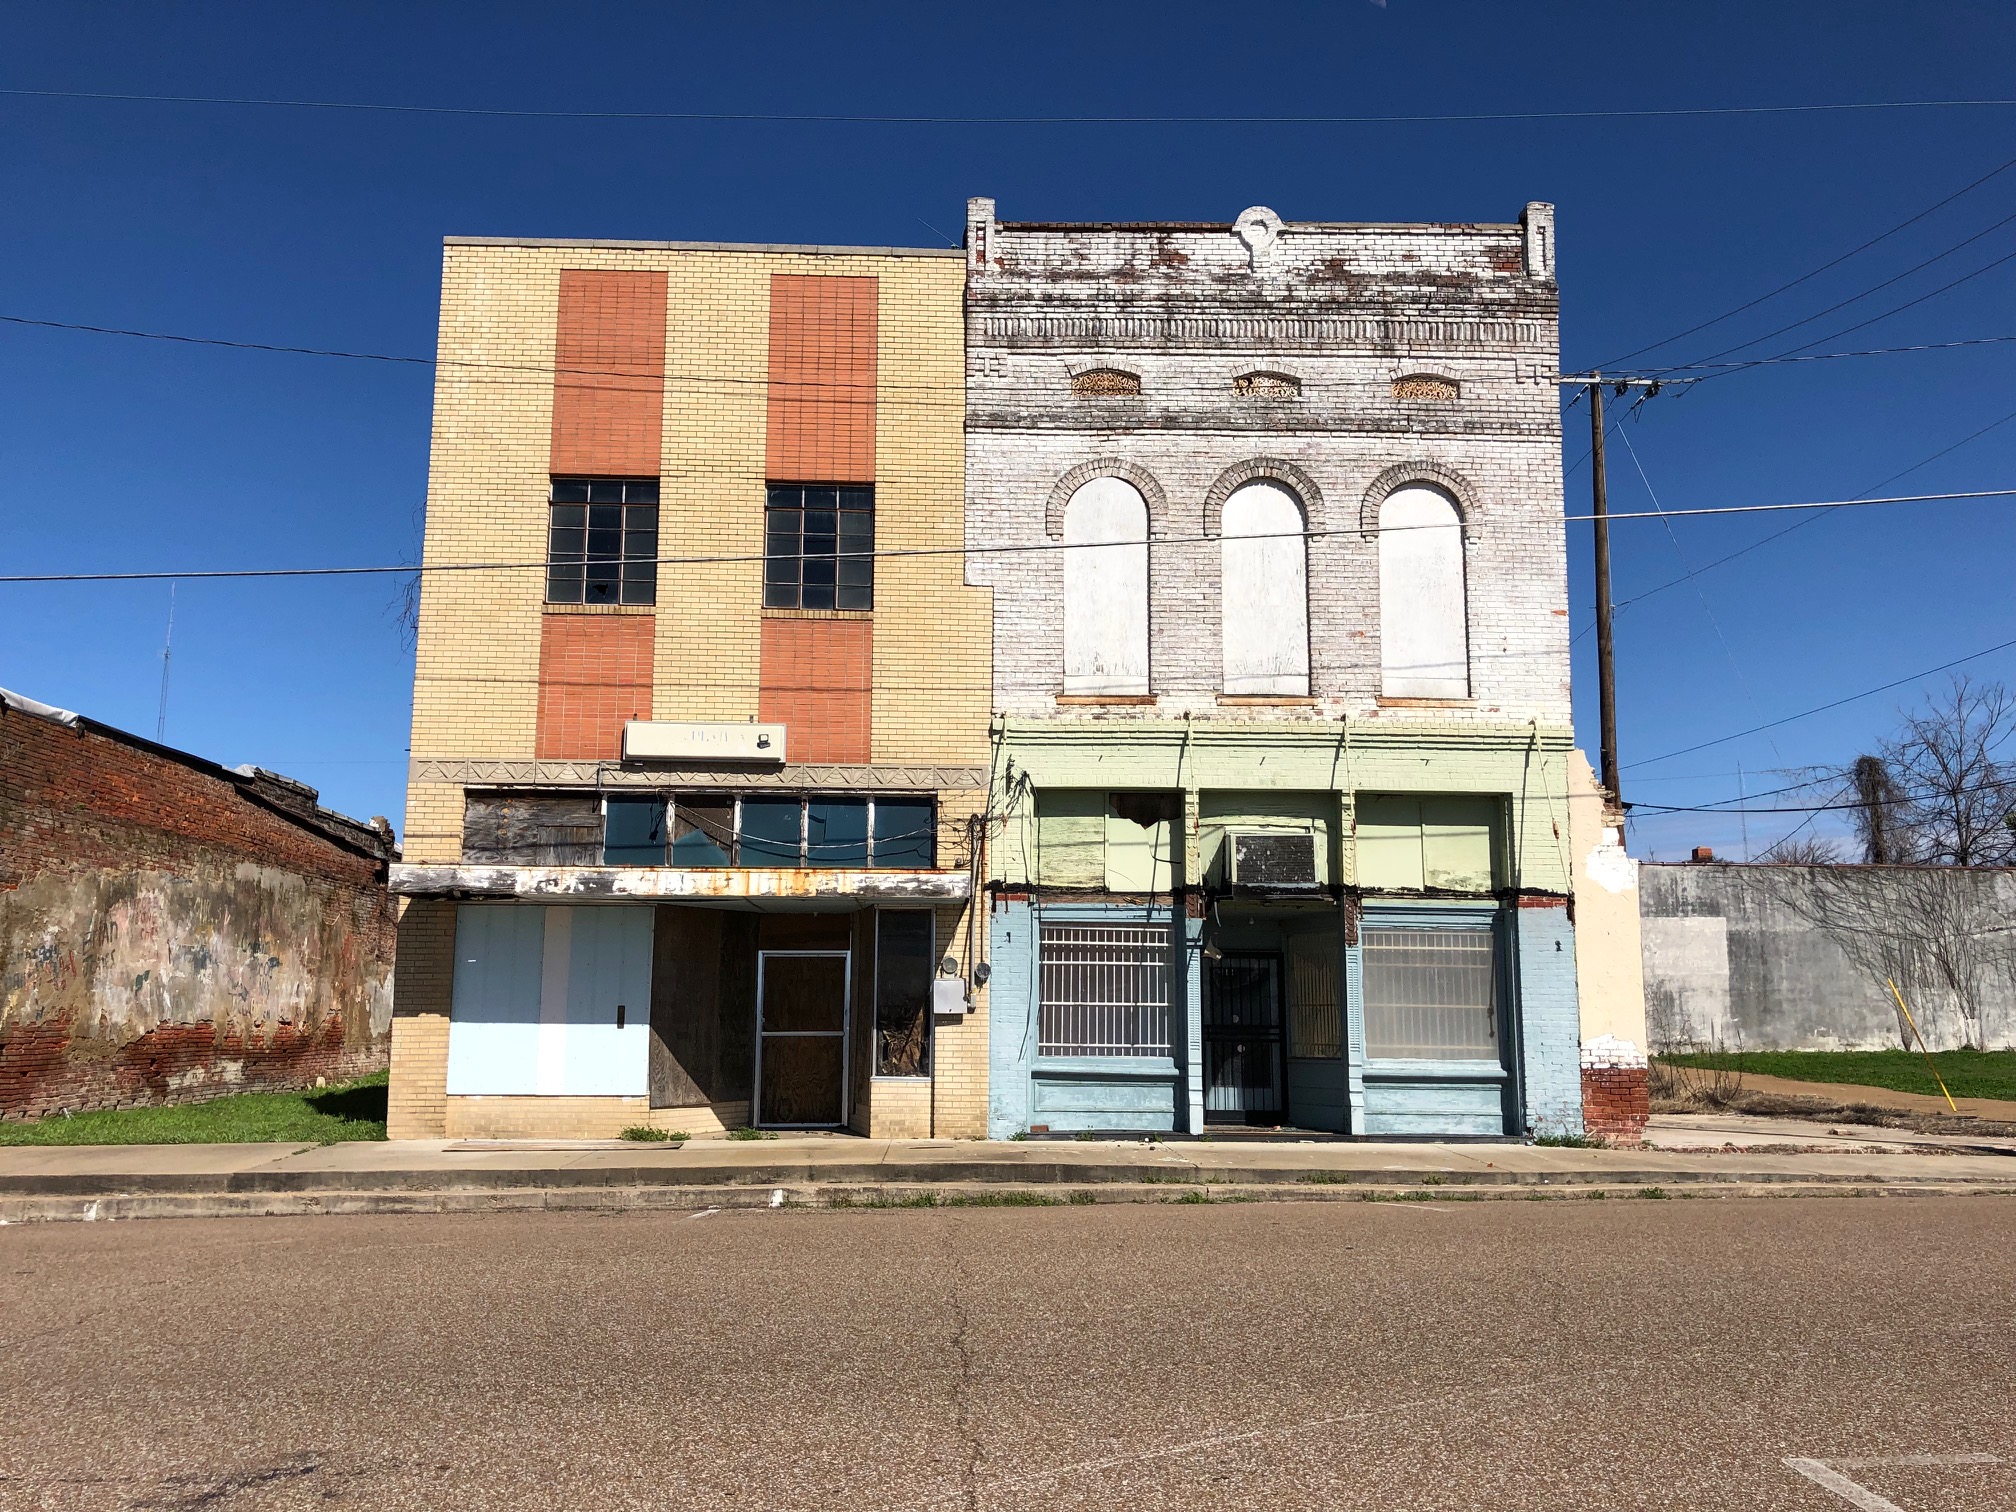


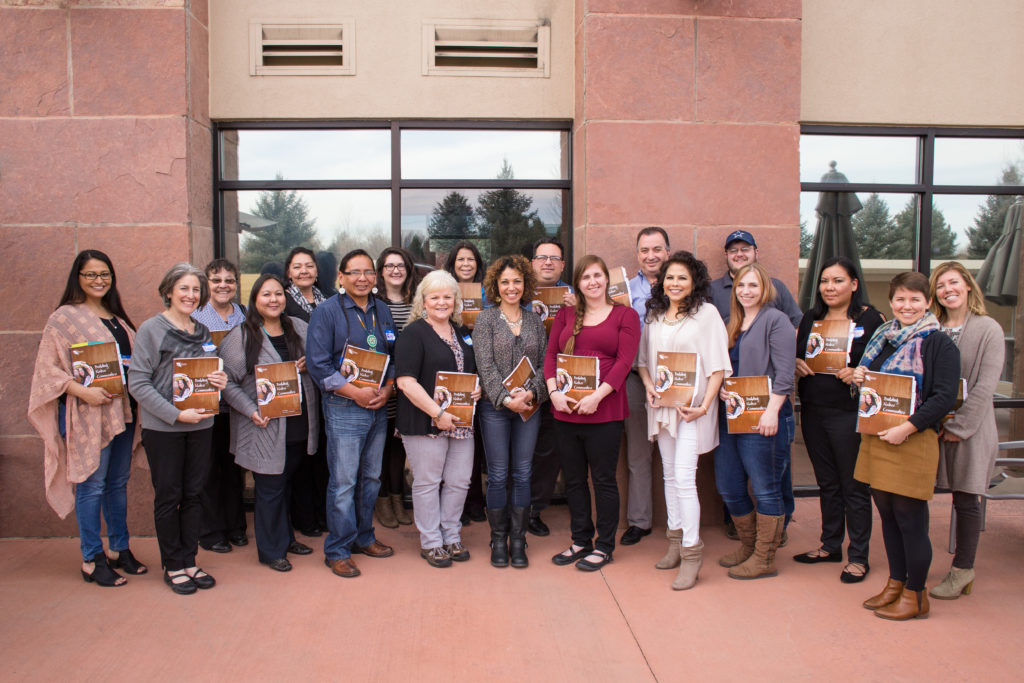
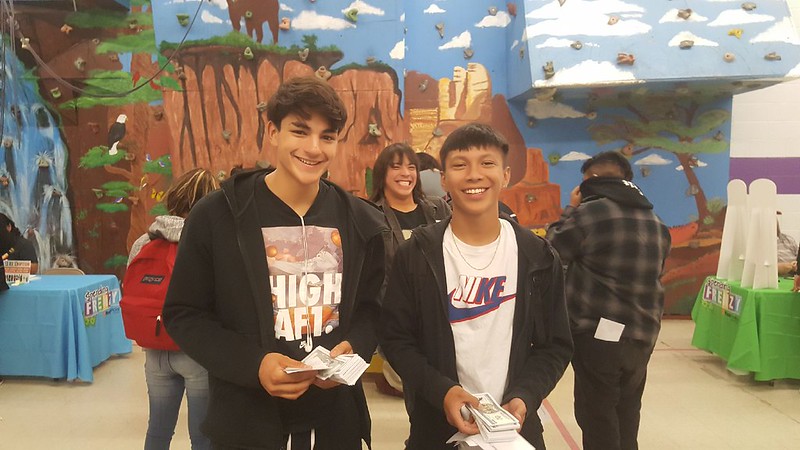
 Krystal Langholz is Chief Operating Officer of First Nations Oweesta.