
How Covid-19 and Deaths of Despair Combine to Affect Communities
The Covid-19 pandemic has torn through the United States in the last 12 months, leaving more than half a million dead and the nation’s economy in tatters, but the virus didn’t arrive on a blank slate. Long before Covid, the Deaths of Despair epidemic was already taking a massive toll in communities of different kinds across the country.
Over the past year, the intersection of those two challenges has created a complicated mix of impacts across county types in the American Communities Project. Some places hit hard by Deaths of Despair seem better equipped to handle the challenges of Covid. Other places that have not seen so many Deaths of Despair have seen higher death rates from the virus.
But in a larger sense, the mortality data for the two national epidemics show how local economic and cultural factors play large roles in communities’ overall health.
This report on Deaths of Despair and Covid-19 is the latest in a series of analyses from the American Communities Project focused on Deaths of Despair, funded by the Arthur Blank Family Foundation. Last summer, the ACP looked at Deaths of Despair across our 15 community types. In the fall, Ray Suarez traveled to Montana to explore the issue on the ground. Also working with the ACP is the Center on Rural Innovation, which gathers and analyzes these data points and builds visualizations.
A year in, the Covid-19 pandemic is ongoing and still relatively new, and gathering data on the virus is not easy. Numbers usually lag real time. That’s also true for the data on Deaths of Despair, which come from national analyses of death certificate data to determine causes of death. But comparing what we know about the geographic footprints of both diseases to the ACP 15 county types, four major points emerge in the data.
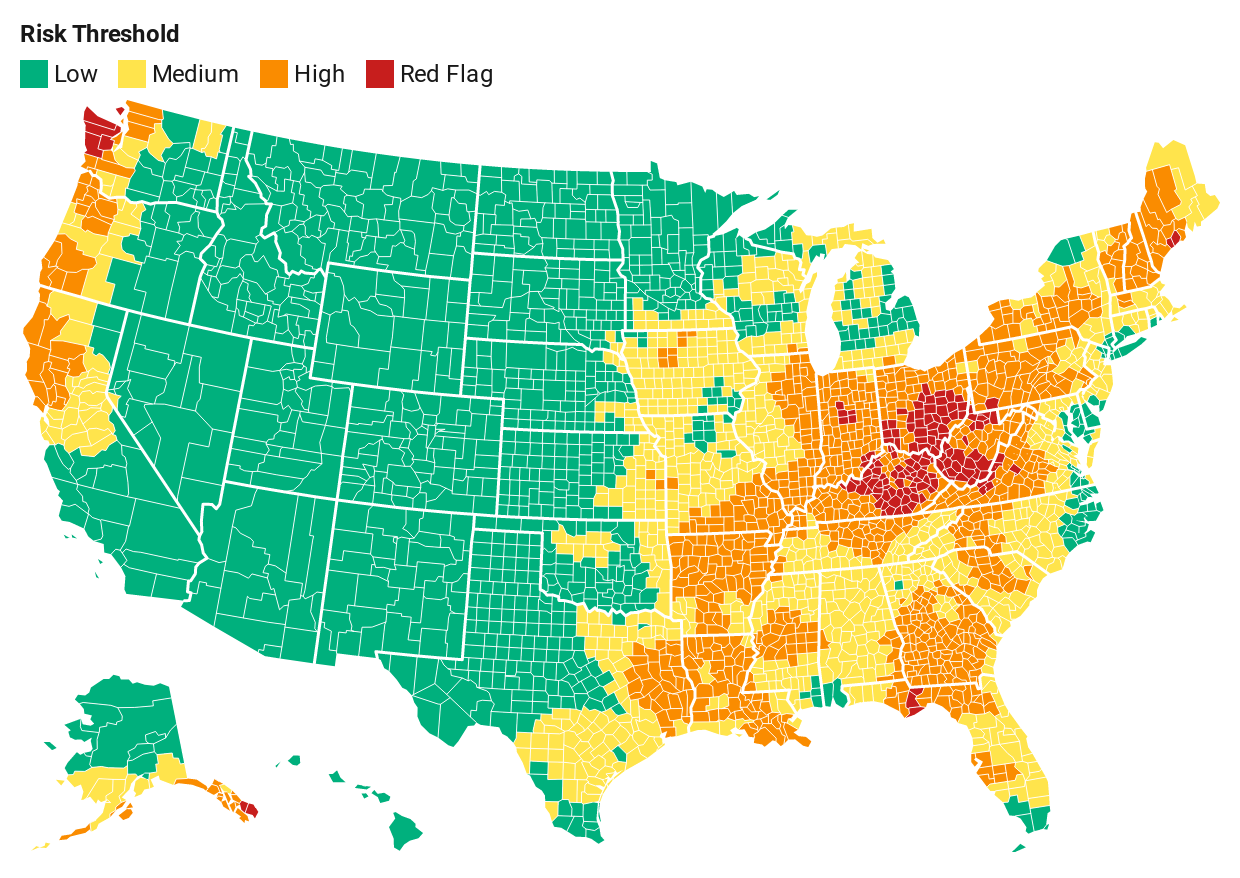
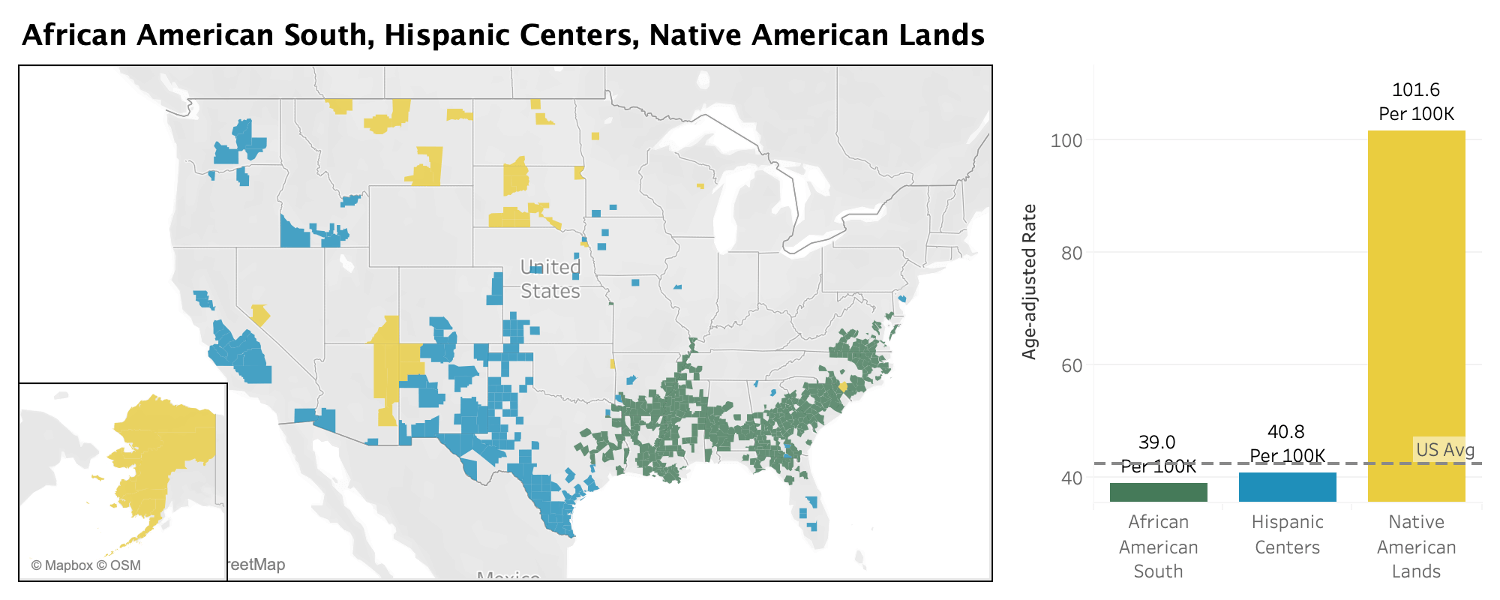
- There is a collection of communities with low Deaths of Despair rates, but high Covid-19 death rates. And those communities are among the more rural places in the ACP: Aging Farmlands, Hispanic Centers, and the African American South.
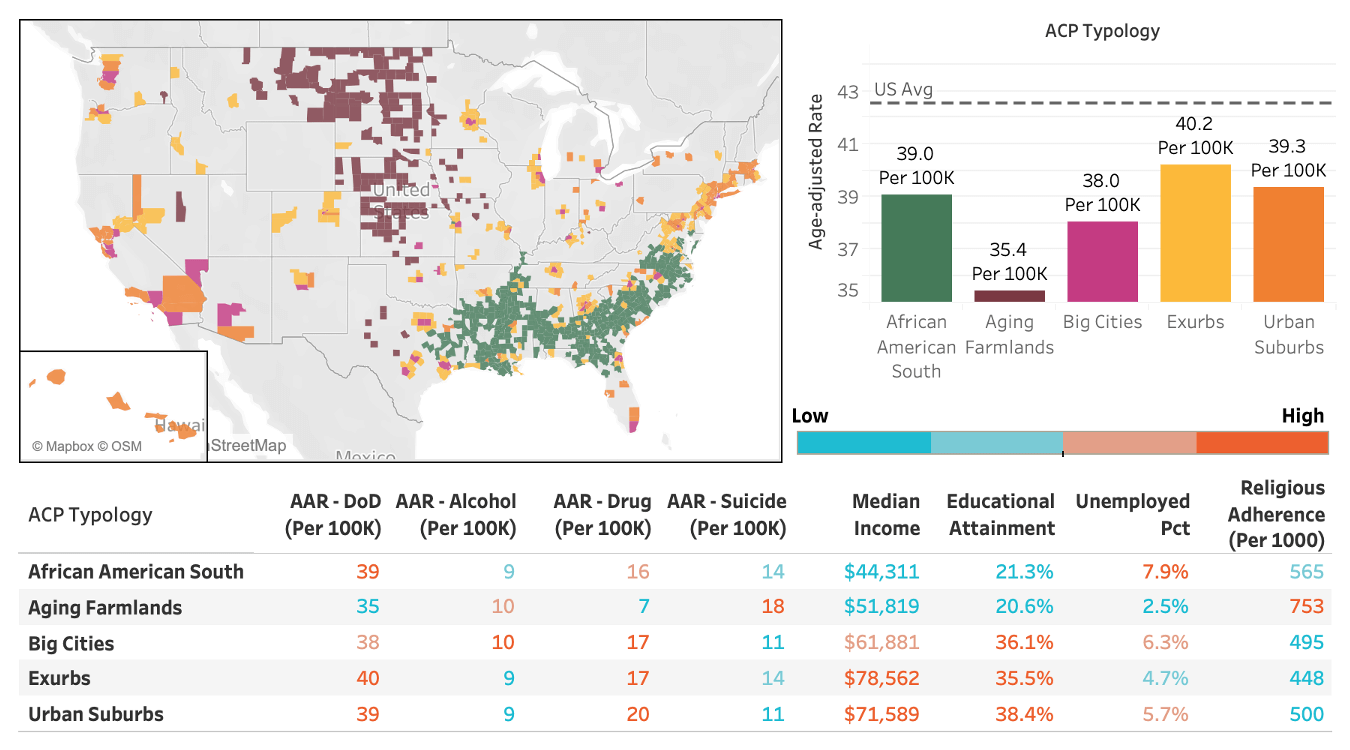
- Some types of communities have lower death rates for both epidemics. Those types, the Exurbs and Urban Suburbs, have built in economic advantages that seem to insulate them from both challenges.
- There seem to be advantages in communities built around youth and structure, enabling them to withstand Covid. Military Posts, College Towns, and LDS Enclaves are among the lowest on Covid death list even though they largely sit in the middle of the pack on the Deaths of Despair list.
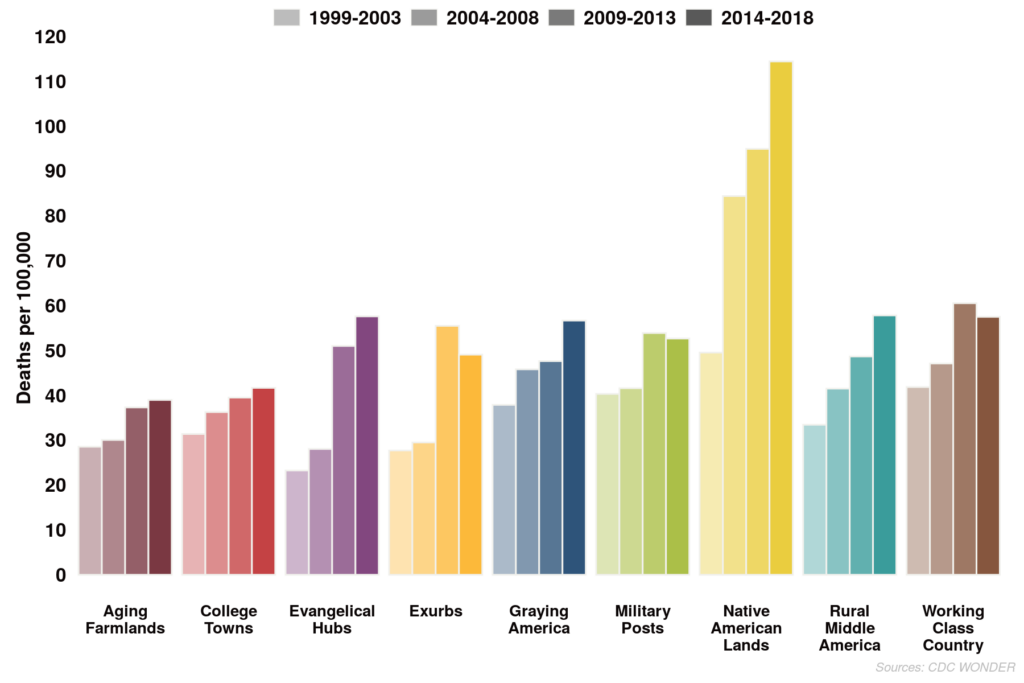
- Native American Lands stand alone in being hit especially hard by both epidemics.
Many reasons drive those differences. As the ACP often notes, communities are more than just a collection of people. They take the characteristics of the people who live in them. Some are wealthy and some are not. Some are more religious than others. Some are full of people who can transport their work to a home office; some rely on having workplaces where people can punch the clock. Those cultural factors, along with general race and age demographics, are fundamental to understanding their Deaths of Despair and Covid numbers.
The Big Picture in the Data
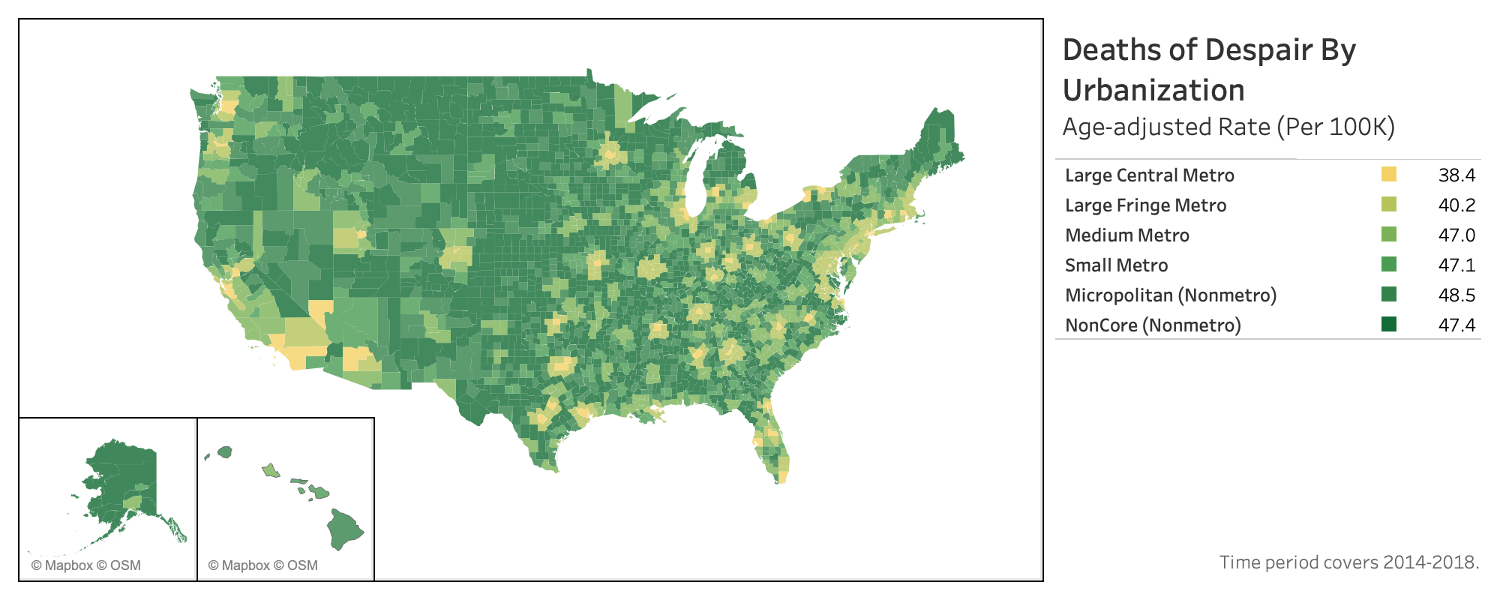
To analyze the impacts of Covid and Deaths of Despair, we measured the mortality rate for each. While the number of “cases” matters for Covid, Deaths of Despair is ultimately a measure of mortality, so we chose that measure for Covid as well. And when you look at heat maps and charts for each, clear patterns emerge.
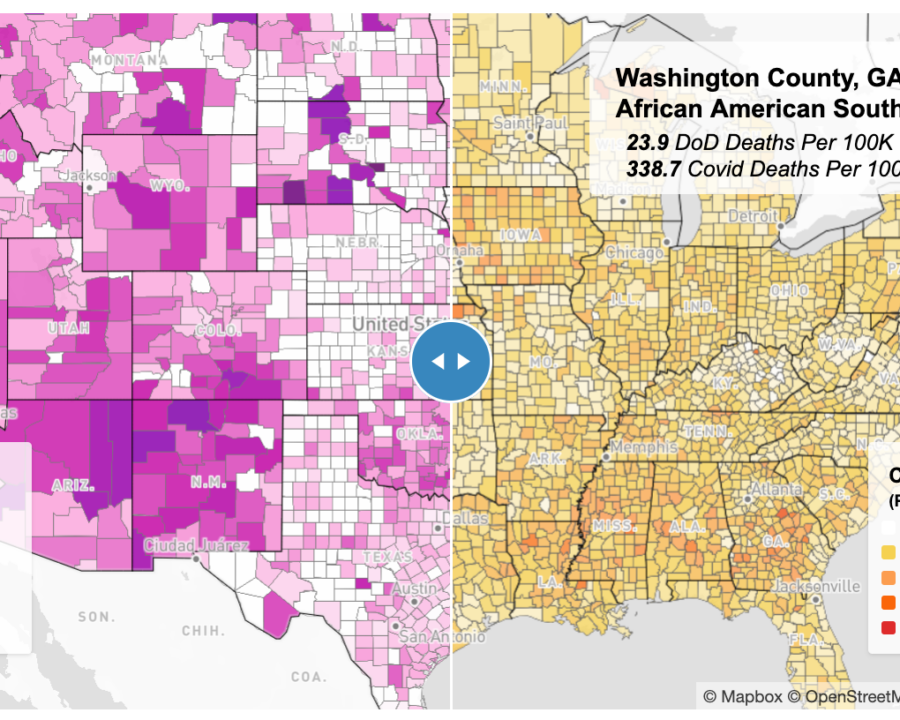
Deaths of Despair (DoD) v. Covid-19 Death Rates
To the north, counties in New Hampshire, Vermont, and upstate New York contain a collection of counties where Deaths of Despair are high while Covid death numbers are lower. Many of these communities are part of Graying America, where this pattern is common. Graying America counties rank second in Deaths of Despair, but 11th for Covid deaths.
Across the Southeast, particularly in the African American South, you can see the counties with fewer Deaths of Despair, but more deaths from Covid. In Appalachia — West Virginia, southern Ohio, and eastern Kentucky — the counties of Working Class Country show Deaths of Despair that are much higher than average and Covid deaths that are lower than average.
And throughout the Mountain West, Native American Land communities stand out for spiking on both measures.
The chart below translates those maps into rates by ACP type. On it, you can see the key findings of this report in a graphic form, the places that struggle and those that do well on each data point. (Note that on the map there are many small-population counties where we could not plot Deaths of Despair due to privacy concerns. However, the chart below contains the rates for all deaths in all communities, even those we cannot map.)
Where Deaths of Despair and Covid Have an Inverse Relationship
One of the most surprising findings when comparing Deaths of Despair and Covid data comes when focusing on three diverse county types with small median populations: Aging Farmlands, the African American South, and Hispanic Centers. All are in the bottom third for Deaths of Despair, but they are very high for Covid, Nos. 2, 3, and 4, respectively.
The median populations for all three county types are under 20,000. It’s 17,700 in Hispanic Centers, 15,300 in the African American South, and just 2,800 in Aging Farmlands. Their small sizes would seem to correlate with higher rates of Deaths of Despair, which can be driven by loneliness. On the other hand, this shared characteristic could help combat Covid-19, because rural, sparsely-populated communities seem to have an advantage for social distancing.
But the figures show opposite correlations. These community types do better than would be expected with Deaths of Despair and worse than might be expected on Covid. Why? One possible factor: Community ties that help prevent Deaths of Despair may contribute to higher Covid mortality.
These communities have additional factors that lead to enhanced cohesiveness. In Hispanic Centers, a common ethnicity among a large part of the population helps build bonds. In the African American South, there can often be sharp racial divides between Blacks and whites, but also a support network among Black friends and neighbors. Aging Farmlands, while rural and remote, often have strong individual identities.
Beyond those factors, religious adherence may play a big role in these three kinds of communities. All are among the top five community types in adherents per 1,000 population — more than 50% of people in each community type are active members of a religious congregation, according to the Association of Religion Data Archive.
There are additional factors in these communities, of course, particularly the LDS Enclaves, which are discussed later in this report. But higher levels of religious adherence is an important element in these places.
Not only do churches create social connections in communities, but they also give congregants a larger sense of meaning in life. That can be a powerful one-two punch that offers purpose and belonging. Those thoughts and connections can be a bulwark against Deaths of Despair. Higher rates of religious adherence often signal deeper and broader community connections. For example, a group of people know each other in multiple ways, from the neighborhood and from the pews.
Those tight bonds can pose a problem during Covid. Throughout 2020, funerals turned out to be super-spreader events, and that took a large toll on communities with deeper religious connections. In the virus’s early days, two funerals in Albany, Georgia, in the African American South, turned the town into a “hotspot” in part because many friends, neighbors, and fellow congregants gathered to say goodbye. The stories were similar around the country, particularly in rural, close-knit communities.
To be clear, these communities are home to other health dynamics that push up their Covid numbers: large elderly populations (Aging Farmlands), high diabetes rates (the African American South), and high uninsured rates (Hispanic Centers). But the combination of health and social factors is likely behind the inverse correlations between Deaths of Despair and Covid mortality.
Places that Hold Distinct Advantages
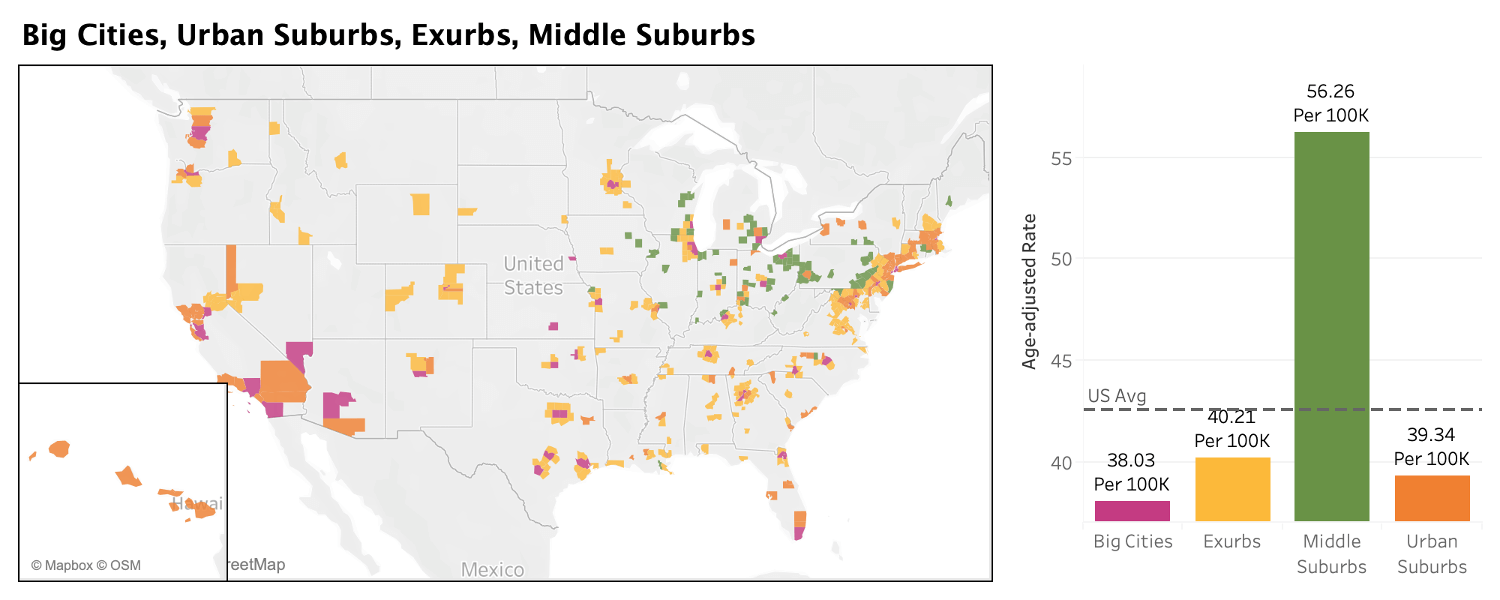
While some communities stand on opposite ends of the most dire consequences of Deaths of Despair and Covid, a few sit on the low end of both epidemics. Urban Suburbs and Exurbs hold socioeconomic advantages over most of the other community types on a broad list of measures, and those advantages extend to both epidemics. The two community types fall in the bottom half for deaths from Covid and the bottom third for Deaths of Despair.
Two advantages of the Urban Suburbs and Exurbs: health insurance numbers (they have low uninsured rates for adults) and median household income (they rank first and second in the ACP). Both suburban community types have larger numbers of people with college degrees and lower unemployment rates than other types.
Where Deaths of Despair are concerned, those kinds of numbers suggest some insulation from the worst outcomes. While they don’t address deeper community ties, friendship, or loneliness, they at least suggest communities where people are economically comfortable, with resources and opportunities.
However, the Urban Suburbs and Exurbs are two of the ACP’s more populous community types. Along with Big Cities and Middle Suburbs, they are the only community types where the median populations are above 100,000. And that kind of population density would seem to be a negative during the Covid-19 pandemic. So why are their figures so low? They are full of people who had jobs that could be made into “remote work.”
A lot of jobs moved into home offices (or kitchens or living rooms) during Covid, but the greatest number of shifts happened in the nation’s most populous counties. On the whole, 31% of American adults, some 77 million people, had their jobs shift to working from home in 2020 due to Covid, according to data from MRI-Simmons, a consumer research firm. But three-quarters of those job shifts, encompassing 59 million people, happened in the nation’s largest counties. The work-from-home numbers got smaller as the counties got more rural.
Those counties, “A and B Counties” in the demographic breakdown, hold the majority of the Urban Suburbs and Exurbs. And when you consider the higher incomes and education levels in both community types, you can see how they were especially protected from the worst parts of the Covid-19 pandemic: fewer interactions in closed spaces with non-family members. And as business travel was pared back, they were spared from exposure they might have had in airports or on planes.
In short, happiness and well-being aren’t all about economic prosperity, but there are people and communities that hold advantages in 21st-century America. The Urban Suburbs and Exurbs have some economic and social factors in their favor that protect against a range of challenges, including Deaths of Despair and Covid.
The Power of Youth and Organization
Three ACP types stand out for having low rates of Covid deaths, ranking in the bottom third, but sitting largely the middle of the pack for Deaths of Despair. College Towns, LDS Enclaves, and Military Posts are an odd mix in some ways. LDS Enclaves have the highest percentage of religious adherents in the ACP, while College Towns and Military Posts are near the bottom. College Towns lean left politically, while the other communities are quite conservative. Military Posts often feature bases where groups of people work in close quarters, while LDS Enclaves are usually rural.
But there are two larger organizing principles for all three types.
First, all these communities have an advantage during the Covid pandemic because of their relative youth. They have the largest percentage of population in the 18- to 24-year-old range. The three are among the top four ACP types for population in 18- to 39-year-old range. (The other is Hispanic Centers.)
Advanced age is one of the biggest comorbidity factors for Covid, and these three community types have larger, younger, and more vital populations than most others. More than 7% of College Towns are 18 to 39. This youth cohort makes up 6.7% in the LDS Enclaves and 6.4% in the Military Posts. That means even if there is more virus spread — which we have seen in the LDS communities and in some College Towns — the impacts are often not severe because the population is less susceptible.
But that doesn’t explain all the differences for these communities. Their Covid death rates are much lower than the nation as a whole — less than 120 per 100,000 people. Other community types that also hold larger shares of young people have much higher Covid death rates. More than 6% of the population in Big Cities and Hispanic Centers fall into the 18-to-39 age group, and their Covid death rates are 165 and 197 per 100,000, respectively.
What other factors might be in play?
A second commonality of these community types: All are tied to a larger community structure that helps organize them. LDS Enclaves are usually deeply connected to the Mormon Church. In many of these communities, the secular leadership is full of church members, which creates a deeper sense of working together. College Towns are often strongly tied to an institution of higher learning — not just students, but professors and other employees as well. This helps create more of a shared purpose or identity. And, of course, Military Posts are not only full of soldiers, but often veterans and contractors who are part of a larger connected atmosphere.
It may be that those kinds of bonds help foster a mission to “work together” to get control of the Covid pandemic. Mitigation approaches like mask mandates might be more easily accepted in communities where people are all on the same page. Leadership matters in any pandemic, but it helps to have populations that are prepared to follow. The structure baked into these communities may make an important difference.
A Double Hit in Native American Lands
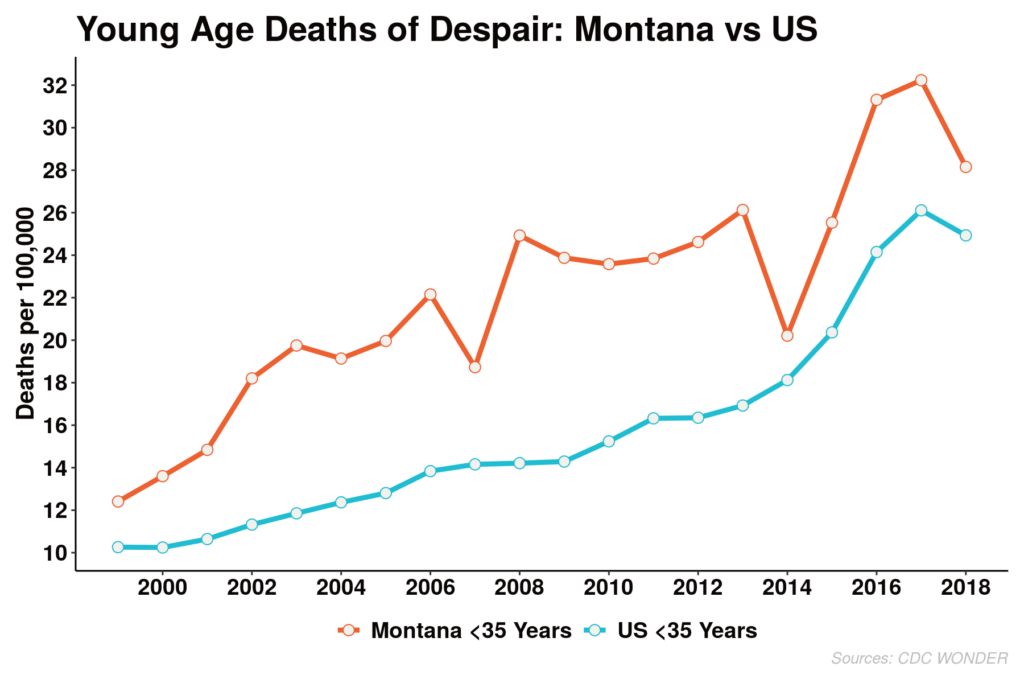
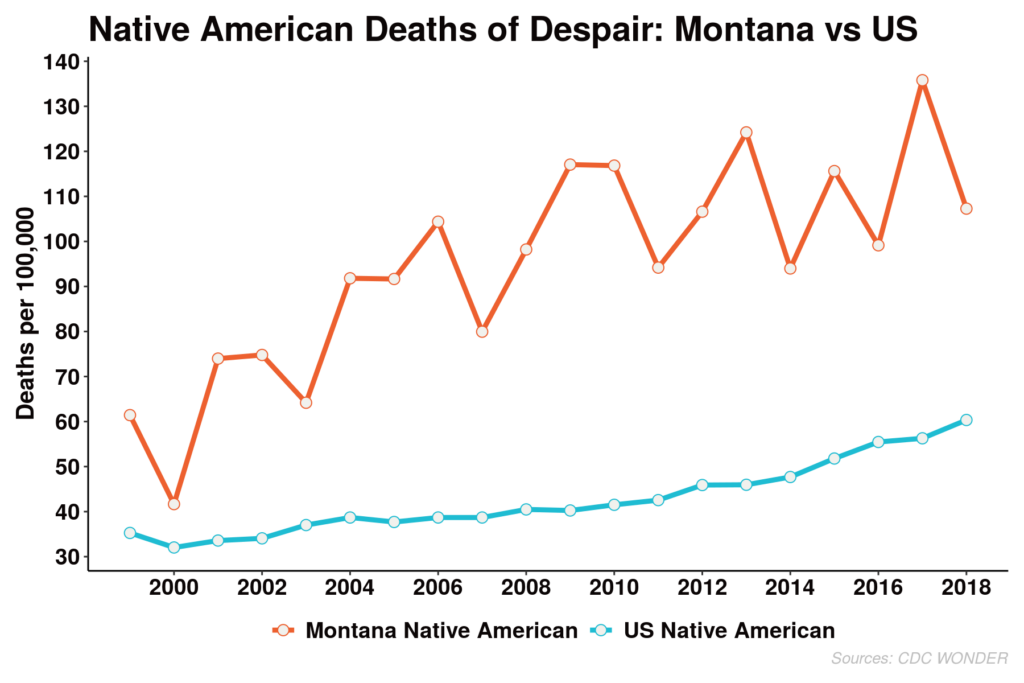
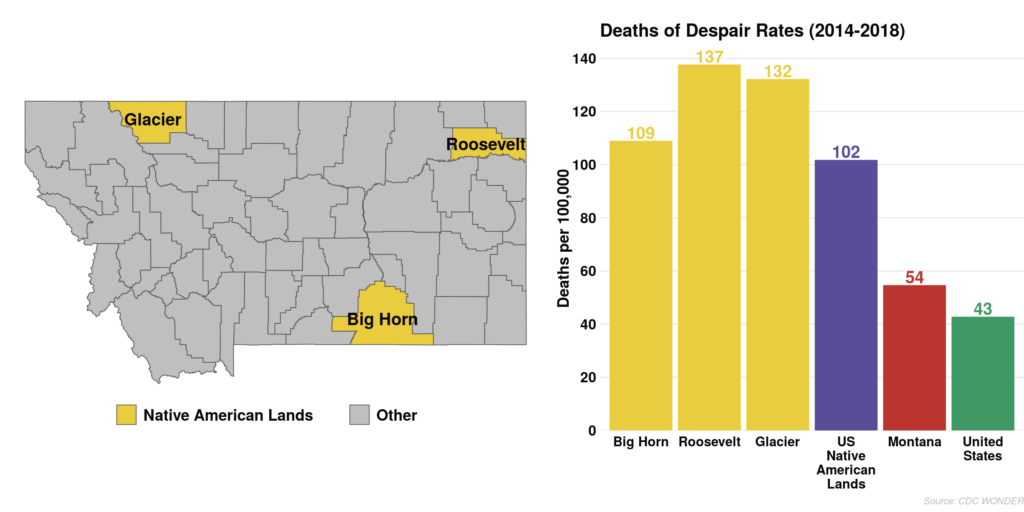
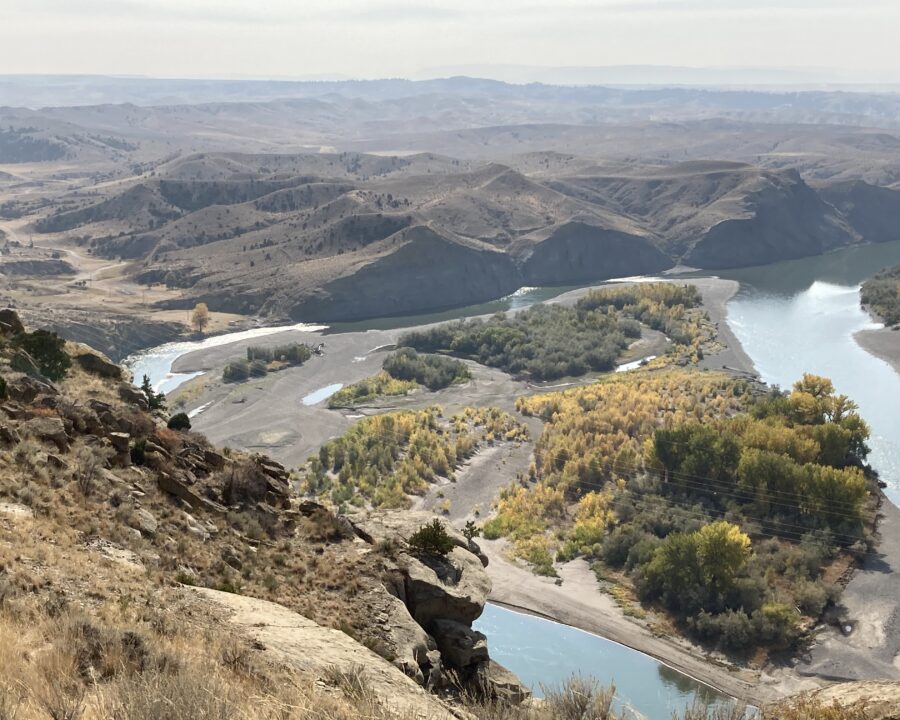
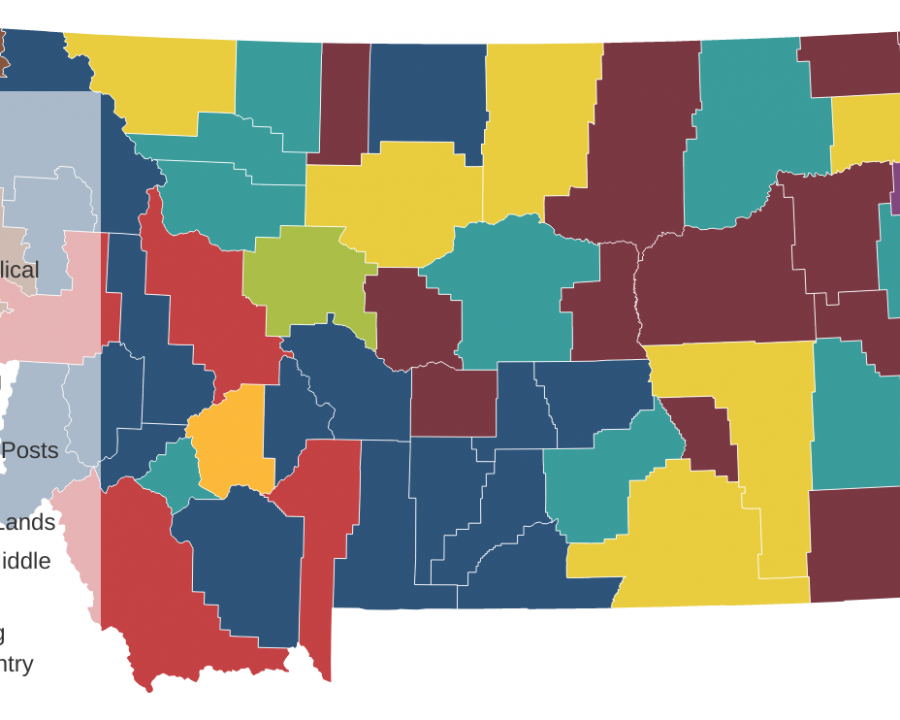
A particularly sobering finding in the ACP’s analysis: the deep challenges in the counties we call Native American Lands. As we noted in our first report, those 43 counties experience Deaths of Despair at a rate of more than twice the national average, at 101 per 100,000 population. Last fall, veteran journalist Ray Suarez visited Montana and wrote about what’s happening there.
And the Covid pandemic, which seemed to hit some communities in very different ways than Deaths of Despair, did not have that inverse impact in these parts. Native American Lands saw the worst impacts of both epidemics, ranking No. 1 for both. And, as it was with Deaths of Despair, the figures for Covid deaths stood out for being high above other groups. The Native American Lands were the only community type with a Covid death rate of higher than 300 per 100,000 population.
The Native American Lands did have a few advantages where Covid was concerned. These communities tend to be sparsely populated, which allows for easier social distancing, and they often hold a deep community identity. But a wide range of issues serve as a strong negative counterbalance. If Urban Suburbs and Exurbs offer evidence that socioeconomic advantage can lead to health advantages, the Native American Lands show the opposite is true as well.
Native American Lands scored highest in the ACP types in obesity and smoking rates. They scored in the top two community types in percentage in poor health, uninsured adults, severe housing problems and food insecurity, according to the County Health Rankings. They are among the lowest in median household income and flu vaccination rates.
Many tribal communities understood the dangers of Covid early. Some closed their borders to try to keep out visitors who might more easily spread the virus in what proved to be a more susceptible population. Yet the numbers for Covid deaths stand far above other community types in the ACP, at 318 per 100,000 people.
In some ways the story of Covid-19 in Native American Lands is evidence that strong will and good community effort can only go so far. At some point, the lack of access to the “social determinants of health” is too much to overcome without additional help.
To be clear, this analysis is not exhaustive. Some additional points to note: The Evangelical Hubs are ranked relatively high for Deaths of Despair and Covid mortality. And the communities of Rural Middle America sit in the middle for each. Many socioeconomic and geographic factors play roles in those rankings. Furthermore, there are deeper analyses of Deaths of Despair that will only be possible when those data become available. (It will take years for the county numbers to be released at a national level.)
In the meantime, the ACP will publish a second exploration of this topic, looking at one of our target states, Montana. Working with the state government there, we have obtained detailed data about deaths in the past year — as the two epidemics have been raging simultaneously. We will release that analysis in the coming days.


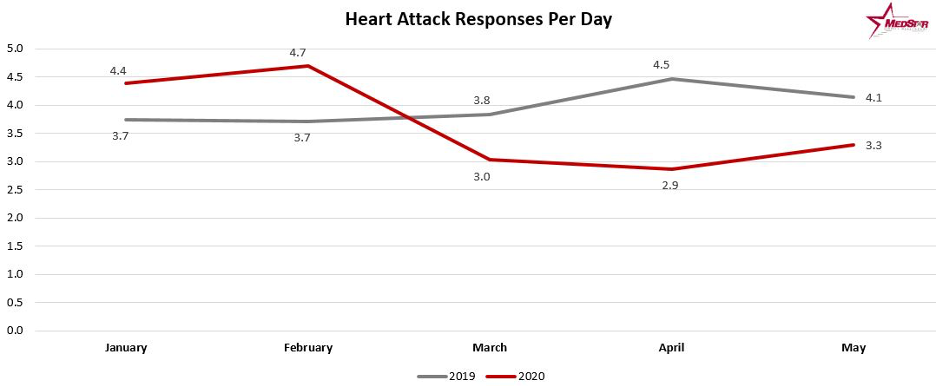
 In the “Morbidity and Mortality Weekly Report” released June 3, 2020, the Centers for Disease Control and Prevention stated, “During an early 4-week interval in the COVID-19 pandemic, emergency department (ED) visits were substantially lower than during the same period during the previous year.”
 Stephen Love is President/CEO of the Dallas-Fort Worth Hospital Council.