
American Communities Experience Deaths of Despair at Uneven Rates
There’s a long list of measures that examine who is struggling in the United States — from poverty rates to income inequality — but in recent years a complicated set of personal struggles and challenges has come to be measured in one phrase, Deaths of Despair. This phrase describes deaths caused or brought on by alcohol and drugs as well as suicide. Behind the three words is a long list of root causes.
With this piece, the American Communities Project begins a two-year exploration into the causes and effects of Deaths of Despair, as well as positive interventions that might help decrease the phenomenon, funded by The Arthur M. Blank Family Foundation.
We’ll explore the term through the ACP’s 15 community types and analyze what drives the differences in deaths by community. The data raise many questions, including:
- Why do some types of community seem to struggle with high numbers of Deaths of Despair and others do not?
- How much of a factor is the racial composition or median age of a community, or the economic situation on the ground?
- How do some communities overcome their challenges?
This effort will also explore the impact of the Covid-19 pandemic on Deaths of Despair in the United States. The Well Being Trust has already written that the pandemic could lead to an additional 75,000 deaths from alcohol, drugs, and suicide.
Three Major Findings
This first article on the topic is a snapshot of what has become an important issue in the American discourse on health, well-being, and socioeconomics. An analysis of Centers for Disease Control and Prevention data from 2014-2018 with the help of the Center on Rural Innovation reveals three major findings.
- On the whole, urban places are faring much better that rural ones in the Deaths of Despair data, but they are not immune. There are notable differences among different kinds of urban communities, particularly the blue-collar Middle Suburbs, where the numbers are high.
- Deaths of Despair rates do not break down cleanly along white and nonwhite community lines. In particular, communities of color have vastly different experiences with Deaths of Despair. Native American communities have suffered greatly, while communities with large African Americans populations have not.
- Traditional economic and educational measures of a “thriving” community are not wholly determinative. Some “struggling” communities have high Deaths of Despair numbers while others have lower ones. The finding suggests other cultural factors play a bigger role.
Diving into the data brings a fuller understanding of these points.
The ACP Frame and Findings
The frame for this analysis is the 15 community typology created by the American Communities Project at the county level on the map below. Click on individual counties to learn their ACP type and age-adjusted Deaths of Despair (DoD) rate — as well as the rates for each of the component elements of that figure. The side of the map displays the overall Deaths of Despair rate for each ACP type. All the rates are per 100,000 people while adjusting for age.

This analysis was done with the help of the Center on Rural Innovation using the CDC’s WONDER database. The causes of death associated with alcohol, drug, and suicide follow International Statistical Classification of Diseases and Related Health Problems 10th Revision. All Deaths of Despair cause codes are based on the codes used by Angus Deaton and Anne Case in their 2020 book, Deaths of Despair and the Future of Capitalism. A more detailed methodology can be found in this PDF: Deaths of Despair Methodology.
More Nuanced Divides than Urban/Rural
Since the phrase Deaths of Despair became a common term five years ago, much of the focus has been on rural communities’ struggles. Princeton Professors Case and Deaton published research showing increases in mortality rates among white, non-Hispanic Americans between the ages of 45 and 65 who did not hold a college degree — a group that makes up a larger percentage of rural communities.
Indeed, the National Center for Health Statistics breakdown of urban and rural counties shows that rural focus has merit. The figures below are all annual averages for the five-year period from 2014 to 2018.
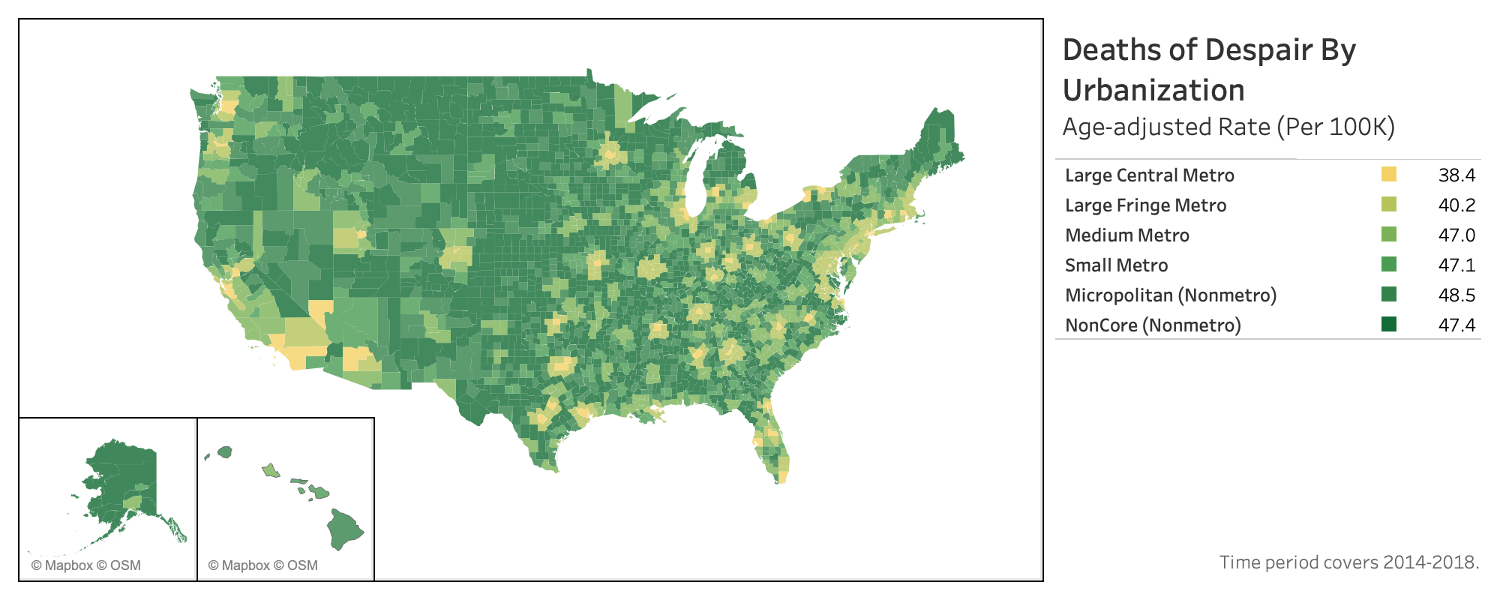
As the map above shows, the Deaths of Despair rate is lowest in the most populous urban counties, and the figures tend to climb as population density falls.
- Large Central Metro Counties (metropolitan hubs with more than 1 million people) have 38.3 Deaths of Despair per 100,000.
- Large Metro Fringe Counties (other counties in metro areas with at least 1 million people) have 40.2 deaths per 100,000.
- Medium Metro counties (between 250,000 and 1 million people) have 46.9 deaths per 100,000.
- Small Metro counties (those with less than 250,000) have 47 per 100,000 people.
- Micropolitan counties (between 10,000 and 50,000 people) have 48.4 Deaths of Despair per 100,000.
- Non-core Metro counties (10,000 people and under) are just a bit lower at 47.4 per 100,000.
The consistent climb from largest to smallest community is not perfect but it is close. The difference between the most populous counties and the least populous is 24%. It suggests that urban communities hold advantages in the Deaths of Despair story. Perhaps closer proximity to friends and neighbors leads to less loneliness and/or more urban places have access to better resources.
But in the ACP frame, the numbers in the most urban areas look very different, again, using averages from the same time period, 2014-2018. (See the map and chart below.)
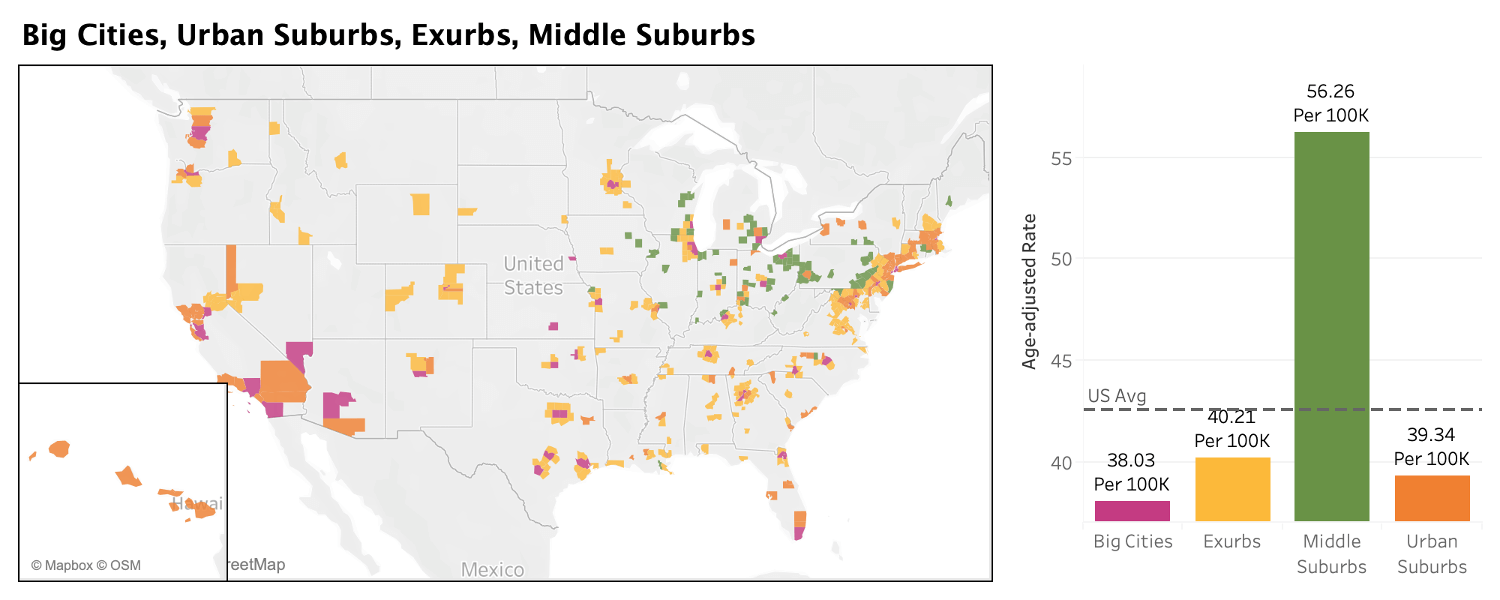
- The Big Cities, counties home to the nation’s most populous cities, come in at 38.0 deaths per 100,000 residents. Nationally, deaths are 42.5 per 100,000.
- The Urban Suburbs, which tend to sit outside those big urban centers, look very similar, with 39.3 deaths per 100,000.
- The less-populous Exurbs on the outskirts of many urban areas, have 40.2 deaths per 100,000 residents.
- But the Middle Suburbs, a set of blue-collar urban counties based in the Industrial Midwest, are far above the others at 56.3 deaths per 100,000 residents. The figure is roughly 19% higher than the most rural county type in the National Center for Health Statistics urban-rural classification.
The differences in the data are not only regional but also more proximate.
Consider Delaware County, Ohio, an Exurb of Columbus. It has a Death of Despair rate of 24 deaths. But one county away to the northeast, the Middle Suburb of Richland County, has a rate of 65.
Outside of Detroit, Oakland County, an Urban Suburb in Michigan, has a rate of 40 deaths per 100,000, but neighboring Macomb County, a Middle Suburb, has a rate of 57 deaths.
What’s driving those distinctions is complicated.
The Middle Suburbs tend to have lower incomes than their neighboring counties and fewer college degrees, two big factors in the Deaths of Despair rate. In addition, these counties, long home to manufacturing employment, have been hit particularly hard by deindustrialization in the past 20 years. Many residents have lost union jobs, and experienced economic and health hardships as a result. Their blue-collar legacy also means some workers likely have endured repetitive stress injuries, which may have spurred greater use of prescription drugs.
Drug use is the top cause of death among the Deaths of Despair categories in the Middle Suburbs, making up more than half of all deaths at 31.7 per 100,000 people. Drugs are the leading cause of such deaths in many of the ACP community types, but not at that ratio.
The Middle Suburbs also tend to be older than other urban-oriented communities and are not adding population as fast as surrounding counties — in some cases they are losing population.
The Middle Suburbs’ hardships illustrate that the Deaths of Despair crisis does not break down neatly along the urban/rural divide.
Bright Spots and Pain Points in Communities of Color
The ACP’s two recent health and well-being reports showed that the challenges for the African American South, Hispanic Centers, and Native American Lands were steeper than for other ACP community types on a range of issues, from health insurance coverage to food security.
That pattern does not hold for Deaths of Despair. The roles of race and ethnicity seem muted, when looking at the average age-adjusted rate of Deaths of Despair from 2014 to 2018.
The African American South does better than the country as a whole. Hispanic Centers do better as well. However, Native American Lands have the highest rate of death in the ACP, by far. In other words, a “minority community” does not necessarily have more Deaths of Despair. (See the map and chart below.)
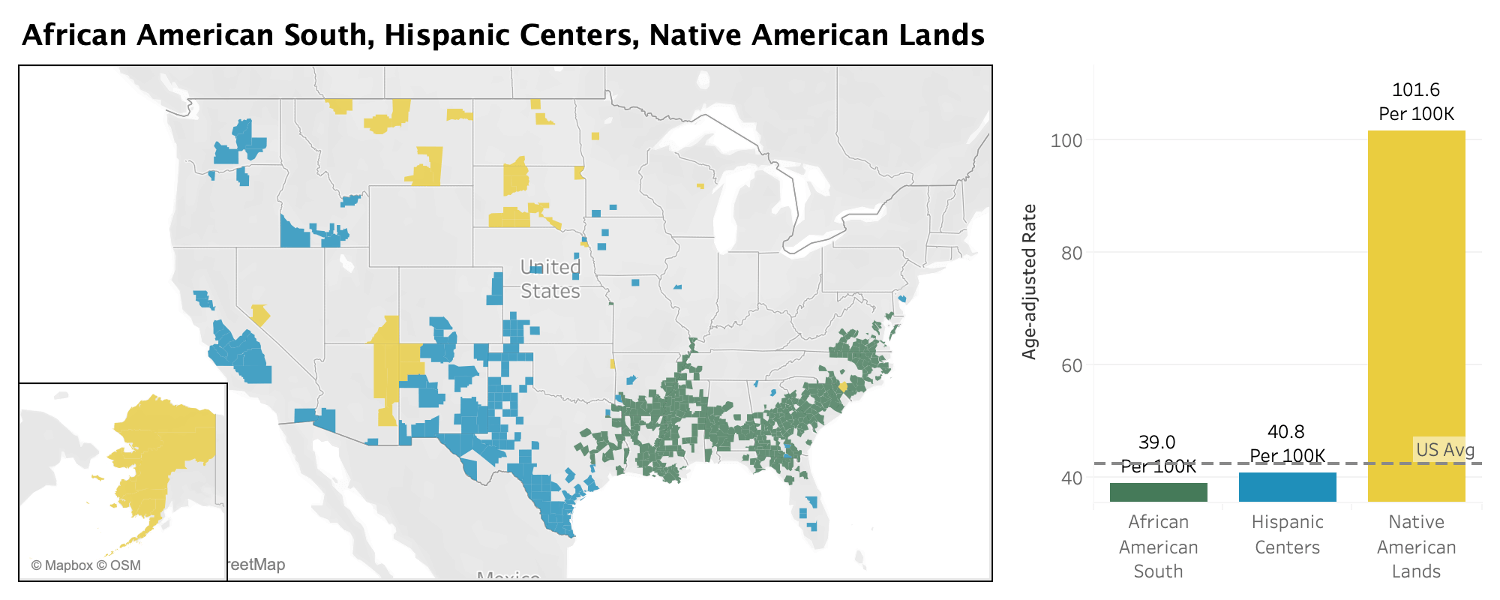
Among communities of color, and among the data overall, one community type stands out: the Native American Lands. In these 43 counties, the overall Deaths of Despair rate is a staggering 101.6 per 100,000 people. The Native American communities are also nearly twice as high as the next highest community type, Graying America, which has an overall rate of 57 per 100,000.
To be sure, those high figures are driven by a few counties with the greatest struggles. In Oglala Lakota County, South Dakota, the figure is 226 per 100,000 people. In nearby Mellette County, South Dakota, the rate is 183. In 20 Native American Lands counties, the overall rate for Deaths of Despair is above 100 per 100,000. The problem runs deep.
Native American Lands contain a discrete set of counties in the ACP. Most of these 43 counties are majority Native American, and the Native American populations within them are unique. They generally live together on reservations away from others. For those reasons, this group of communities may reveal the most about the challenges of a specific racial/ethnic group. These are places where the ties between community and identity are especially strong and where the challenges are many. On reservations, residents experience poor health care and extreme poverty. Off of tribal lands, discrimination is part of everyday life. Many of these communities also bear the scars of intergenerational trauma.
The deaths in the Native American Lands are driven most heavily by alcohol. The alcohol-related death rate in these communities is 44.2 per 100,000 people. That figure is higher than the overall Deaths of Despair rate of seven of the other 14 ACP types, but alcohol is not the only hard test in these counties. The suicide rate of 31 per 100,000 is the highest of any ACP type as well.
In short, the challenges in the Native American Lands appear complicated and deeper than any one concern. While economic opportunity has long been a struggle in these places, that alone doesn’t explain the high numbers here. Isolation may play a role, as most of these communities are remote. And many Native Americans say the discrimination they face away from their tribal lands can be harsh and make reservations feel like the safest places to be.
At the other end of the spectrum, the low rate for Deaths of Despair in the African American South is striking. The numbers there, 39 per 100,000 people, are not just below the national average of about 42.5 per 100,000, but below the figures of the whiter and wealthier Exurbs, where the rate is 40.2 per 100,000.
To be clear, most counties in the African American South are not majority African American, but counties where the Black population sits above the national average of roughly 13%. Racial divides and tensions are often woven into everyday life.
Despite an uneasy environment, the overall Deaths of Despair rate or the rate on any single factor (drugs, alcohol, or suicide) is not particularly high in the African American South. The death rate from drugs is well below the national number — 15.9 per 100,000 versus 18.6 per 100,000 nationally – and the alcohol-related death rate is also lower. The suicide rate is higher than the national figure, but just marginally so. For the most part, the communities of the African American South have not been deeply affected by the Deaths of Despair problem.
Hispanic Centers also do well in the Deaths of Despair data. Their rate, 40.8 per 100,000, sits just under the national figure, 42.5 per 100,000.
Deaths of Despair here are driven heavily by one factor, alcohol. The rates for death by drug use and suicide are below the national averages. But the death rate from alcohol is well above it, 14.4 per 100,000 versus 10.2 nationally.
There is a geographic pattern to the highest spiking Hispanic Centers. Nineteen of the top 20 are in New Mexico, Texas, and Colorado — and some figures are high. In Rio Arriba County, New Mexico, there are 66 alcohol-related deaths per 100,000 people. In Cibola County, New Mexico, the rate is 44. Hispanic Centers in California and the Midwest appear to fare much better. These places are driven by agriculture and tend to have lower unemployment rates.
In total, the differences in these three types of communities of color offer evidence that being a member of minority race or ethnicity is not the prominent driver for Deaths of Despair. Other societal ills seem to have bigger impacts. Indeed, the relatively good numbers in the African American South suggest that large Black populations may be helping some communities ward off the worst aspects of the epidemic. In the coming months, we will visit communities in Georgia and Montana to explore these issues at the community level — and how different kinds of places respond.
The Roles and Limits of Income and Education
Health and well-being in the United States, measured by a long list of indicators, are often driven by two principle elements, income and educational attainment. A community with high scores in both areas tends to offer residents more services, more opportunities, and more stability. Employers want to access the labor force. Stores want to access the consumers. In the broadest sense, many human needs are more easily met.
Yet in the Deaths of Despair data, economic and educational success is not necessarily a ticket to handling the epidemic better. The nation’s highly-educated and well-to-do communities — the Urban Suburbs, Big Cities, and Exurbs — tend to do well. But a closer look at the five ACP community types with the lowest death rates per 100,000 people reveals a much more complicated picture, as the graphic below shows.
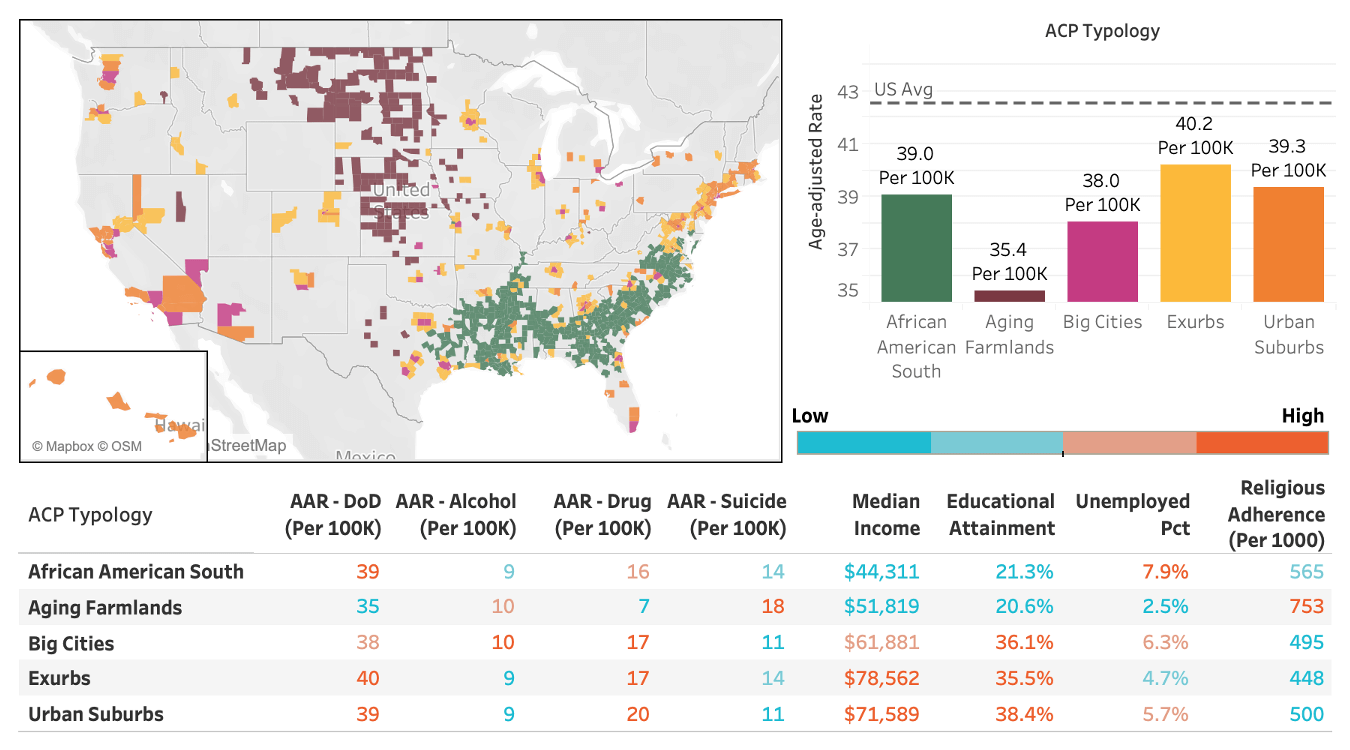
Overall, the Aging Farmlands stand out in the data, with an age-adjusted death rate of just 35.4 per 100,000 people. The densely-packed, diverse Big Cities don’t match that. Yet those rural counties look almost nothing like the educated urban enclaves on the list. Only about 21% of the adults in the Aging Farmlands have a four-year college degree. And the median household income, $51,800, is $10,000 below the amount in the Big Cities, and $20,000-or-more below the median household income rates in the Urban Suburbs and Exurbs.
Similar points hold true for the African American South, where only about 21% of adults have a four-year degree and the median household income is even lower, about $44,300. (That figure is far below the national median household income, $60,300.) Those African American South communities also have a relatively high unemployment rate, 7.8% from 2014 to 2018, compared to 5.8% percent nationally. Despite those educational and economic challenges, the African American South comes in below the national average on Deaths of Despair.
In other words, the traditional measures of socioeconomic prosperity do not necessarily mean communities fare better in the Deaths of Despair epidemic. Community types with higher median incomes and more degrees perform worse than the Aging Farmlands and African American South. In some cases, they perform much worse.
The Aging Farmlands and African American South do have their trouble spots around people ending their own lives. While both have low rates of death associated with drugs, as mentioned above, the African American South’s death rate from suicide is slightly higher than average, while the Aging Farmlands’ suicide rate is quite a bit higher than the national figure — 18.2 per 100,000 versus 13.5 per 100,000 nationally.
It could be that the overall Deaths of Despair numbers are lower in these communities because their economic situations and rural locales make accessing some drugs more difficult. Other drugs, like meth, are cheaper and more readily available.
The data suggest other elements in these communities must be making a difference, perhaps by promoting greater social cohesion and meaning. One possibility is the impact of religion.
Both the Aging Farmlands and the African American South have high religious adherence rates, 75% and 57% respectively, according to the American Religion Data Archive. Those numbers are solidly above the 49% national figure for religious adherence and also above the religion figures for the wealthier, better-educated top performing types. The faiths that dominate the Aging Farmlands and African American South are very different, but they have a common impact — helping stitch the communities together.
To be clear, religious adherence alone doesn’t appear to hold down Deaths of Despair figures. Other community types with large religious populations — the Evangelical Hubs and LDS Enclaves — have much higher Death of Despair rates per 100,000. But the specific religious traditions in the Aging Farmlands and African American South seem to be vital in holding these largely rural communities together.
Looking Forward
In the coming months, veteran reporter Ray Suarez will travel to Montana and Georgia, two states of focus in this effort, to look at how Deaths of Despair have impacted specific Native American Lands and African American South counties.