
Grassroots Blossom Across America, Reshaping Country’s Political Geography
As the 2018 midterm campaigns hit their stride last summer, there was finally some mainstream recognition that post-2016 grassroots groups — sometimes discussed as “Resistance” groups — had become an electoral force to be reckoned with. Reporters and academics have established certain baseline facts:
- The new groups are disproportionately composed of middle-aged to retirement-age college-educated women.
- They are especially prominent in America’s “suburbs.”
- Their hands-on campaigning formed part of the “Blue Wave” that flipped suburban seats to the Democrats in November 2018.
Mapping the Grassroots
Can we gather a more detailed assessment of where the new grassroots are? A previous post here tried to answer that question for Pennsylvania, combining electoral stats and firsthand observations to trace variations in grassroots intensity by county type and show the 2018 electoral swings linked to them. What does the data show across the nation as a whole?
As of January, some 4,600 groups were listed on Indivisible’s “Find Your Local Group” portal; the great majority had been posted in the first half of 2017. As we have discussed elsewhere, group listings there should not be taken as a complete list of post-’16 grassroots organizations, nor as reflecting the reach of Indivisible national headquarters per se.
Detailed study of the 225 groups listed for Pennsylvania and the 77 for Missouri confirms that some never came into existence, others are longtime local progressive groups with no ongoing connection to Indivisible, and still others have never had more than a virtual (Facebook or listserv) existence.
Map of Group Listings Included in Indivisible Portal, January 2019
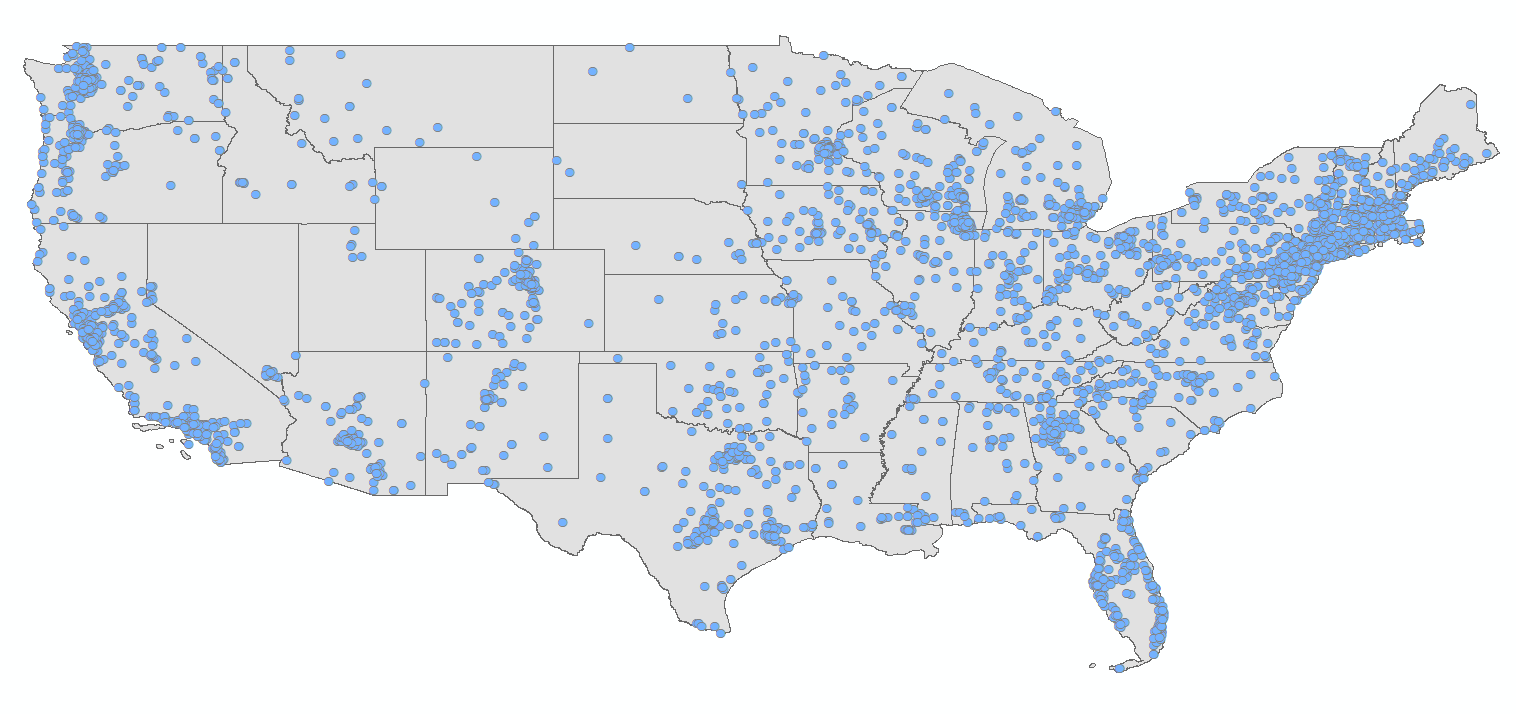
Meanwhile, sizable numbers of similar, locally-originated post-2016 grassroots groups — groups with active boots on the ground, remaking politics in their communities — never chose to list themselves in the portal. But most often, such groups are in the same places for which portal listings are dense. In Pennsylvania, the correlation between the county count of Indivisible portal listings and the county count of unlisted groups that Harvard political scientist Theda Skocpol’s research group has located through intensive local research is .87. In sum, we see every reason to treat this dataset of 4,600 posted, geographically locatable groups as the best available indicator of the strength of new grassroots organizing in reaction to the Trump presidency in any given locale.
Just eyeballing the blue dots in the map above already tells us that the landscape of change spreads well across the country, with a sizable presence in some middle American states that routinely vote Republican, and a meaningful reach well outside America’s big metros.
Note that we are not claiming these data capture all political organizing in the era of Trump. In some places existing local civic groups have remained the main channel for political organizing: This has been true for African American churches within African American communities both rural and urban, and seems to be the case with locally-rooted labor groups in Nevada. The dataset we are mapping is by no means a guide to all political action worth watching today. But it is the best guide we have to where the organizational landscape of center-to-left political engagement has most changed and grown in response to the 2016 election.
Studying the Grassroots by Congressional Districts
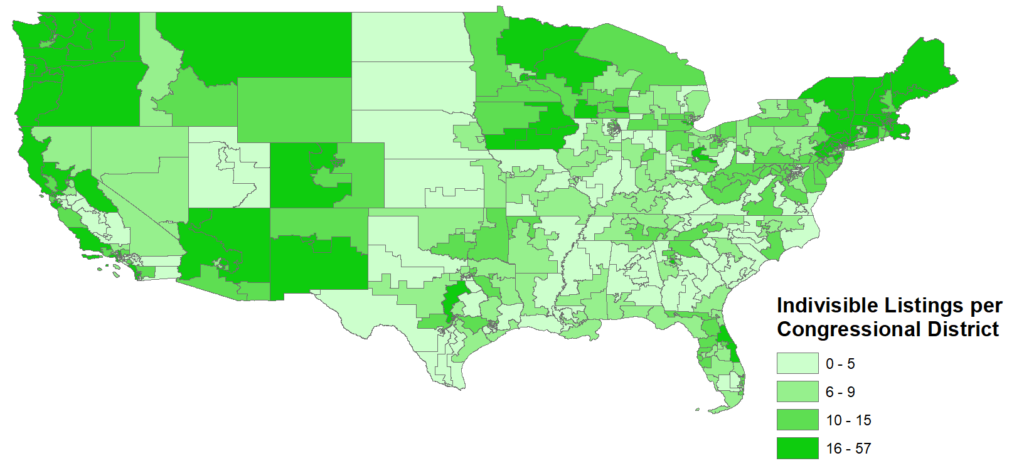
The following map, a choropleth that colors congressional districts by the number of postings (thus controlling for population density), makes the changing landscape even clearer. Rural, rural-mix, and sparse-suburban districts across Iowa, Minnesota, Wisconsin, Arizona, West Virginia, Texas, and beyond show up as having a significant new grassroots presence.
Map of Group Listings Included in Indivisible Portal, by Congressional District
When we match those districts to their 2016 presidential vote margins, a striking pattern emerges — and again, it is not one of coasts-vs.-heartland polarization. With stunning rationality, new group formation was concentrated where groups could be most impactful: in the nation’s most narrowly balanced congressional districts.
Median Number of Groups Listings per Congressional District, for Each Decile of Districts when Arrayed by 2016 Presidential Vote
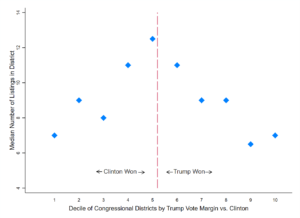
Of course, congressional districts are large enough that most encompass multiple different settings: chunks of cities; stretches of suburbs and towns, manicured and prosperous in some cases, grimly down-on-their-luck in others.
Using Counties and the American Communities Project
We can learn more about the kinds of local contexts shaping group formation when we map groups onto counties, and use the American Communities Project taxonomy to understand which kinds of places these counties represent.
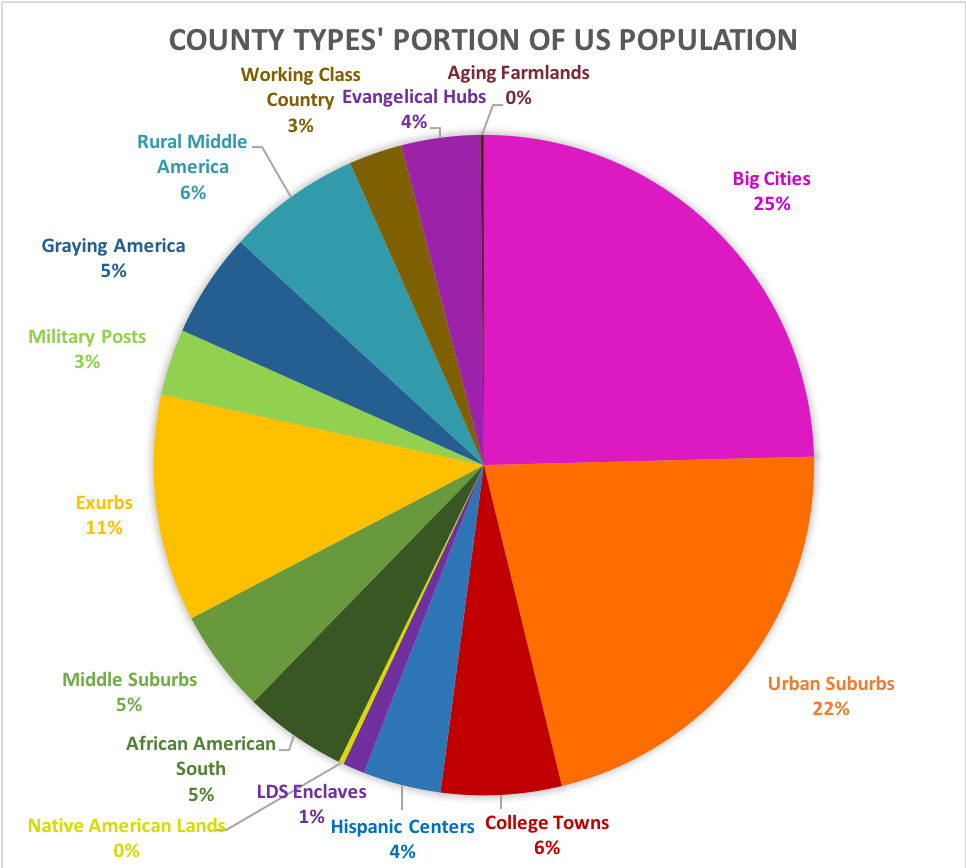
First, let’s review how the nation’s overall population is distributed across the American Communities Project’s 15 county types.
- Big City counties account for the largest share, with a quarter of the nation’s population.
- Urban Suburbs (dense, cosmopolitan, and highly educated) make up nearly as large a share.
- Exurbs (well off, less dense, and less diverse) account for half that population share.
- Middle Suburbs and Rural Middle America (each less educated, less wealthy, and largely white), College Towns, Graying America, and African American South each account for roughly half the population of the Exurbs.
- All other county types comprise even smaller shares.
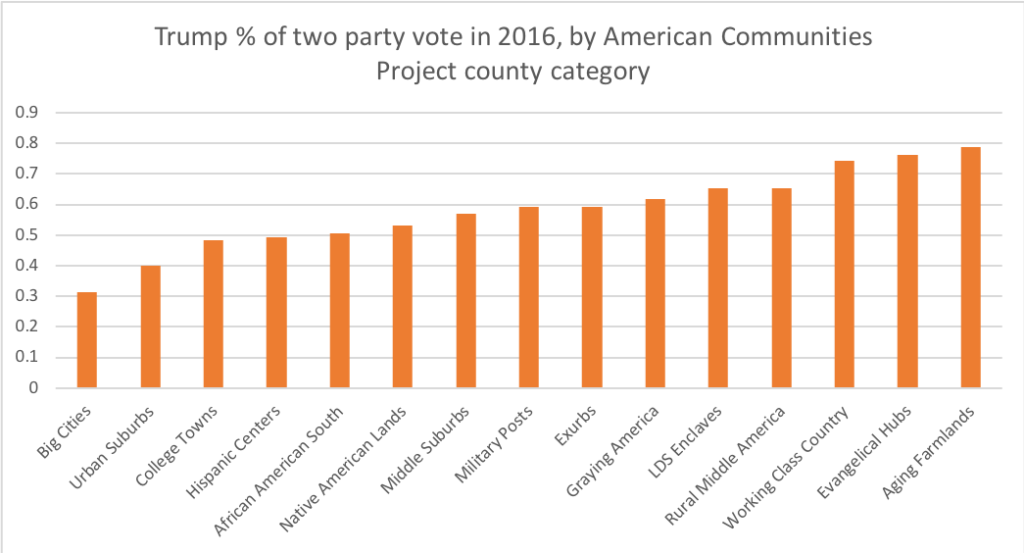
The Trump Vote by County Type
These county clusters, varying by population density, age profile, race and ethnicity, education, income levels, religion, and more, display markedly different political preferences. Less than one-third of voters in America’s Big City counties voted for Donald Trump in 2016, while almost half of voters in College Town counties did so.
At the opposite end of the spectrum, three-fourths of voters in Working Class Country and Evangelical Hub counties and nearly four-fifths of voters in America’s Aging Farmlands cast their ballots for Donald Trump.
Where Grassroots Group Listings Are Highest by County Type
Given these demographic and political differences, it is not surprising that our Indivisible portal dataset suggests the intensity of grassroots group formation varies notably by county type. What is surprising is how little the pattern of grassroots intensity reflects the pattern of presidential vote choice.
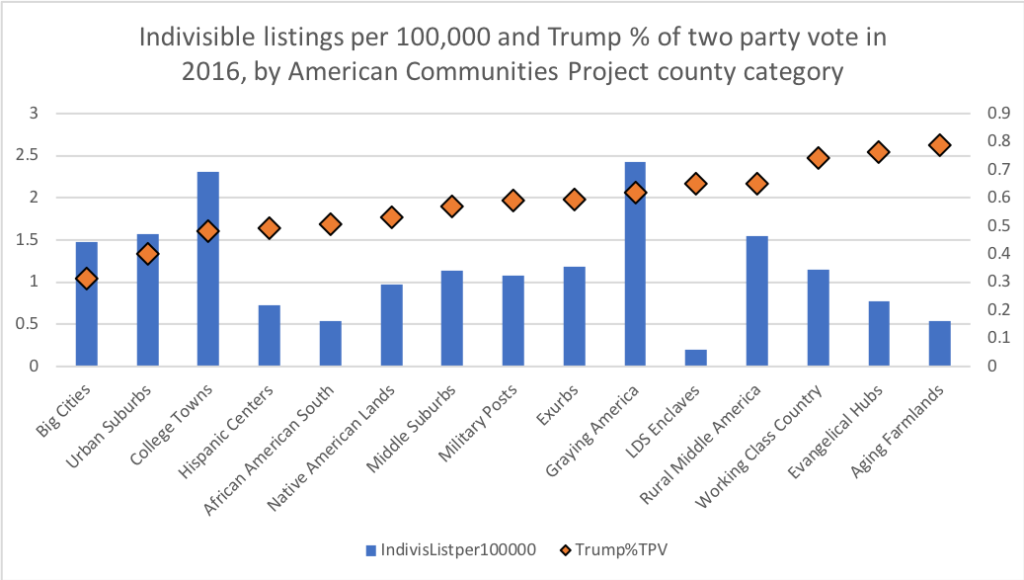
- Group listings were highest, per capita, in College Towns and Graying America.
- At the second tier down are Big Cities, Urban Suburbs, and Rural Middle America. These have strikingly similar rates of group formation despite their very different demographic and political profiles. (Donald Trump got only one vote out of three in America’s Big City and Urban Suburbs combined; Hilary Clinton did just that poorly in Rural Middle America.)
- A third tier includes five county types: Exurbs, home to 36 million people, Middle Suburbs of 16 million, Military Posts of 11 million, Working Class Country of 9 million, and Native American Lands of under 1 million.
- The lowest rates of post-2016 group formation are in Evangelical Hubs, Hispanic Centers, African American South, Aging Farmlands, and LDS Enclaves.
How Graying America Stands Out
While most county types are consistent nationwide in having either lots or few postings to the Indivisible group list, others vary more. “Graying America” stands out (stats here): This category includes some of the counties with the very highest per capita counts and also a good many of the lowest. New grassroots organizing is very high in those counties that are disproportionately older because prosperous elder folks retire to them — Arizona, Florida, Oregon, and Washington. In contrast, it is very low in those counties — largely in the Rust Belt and High Plains — whose populations are older because the young people who can leave have left
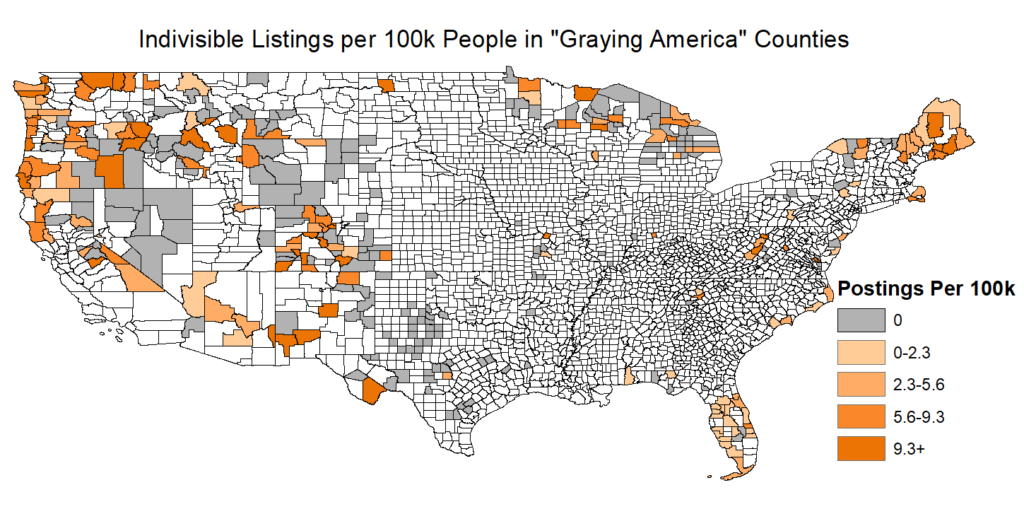
This “Graying America” map should spark questions about the impact of newly organizing, fired-up liberal retirees in Arizona and Florida: places where most of their close neighbors and peers may be staunch conservatives. How effectively are the progressive newcomers or “snowbirds” that these indicators seem to capture, connecting up with potential Democratic voters around them — who in Arizona and Florida may be quite different from the newfound activists in age, class, and cultural coordinates?
Let’s conclude by shifting away from per-capita prevalence to simple totals. As we consider where new organizing is likely to make an impact moving forward, it’s helpful to know not just where the grassroots are strong per capita, but where the grassroots are strong, full stop. Here’s what that panorama looks like.
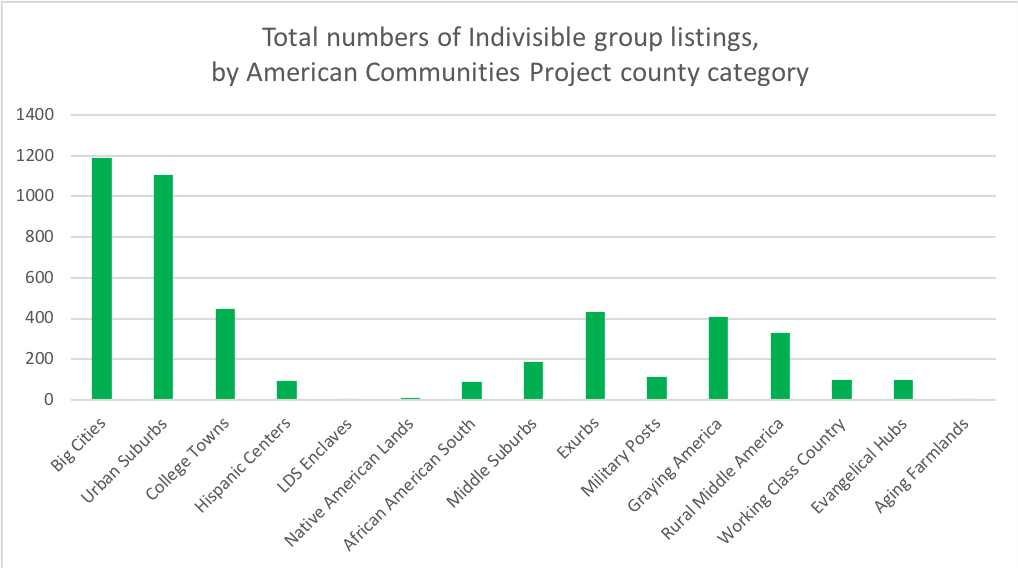
How Grassroots Groups Fit into Electoral College Map
To explore the potential impact on the Electoral College, we broke that down by anticipated presidential vote status as well. The resulting chart shows many, many postings coming from blue state Big Cities and Urban Suburbs: That captures all those new groups in metropolitan and suburban California (and New Jersey, Virginia, New York, and beyond) who flipped “Country Club Republican” congressional districts from red to blue last year.
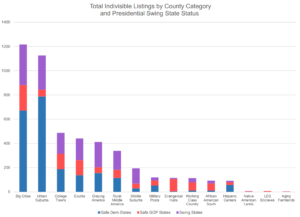
But we also see significant indicators of group activity in the swing states, in purple here: Florida, Wisconsin, Pennsylvania, Michigan, New Hampshire, Nevada, Arizona, Georgia, North Carolina, Iowa, Ohio, Minnesota, and Colorado.
The indicators of new grassroots presence in these swing states are spread far more evenly across county types than in blue states. They are found in Big City counties (as is a chunk of purple state population). But purple state Urban Suburbs, Graying America, Rural Middle America, Middle Suburbs, Exurbs, and College Towns are now home to significant boots-on-the-ground for center-to-left electoral action as well.
There has been a lot of supposedly savvy commentary recently about how narrow a slice of America will decide the 2020 presidential election. But post-’16 grassroots group formation shows regular citizens forging a far broader geography: of small-d democratic action today, and of capital-D Democratic possibility over the long term.