One hundred days into the new administration, the Biden White House has seen massive improvements in the new Covid-19 infection numbers — and those improvements are spread across the 15 county types of the American Communities Project, according to data from USA Facts analyzed by the ACP.
To be clear, there are still differences in the 15 types, but every one of them experienced a new infection decline of at least 40% compared to the 100 days before January 20.
There is likely a long list of reasons for that change, of course. The huge spike in new cases that accompanied the holiday season was sliding downward and the rollout of the Covid-19 vaccines undoubtedly played significant roles. But the declines have come on Biden’s watch, which means he is likely to benefit in voters’ eyes.
Measuring the Drops
The uniformity of the change is not something the ACP often sees. Generally, the socioeconomic, cultural, and political differences that define the community types take them on very different paths. (In February, we noted how rural places were seeing jumps in cases.) But these latest data are largely an exception.
The differences between the two ends of the changes are sharp — an 80% drop in Aging Farmlands versus a 43% drop in Graying America — but every community type has seen significant improvement.
The data also show that rural community types in the ACP have seen some of the biggest declines. Along with Aging Farmlands, the LDS Enclaves, Native American Lands, Rural Middle America, and Evangelical Hubs, have all seen drops of 60% or more in new Covid cases. Those are all communities where populations are less densely packed, which may have aided the cause.
Meanwhile, the most urban types in the ACP also saw deep drops, but not to the same degree. The Middle Suburbs, Big Cities, Exurbs, and Urban Suburbs all experienced drops between 53% and 44%. Those numbers at least suggested that, even with the declines, communities with higher population density were more likely to see transmission.
Looking at the data at the county level showed, again, how uniform the declines in new cases were. Of the roughly 3,100 counties in the United States, 3,000 saw declines in new Covid-19 cases in the Biden administration’s first 100 days — and three quarters of those counties saw new cases decline by 50% or more.
Larger Meanings and Politics
The larger meaning of these drops, beyond the obvious impacts of taming the virus, is hard to discern. For much of the past year, Covid-19 has been the dominant news story, viewed through a range of prisms: health and wellness, economic, education. And the pandemic clearly played a large role in the 2020 political campaign.
These numbers could be significant when it comes to politics. The community types seeing the biggest drops in new cases are also heavily Republican in their voting habits and most supported former President Donald Trump by large margins. Trump won the Aging Farmlands by 56 percentage points. He won the Evangelical Hubs by 51 points. He captured Rural Middle America by 28 points and the LDS Enclaves by 26 points. The numbers suggest those communities are solidly with the GOP.
But margin sizes matter. A major political story in 2022 and 2024 may be whether the turnaround on Covid buys Biden or the Democrats goodwill in some of these community types. Democrats aren’t going to win a majority in any of these types, but closer margins (something closer to a 20-point GOP edge in Rural Middle America) could have major implications for statewide and legislative races, particularly if Democrats maintain their big margins in urban communities.
How much the Covid numbers matter politically may depend on whether improvement continues across the ACP types. Do the numbers eventually hit a wall?
Then, there’s the larger question of how long the pandemic continues to shape the news. Does it kick off a prolonged economic boom? Do things quickly settle into a new normal that feels not that different from the old normal?
The midterms are more than 17 months away, and the next presidential election will take place more than 41 months from now. That’s several lifetimes in politics. But the improvement in these numbers across all ACP types suggests the potential for a notable political shift ahead.
There have been a lot of anecdotal accounts of suicide and overdose rates surging during the pandemic. From early reports from Colorado about a tripling of the drug overdose rate to reports from Nevada about teen suicides as young people struggle isolated from schools and peers, the stories are compelling, but incomplete.
The American Communities Project worked with the Office of Vital Records at Montana’s Department of Public Health and Human Services to get a statistical understanding of the tumultuous intersection of Covid-19 and deaths of despair. The state allowed the ACP to analyze 197,000 death reports from 2000 through the end of 2020 to identify trends and see what may have happened during the worst of the lockdowns and social isolation.
Overall Findings Reveal Alcohol’s Effect
After examining this statewide data over the 20-year span, 2020 stands out in a few important ways:
First, the surge in alcohol-related deaths was significant both in terms of the rate and the actual number of deaths.
Secondly, the suicide rate remained largely flat despite the pandemic’s forced isolation and the interruption to normal routines.
Drug overdoses appeared to be on the rise, but that is mainly attributable to a spike in April. Since then, the numbers have declined steeply.
Despair Deaths Through the ACP Lens Show Volatility
When one examines the same reports through the lens of the American Communities Project, the story of what happened to communities during Covid becomes much less consistent.
As the ACP reported in late March, initial comparison of deaths from Covid and deaths of despair find the mortality rates vary depending on economic and cultural factors.
The same holds true in Montana, but with a sparse population and large counties, data from Montana are often more volatile as individual cases can swing numbers in a county.
But still, sorted through the ACP community types, the portrait of Montana’s fight against deaths of despair during Covid becomes very different.
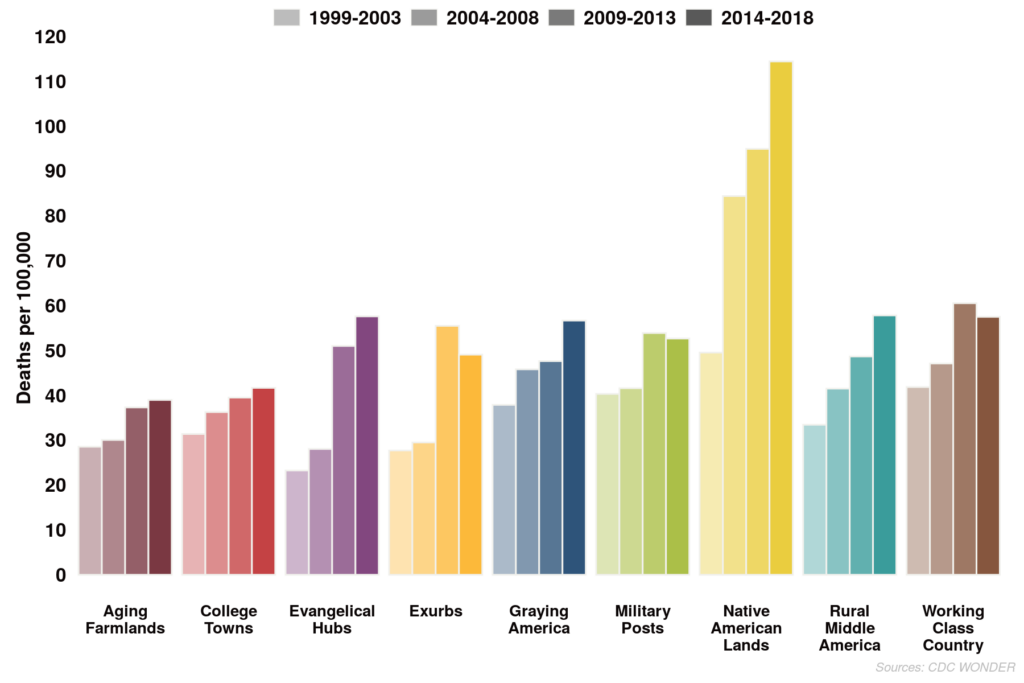
While deaths of despair appeared to drop toward the end of the year, 2020 still was a record bad year in three different community types in Montana: Native American Lands, Graying America, and Working Class Country. In each of these community types, the deaths of despair rate was up significantly from a five-year average.
Spread throughout the south-central part of the state and along the Rocky Mountain Front, Graying America comprises counties with older populations. Working Class counties are situated in the northwest corner of the state. These two community types saw their deaths of despair soar due to suicide increases. In particular, the three Working Class counties of Lincoln, Sanders, and Mineral saw steep jumps in the number of suicides in 2020.
Although the news was also troubling in Native American counties like Big Horn, Glacier, and Rosebud, where the deaths of despair rates climbed due to major jumps in alcohol-related deaths.
The sparsely populated Aging Farmland counties and College Town communities like Missoula and Bozeman saw either drops or little change during the pandemic.
But even amid these numbers there were promising developments.
Perhaps most striking is the drop in drug overdoses in the state. Overdose rates dropped across all community types, with the steepest drops in rural and Native communities.
Those same communities reported significant declines in suicide rates, as well, with Native counties seeing the largest — a jaw-dropping 49% drop from the five-year average.
It is too early to tell if these mixed experiences during the pandemic will play out similarly nationwide, but in Montana, drug overdoses seemed to drop as the travel limits and lockdowns dragged on and many communities saw a drop in suicide, although there are some troubling exceptions to that trend.
A safety net tested
If there is positive news in the deaths of despair data during the pandemic, it was in the general drop in drug overdoses throughout the state and a targeted drop in suicide rates in large swaths of the rural parts of Montana.
The reasons behind these numbers are more hypotheses than direct evidence but experts point to important changes in healthcare and government policies that greatly improved access throughout rural Montana.
In 2015, the Republican legislature working with a Democratic governor hammered out a deal to expand Medicaid in the state. The program, which was renewed in 2019, offered coverage to at-times nearly 100,000 people in a state with a population just over a million.
For providers in rural and low-income communities this program stabilized care and kept small hospitals and clinics open.
One federally authorized clinic that offers care in Bozeman and more rural communities around it said that before the expansion 56-58% of patients they served were uninsured. That number is now 9-10%.
At the state’s largest healthcare policy nonprofit, Dr. Aaron Wernham said the system kicked in in two important ways in 2020. Ahead of the pandemic, Medicaid expansion enrollment had dwindled to about 80,000.
But then Covid hit.
“When the pandemic hit and people lost their jobs, the program functioned as it’s intended to, which is as a safety net,” Dr. Wernham said. “When something goes wrong in your life, so if you lose your job, you all of a sudden have no income. You’ve lost maybe employer-sponsored insurance. Medicaid picked up the pieces, so we have seen enrollment in the program go back up into the low to mid 90,000 range.”
In addition to the program being there for those with low incomes and for the nearly 17% of Montanans who applied for unemployment during the pandemic, the program also kept the lights on at hospitals.
“Every emergency room in the state, basically any nonprofit hospital, which accounts for almost all of our hospitals, is obligated to see everybody that walks in the door,” he said. “You know [the program] really helped keep hospitals afloat… You can’t check their insurance before you decide if you’re going to take care of their Covid.”
An unlikely hero: the government
With Medicaid offering emergency insurance for those buffeted by the pandemic and reliable payments to hospitals and clinics, the system could stay open, but healthcare providers who were seeing patients also realized that they needed to try to move as much care as possible to telehealth.
“When you talked about rural health everyone was like, ‘well, gosh, telehealth, that’s what you should do. Why are we not doing this’ and it just never took off,” said Scott Malloy, program director at the Montana Healthcare Foundation.
Both the foundation and care providers like Lander Cooney at the Bozeman-based Community Health Partnership clinic said for telehealth to be effective key rules had to change.
Then came what Cooney called “an incredible two weeks in March.”
The federal government made three emergency decisions that changed the face of telehealth, especially in rural states like Montana. First, government insurance programs said they would pay the same amount for telehealth visits as they would for in-person treatment.
But just as important, the government said they would allow patients to receive telehealth treatments in their home and the provider could also be in their home.
That is, before March 2020, telehealth was only covered if the patient came to a clinic. Then they could see a doctor who was in another clinic.
When the laws changed, state governments like Montana worked to quickly draft emergency rules to allow telehealth to move online.
Cooney noted that moving behavioral health to video conferencing or the telephone did two things, it enabled them to offer uninterrupted services to patients and allowed clinics to use the freed up office space to create a safer location for in-person medical care.
She said within a month, nearly 90% of all behavioral health visits were fully online or by phone. The comparison is striking. In 2019, Cooney’s clinics conducts about 100 visits for both medical and mental health visits. By the end of 2020 that number had jumped to more than 15,000.
The clinics are moving toward a return to in-person treatment that never fully went away, but for Community Health Partners, Cooney said, some things have changed.
“Like any business, we need to say, ‘Let’s not go back to the old ways of doing things just because we can. Let’s consider what has changed in the past year,” she said, adding part of that would be to find the “ideal applications of telehealth.”
Screening via screens
This shift to telehealth was happening at a time when the state has also been expanding what the Montana Healthcare Foundation calls behavioral health screening.
Dr. Wernham pointed to the fact that years ago screening blood pressure was not the norm and that lack of screening prompted a “catastrophe” in terms of cardiovascular disease and death.
“We think of drug use and alcohol as being the same thing. You can’t look at someone to know if they’re depressed. You can’t look at someone and know if they are suicidal. You can’t look at someone to know if they’re addicted,” Dr. Wernham said, adding, “so you need to screen for those things just the way we screen for blood pressure, and if you’re not doing that, you know you’re at risk of missing a lethal condition.”
Most of those clinics and hospitals accepting Medicaid and other insurance have expanded the use of behavioral screening to identify drug and alcohol issues as well as depression. The concept, called integrated behavioral health, adds these checks to normal medical visits, not just those seeking some type of mental health assistance.
“By expanding telehealth access, we were more able to reach people in crisis in rural areas, at the same time as having more practices in rural areas now engaged in screening everybody that comes in, through their doors … for depression,” Dr. Wernham said.
This combination of integrated behavioral screening and telehealth is not the sole reason for drops in drug overdoses or suicide rates going down in rural places, but they have clearly helped communities in Montana weather the pandemic. It’s important to note that these changes rely on emergency declarations from federal and state governments.
As the pandemic eases, questions remain about pay parity and telehealth. Communities in far-flung Montana may be deeply affected by the result of these conversations and the continued availability of safety nets like Medicaid when it comes up for renewal in 2025.
Associate Professor Lee Banville joined the University of Montana faculty in 2009 after 13 years at PBS NewsHour, where he was editor-in-chief of the Online NewsHour.
As Covid-19 vaccination rates rise, there is hope that the economic hardship that has hammered the country will wane. But a closer look at the pandemic’s impact on jobs, employers, and wages raises questions of what the recovery will look like in the 15 county types of the American Communities Project.
At the national level, most employers seemed to be keeping their doors open, but at greatly reduced staffing levels, according to September data from the federal government’s Quarterly Census of Employment and Wages. Those numbers showed job losses across the board. And within the ACP typology, some communities were hit hard, particularly the densely-packed Big City counties. Other communities, such as the Exurbs, were riding out the virus in better shape.
For this data analysis, the ACP partnered with the Economic Innovation Group to measure changes in jobs and employers as well as average wages from September 2019 to September 2020 in the 15 community types. The data show how varied the impacts are. In short, there is good reason for optimism about a recovery, but there is also reason for uncertainty as the post-COVID economy comes into focus.
Where Jobs Went Away
The pandemic’s biggest economic challenges came in lost jobs. That’s not a surprise to anyone who has followed economic news in the past year. The massive spike in unemployment last spring as the virus left employers and employees in a state of shock — even as the larger story over the summer was one of slow recovery.
But the data here, which again measure September to September changes, show how long-lasting and uneven those job loss impacts were.
Big Cities saw a nearly 10% drop in employment in September 2020 compared to September 2019. That’s a pretty massive shift considering it was months after the initial economic shutdown. And it suggests that even as the employment numbers got better nationally, Big Cities lagged behind.
Native American Lands did not fare much better, with a nearly 9% loss of jobs. Urban Suburbs saw the same drop. In Hispanic Centers and blue-collar Middle Suburbs, the job loss numbers were around 7%.
To be clear, measuring job losses is not the same thing as measuring unemployment. Unemployment measures people looking for a job who can’t find one. These numbers measure the number of people who were employed in 2019 and then in 2020. In some ways, that may be a more accurate accounting of what has been lost in the pandemic.
Driving most of these job losses was a big contraction in the leisure and hospitality sector. In 11 of the 15 ACP types, that sector led the way in job losses and often by a large margin. The exceptions were Working Class Country, where leisure and hospitality tied with manufacturing for job losses. Manufacturing was the leading cause of job losses in Evangelical Hubs. And loss in natural resources jobs was the biggest factor in Native American Lands and Aging Farmlands.
When Rising Wages Isn’t Good News
In most cases, the other big story in the data, rising wages, would be seen as good news, but not in the time of Covid-19.
In fact, the increase in wages that we see in the EIG analysis in this case, just drives home the point of lost jobs. Every one of the ACP’s 15 community types saw increases in wages, and some of the increases were massive.
However, consider where the biggest jumps were. There was a spike in Big Cities — an increase of more than 9%. And the Urban Suburbs are right there with them. Behind those big wage increases is likely the divergent socioeconomic conditions in those places.
For all the people working in office buildings in Big Cities and Urban Suburbs, there are the people who work in the service jobs nearby, the restaurants, cafes, and bars that serve them and make lower wages. And don’t forget the nearby hotels that catered to businesspeople traveling for work. In Big Cities and Urban Suburbs, the leisure and hospitality job losses were massive — reductions of more than 25% in each type.
Lots of employees in Big Cities and Urban Suburbs have been “working from home” for a year now, but those are largely the high-wage, college-educated workers for whom that is an option. Their lives are different, but they are still working. Around their pre-pandemic offices, where they used to go to work, the economic landscape has completely changed. Shifts and hours have been shortened. Staffs have shrunk.
So the average wage is up in those communities, but really only because most of the jobs that disappeared are low-wage jobs. This is true around the country, of course, but it is of special concern in Big Cities and Urban Suburbs, where socioeconomic divides are deeply baked into community life.
It’s worth noting that the Exurbs, which are generally farther from urban core areas, saw smaller drops in employment (about 5%) and smaller rises in wages (about 6%). Those communities are also full of high-wage, college-educated workers, but they also tend to have fewer service jobs. Exurbanites are less likely to live near their place of work and more likely to face long commutes (or they were before Covid).
What Happens Now?
There is some decidedly positive news in the data. In September, even after five months of the pandemic, the number of “business establishments” was up in every one of the ACP types. The increase was very small in Working Class Country, but in 11 of the 15 types the increase was at least 1%.
Considering what the nation was going through at that point, any positive number was a good sign. But the size of the increases in the nation’s most densely populated places was impressive. It was more than a 2% bump in Big Cities and Urban Suburbs. In Exurban communities, it was more than 3%.
In LDS Enclaves, the jump was big — more than 5%. And the increases in some rural communities were encouraging, particularly Graying America.
That kind of consistency is not common in the ACP types, where the socioeconomic climates and populations are so different. These numbers suggest a relatively quick economic turnaround is possible across the country. As of September, many employers had made it through the rough early days of the pandemic and were just waiting to hire again.
But a big question hangs over that positive reading of the numbers: What exactly will the new economy look like as vaccination rates rise and people begin going back to work and school?
Particularly in urban environments, such as the Big City counties, there are questions of how much and how quickly things will go back to pre-pandemic norms. Will workers opt to work from home more? Will their employers let them?
If quarter of the workforce in a major city works from home half the week, what does that mean for staffing at the businesses that served them?
“It does seem like the hole in big cities is so deep and the pace of recovery/return-to-normal slow enough that there will inevitably be a long hangover,” says Kenan Fikri, EIG’s director of research. “The real elastic bounceback was from April to July; now we’re in a long, gradual haul. Many employer-employee relationships in hard hit urban services sectors have been severed; jobs will be harder to restore now that workers are off payroll. And employers may try to run lean for a while to recover their balance sheets too.”
And the recovery in the Big Cities is unlikely to be the same all over. Las Vegas, built on tourism, may come back when most of the population has shots in their arms and begins to travel more. Cities like Detroit, which were economically struggling and not particularly resilient before the pandemic, may see the COVID impacts linger.
Overall, the data suggest that the economy is in better shape than might have been expected in all 15 community types of the ACP, and most places do seem primed for a bounce back. But, even as Covid is being tamed, finding a new economic normal will likely take time.
The Covid-19 pandemic has torn through the United States in the last 12 months, leaving more than half a million dead and the nation’s economy in tatters, but the virus didn’t arrive on a blank slate. Long before Covid, the Deaths of Despair epidemic was already taking a massive toll in communities of different kinds across the country.
Over the past year, the intersection of those two challenges has created a complicated mix of impacts across county types in the American Communities Project. Some places hit hard by Deaths of Despair seem better equipped to handle the challenges of Covid. Other places that have not seen so many Deaths of Despair have seen higher death rates from the virus.
But in a larger sense, the mortality data for the two national epidemics show how local economic and cultural factors play large roles in communities’ overall health.
A year in, the Covid-19 pandemic is ongoing and still relatively new, and gathering data on the virus is not easy. Numbers usually lag real time. That’s also true for the data on Deaths of Despair, which come from national analyses of death certificate data to determine causes of death. But comparing what we know about the geographic footprints of both diseases to the ACP 15 county types, four major points emerge in the data.
There is a collection of communities with low Deaths of Despair rates, but high Covid-19 death rates. And those communities are among the more rural places in the ACP: Aging Farmlands, Hispanic Centers, and the African American South.
Some types of communities have lower death rates for both epidemics. Those types, the Exurbs and Urban Suburbs, have built in economic advantages that seem to insulate them from both challenges.
There seem to be advantages in communities built around youth and structure, enabling them to withstand Covid. Military Posts, College Towns, and LDS Enclaves are among the lowest on Covid death list even though they largely sit in the middle of the pack on the Deaths of Despair list.
Many reasons drive those differences. As the ACP often notes, communities are more than just a collection of people. They take the characteristics of the people who live in them. Some are wealthy and some are not. Some are more religious than others. Some are full of people who can transport their work to a home office; some rely on having workplaces where people can punch the clock. Those cultural factors, along with general race and age demographics, are fundamental to understanding their Deaths of Despair and Covid numbers.
The Big Picture in the Data
To analyze the impacts of Covid and Deaths of Despair, we measured the mortality rate for each. While the number of “cases” matters for Covid, Deaths of Despair is ultimately a measure of mortality, so we chose that measure for Covid as well. And when you look at heat maps and charts for each, clear patterns emerge.
Deaths of Despair (DoD) v. Covid-19 Death Rates
To the north, counties in New Hampshire, Vermont, and upstate New York contain a collection of counties where Deaths of Despair are high while Covid death numbers are lower. Many of these communities are part of Graying America, where this pattern is common. Graying America counties rank second in Deaths of Despair, but 11th for Covid deaths.
Across the Southeast, particularly in the African American South, you can see the counties with fewer Deaths of Despair, but more deaths from Covid. In Appalachia — West Virginia, southern Ohio, and eastern Kentucky — the counties of Working Class Country show Deaths of Despair that are much higher than average and Covid deaths that are lower than average.
And throughout the Mountain West, Native American Land communities stand out for spiking on both measures.
The chart below translates those maps into rates by ACP type. On it, you can see the key findings of this report in a graphic form, the places that struggle and those that do well on each data point. (Note that on the map there are many small-population counties where we could not plot Deaths of Despair due to privacy concerns. However, the chart below contains the rates for all deaths in all communities, even those we cannot map.)
Where Deaths of Despair and Covid Have an Inverse Relationship
One of the most surprising findings when comparing Deaths of Despair and Covid data comes when focusing on three diverse county types with small median populations: Aging Farmlands, the African American South, and Hispanic Centers. All are in the bottom third for Deaths of Despair, but they are very high for Covid, Nos. 2, 3, and 4, respectively.
The median populations for all three county types are under 20,000. It’s 17,700 in Hispanic Centers, 15,300 in the African American South, and just 2,800 in Aging Farmlands. Their small sizes would seem to correlate with higher rates of Deaths of Despair, which can be driven by loneliness. On the other hand, this shared characteristic could help combat Covid-19, because rural, sparsely-populated communities seem to have an advantage for social distancing.
But the figures show opposite correlations. These community types do better than would be expected with Deaths of Despair and worse than might be expected on Covid. Why? One possible factor: Community ties that help prevent Deaths of Despair may contribute to higher Covid mortality.
These communities have additional factors that lead to enhanced cohesiveness. In Hispanic Centers, a common ethnicity among a large part of the population helps build bonds. In the African American South, there can often be sharp racial divides between Blacks and whites, but also a support network among Black friends and neighbors. Aging Farmlands, while rural and remote, often have strong individual identities.
Beyond those factors, religious adherence may play a big role in these three kinds of communities. All are among the top five community types in adherents per 1,000 population — more than 50% of people in each community type are active members of a religious congregation, according to the Association of Religion Data Archive.
There are additional factors in these communities, of course, particularly the LDS Enclaves, which are discussed later in this report. But higher levels of religious adherence is an important element in these places.
Not only do churches create social connections in communities, but they also give congregants a larger sense of meaning in life. That can be a powerful one-two punch that offers purpose and belonging. Those thoughts and connections can be a bulwark against Deaths of Despair. Higher rates of religious adherence often signal deeper and broader community connections. For example, a group of people know each other in multiple ways, from the neighborhood and from the pews.
Those tight bonds can pose a problem during Covid. Throughout 2020, funerals turned out to be super-spreader events, and that took a large toll on communities with deeper religious connections. In the virus’s early days, two funerals in Albany, Georgia, in the African American South, turned the town into a “hotspot” in part because many friends, neighbors, and fellow congregants gathered to say goodbye. The stories were similar around the country, particularly in rural, close-knit communities.
To be clear, these communities are home to other health dynamics that push up their Covid numbers: large elderly populations (Aging Farmlands), high diabetes rates (the African American South), and high uninsured rates (Hispanic Centers). But the combination of health and social factors is likely behind the inverse correlations between Deaths of Despair and Covid mortality.
Places that Hold Distinct Advantages
While some communities stand on opposite ends of the most dire consequences of Deaths of Despair and Covid, a few sit on the low end of both epidemics. Urban Suburbs and Exurbs hold socioeconomic advantages over most of the other community types on a broad list of measures, and those advantages extend to both epidemics. The two community types fall in the bottom half for deaths from Covid and the bottom third for Deaths of Despair.
Two advantages of the Urban Suburbs and Exurbs: health insurance numbers (they have low uninsured rates for adults) and median household income (they rank first and second in the ACP). Both suburban community types have larger numbers of people with college degrees and lower unemployment rates than other types.
Where Deaths of Despair are concerned, those kinds of numbers suggest some insulation from the worst outcomes. While they don’t address deeper community ties, friendship, or loneliness, they at least suggest communities where people are economically comfortable, with resources and opportunities.
However, the Urban Suburbs and Exurbs are two of the ACP’s more populous community types. Along with Big Cities and Middle Suburbs, they are the only community types where the median populations are above 100,000. And that kind of population density would seem to be a negative during the Covid-19 pandemic. So why are their figures so low? They are full of people who had jobs that could be made into “remote work.”
A lot of jobs moved into home offices (or kitchens or living rooms) during Covid, but the greatest number of shifts happened in the nation’s most populous counties. On the whole, 31% of American adults, some 77 million people, had their jobs shift to working from home in 2020 due to Covid, according to data from MRI-Simmons, a consumer research firm. But three-quarters of those job shifts, encompassing 59 million people, happened in the nation’s largest counties. The work-from-home numbers got smaller as the counties got more rural.
Those counties, “A and B Counties” in the demographic breakdown, hold the majority of the Urban Suburbs and Exurbs. And when you consider the higher incomes and education levels in both community types, you can see how they were especially protected from the worst parts of the Covid-19 pandemic: fewer interactions in closed spaces with non-family members. And as business travel was pared back, they were spared from exposure they might have had in airports or on planes.
In short, happiness and well-being aren’t all about economic prosperity, but there are people and communities that hold advantages in 21st-century America. The Urban Suburbs and Exurbs have some economic and social factors in their favor that protect against a range of challenges, including Deaths of Despair and Covid.
The Power of Youth and Organization
Three ACP types stand out for having low rates of Covid deaths, ranking in the bottom third, but sitting largely the middle of the pack for Deaths of Despair. College Towns, LDS Enclaves, and Military Posts are an odd mix in some ways. LDS Enclaves have the highest percentage of religious adherents in the ACP, while College Towns and Military Posts are near the bottom. College Towns lean left politically, while the other communities are quite conservative. Military Posts often feature bases where groups of people work in close quarters, while LDS Enclaves are usually rural.
But there are two larger organizing principles for all three types.
First, all these communities have an advantage during the Covid pandemic because of their relative youth. They have the largest percentage of population in the 18- to 24-year-old range. The three are among the top four ACP types for population in 18- to 39-year-old range. (The other is Hispanic Centers.)
Advanced age is one of the biggest comorbidity factors for Covid, and these three community types have larger, younger, and more vital populations than most others. More than 7% of College Towns are 18 to 39. This youth cohort makes up 6.7% in the LDS Enclaves and 6.4% in the Military Posts. That means even if there is more virus spread — which we have seen in the LDS communities and in some College Towns — the impacts are often not severe because the population is less susceptible.
But that doesn’t explain all the differences for these communities. Their Covid death rates are much lower than the nation as a whole — less than 120 per 100,000 people. Other community types that also hold larger shares of young people have much higher Covid death rates. More than 6% of the population in Big Cities and Hispanic Centers fall into the 18-to-39 age group, and their Covid death rates are 165 and 197 per 100,000, respectively.
What other factors might be in play?
A second commonality of these community types: All are tied to a larger community structure that helps organize them. LDS Enclaves are usually deeply connected to the Mormon Church. In many of these communities, the secular leadership is full of church members, which creates a deeper sense of working together. College Towns are often strongly tied to an institution of higher learning — not just students, but professors and other employees as well. This helps create more of a shared purpose or identity. And, of course, Military Posts are not only full of soldiers, but often veterans and contractors who are part of a larger connected atmosphere.
It may be that those kinds of bonds help foster a mission to “work together” to get control of the Covid pandemic. Mitigation approaches like mask mandates might be more easily accepted in communities where people are all on the same page. Leadership matters in any pandemic, but it helps to have populations that are prepared to follow. The structure baked into these communities may make an important difference.
A Double Hit in Native American Lands
A particularly sobering finding in the ACP’s analysis: the deep challenges in the counties we call Native American Lands. As we noted in our first report, those 43 counties experience Deaths of Despair at a rate of more than twice the national average, at 101 per 100,000 population. Last fall, veteran journalist Ray Suarez visited Montana and wrote about what’s happening there.
And the Covid pandemic, which seemed to hit some communities in very different ways than Deaths of Despair, did not have that inverse impact in these parts. Native American Lands saw the worst impacts of both epidemics, ranking No. 1 for both. And, as it was with Deaths of Despair, the figures for Covid deaths stood out for being high above other groups. The Native American Lands were the only community type with a Covid death rate of higher than 300 per 100,000 population.
The Native American Lands did have a few advantages where Covid was concerned. These communities tend to be sparsely populated, which allows for easier social distancing, and they often hold a deep community identity. But a wide range of issues serve as a strong negative counterbalance. If Urban Suburbs and Exurbs offer evidence that socioeconomic advantage can lead to health advantages, the Native American Lands show the opposite is true as well.
Native American Lands scored highest in the ACP types in obesity and smoking rates. They scored in the top two community types in percentage in poor health, uninsured adults, severe housing problems and food insecurity, according to the County Health Rankings. They are among the lowest in median household income and flu vaccination rates.
Many tribal communities understood the dangers of Covid early. Some closed their borders to try to keep out visitors who might more easily spread the virus in what proved to be a more susceptible population. Yet the numbers for Covid deaths stand far above other community types in the ACP, at 318 per 100,000 people.
In some ways the story of Covid-19 in Native American Lands is evidence that strong will and good community effort can only go so far. At some point, the lack of access to the “social determinants of health” is too much to overcome without additional help.
To be clear, this analysis is not exhaustive. Some additional points to note: The Evangelical Hubs are ranked relatively high for Deaths of Despair and Covid mortality. And the communities of Rural Middle America sit in the middle for each. Many socioeconomic and geographic factors play roles in those rankings. Furthermore, there are deeper analyses of Deaths of Despair that will only be possible when those data become available. (It will take years for the county numbers to be released at a national level.)
In the meantime, the ACP will publish a second exploration of this topic, looking at one of our target states, Montana. Working with the state government there, we have obtained detailed data about deaths in the past year — as the two epidemics have been raging simultaneously. We will release that analysis in the coming days.
“Last year was a watershed year in terms of climate concern among the public,” shared Jennifer Marlon, research scientist and lecturer with the Yale Program on Climate Change Communication and the Yale School of the Environment, in a recent Q&A with the American Communities Project.
Since 2008, researchers at Yale and George Mason Universities have been conducting nationally representative surveys as part of the Climate Change in the American Mind (CCAM) project. The surveys are conducted twice each year to investigate public climate change beliefs, risk perceptions, policy support, behaviors, and the underlying psychological, cultural, and political factors that influence them.
Marlon, who we interviewed for our 2018 piece “Where American Communities Agree and Disagree on Climate Change,” helps us understand how Americans of different demographic, geographic, and political backgrounds think about climate change and what’s behind the twists and turns in attitudes since the Great Recession in 2008.
Ari Pinkus: Could you describe how Americans’ views on climate change have evolved over time?
Jennifer Marlon: Belief in and concern about climate change is higher now than it has ever been for Americans as a whole. Yet, the path getting here has not just been a steady rise over time. Twelve years ago, in fact, Americans overall were just slightly less concerned about climate change than they are today. In 2008, 62% said that they were somewhat or very worried about the issue, whereas in 2020, 66% said that. Given that the survey margin of error is three percentage points, that is not much movement. But that slight difference masks a large decline in beliefs, risk perceptions, and policy support that occurred between 2008 and 2010.
Since 2010, beliefs that global warming is happening, human-caused, and that scientists agree about these facts have been steadily rising, as have several measures of concern. Support for climate policies continued to decline after 2008 until 2013, but these, too, have subsequently increased since then.
The increase in concern about climate change since 2010 has been much steadier among Democrats, and it has been greatest among moderate/conservative Democrats. Among registered voters who are moderate/conservative Democrats, for example, worry increased by 23 percentage points (from 63% to 86% between 2010 and 2020), whereas it increased 10 percentage points among liberal Democrats during that same period.
Independents and Republicans have also become more likely to think that global warming is happening and human caused in the past decade, and also that scientists agree. Belief in the scientific consensus increased 12 percentage points from 19% in 2010 to 30% in 2020, for example. Gains in concern and policy support have been more modest among Republicans, however, and in one case — funding research for renewable energy — support has declined among conservative Republicans.
Pinkus: What is driving these attitude views?
Marlon: The remarkable decline in beliefs, risk perceptions, and policy support that occurred between 2008 and 2010 was coincident with the Great Recession. One hypothesis is that individuals have a “limited pool of worry” and so short-term economic concerns took precedence over longer-term environmental concerns during those years. This idea is plausible given that beliefs, risk perceptions, and policy support all declined and that these declines were evident across the political spectrum.
Careful research by Matto Mildenberger at University of California, Santa Barbara and colleagues, however, shows that individual opinions did not vary in places where job growth, housing prices, and other losses were most severe. Changes in political leadership and messaging may have therefore contributed more to that decline than individual economic fortunes. The role of media effects (e.g., overall proportion of issue coverage) and vicarious experience, however, probably warrant further examination.
The subsequent increase in Americans’ understanding of the nature, cause, and scientific consensus on climate change, as well as the increase in perceived harm to future generations, developing countries, the U.S., and more has undoubtedly been caused by a variety of factors working synergistically. The mobilization of climate advocates; an increasing number of political, community, and other leaders speaking out about climate; and the steady drumbeat of unusually severe weather events have all likely reinforced one another.
As a result, more Americans than ever are now convinced that the Earth is warming; that human activities are responsible; and that the consequences are dangerous not only to the environment, but also to human health, economies, national security, and more. More Americans than ever also now understand that a variety of solutions exist, and Democrats increasingly support policy interventions to reduce carbon emissions.
Pinkus: Was 2020 a watershed year? If so, how?
Marlon: Last year was a watershed year in terms of climate concern among the public. One of the ways we track public opinion about climate is through our “Six Americas” audience segmentation. The segments represent the full spectrum of views about climate change.
The Alarmed are convinced global warming is happening, human-caused, an urgent threat, and strongly support climate policies.
The Concerned also think human-caused global warming is happening, a serious threat, and support climate policies, but they tend to believe that climate impacts are still distant in time and space.
The Cautious haven’t yet made up their minds about whether global warming happening or not, what is causing it, and how serious it is.
The Disengaged know little about global warming as they rarely or never hear about it.
The Doubtful do not think global warming is happening or believe it is just a natural cycle and not a serious risk.
And lastly, the Dismissive believe global warming is not happening, human-caused, or a threat, and most endorse conspiracy theories (e.g., “global warming is a hoax”).
Looking back over the past five years, we find that the Alarmed group has increased from 11% to 26% — the largest increase in any of the segments. The Dismissive, in contrast, shrank from 12% to only 7%. The Dismissive and Doubtful are overrepresented in Congress, however, and have more vocal proponents than do the Disengaged or Cautious. As a result, many Americans overestimate the sizes of these population segments and underestimate how many people actually worry about climate change and want to transition more quickly away from fossil fuels and toward renewables as our primary energy sources.
Pinkus: What are the regional differences in the ways people view and talk about climate change?
Marlon: People’s views about climate vary from state to state, and many differences reflect political patterns that we’re familiar with. For example, Americans in blue states, often along the coasts, tend to show greater concern for climate change than those in red states, often in the Midwest and South, for example.
There are some surprises, however. People of color are generally more concerned than Whites about climate change, for example, and Hispanics/Latinos, in particular, tend to be the most concerned. As a result, places with large non-White populations, such as southern Texas, in the Black Belt of the southeastern U.S., and on tribal lands show higher-than-average belief in global warming, concern about its impacts, and support for policy.
Perhaps surprisingly, however, majorities of Americans in every state think citizens and corporations should do more to address global warming. And majorities in all but three states (Wyoming, North Dakota, and West Virginia) think Congress should do more to address global warming as well.
Pinkus: How could policymakers and community leaders leverage these mindset shifts to strengthen their communities?
Marlon: Given that so many Americans underestimate how many people actually worry about climate change and want different stakeholders to take more action, policymakers and community leaders should be working to bridge this gap in awareness.
Social norms are a powerful influence on individual’s attitudes and behaviors, so providing information about the growing strength of the social and scientific consensus that global warming is happening and is already having serious consequences can help promote dialogue about which solutions we can and should pursue, whether as individuals, communities, or as a nation.
Recent research also suggests that lasting engagement with climate change is more likely to arise from:
deeper discussion with one’s family, friends, and colleagues;
greater understanding of the problem, its impacts, and solutions, which can motivate action; and
reinforcement of the changing social and cultural norms toward greater acceptance of the problem and engagement in solutions to it.
These findings point toward the importance of not only policymakers and community leaders in driving behavioral change, but also individuals and decision-makers in all domains, from the public and private sectors, and at all levels of society.
One of the primary reasons that we’ve seen such strong growth in concern during the past five to ten years is that the voices talking about and engaging with the issue have become much more diverse. There is great strength in this diversity, and we need to continue expanding our conversations and efforts to bring more communities into the fold.
As many leaders have noted, climate change doesn’t care whether you are a Republican or a Democrat, or whether you live on a coast or inland, in the mountains or on the plains; it is affecting us all, and we all have a role to play in reducing the impacts occurring today and in the future.
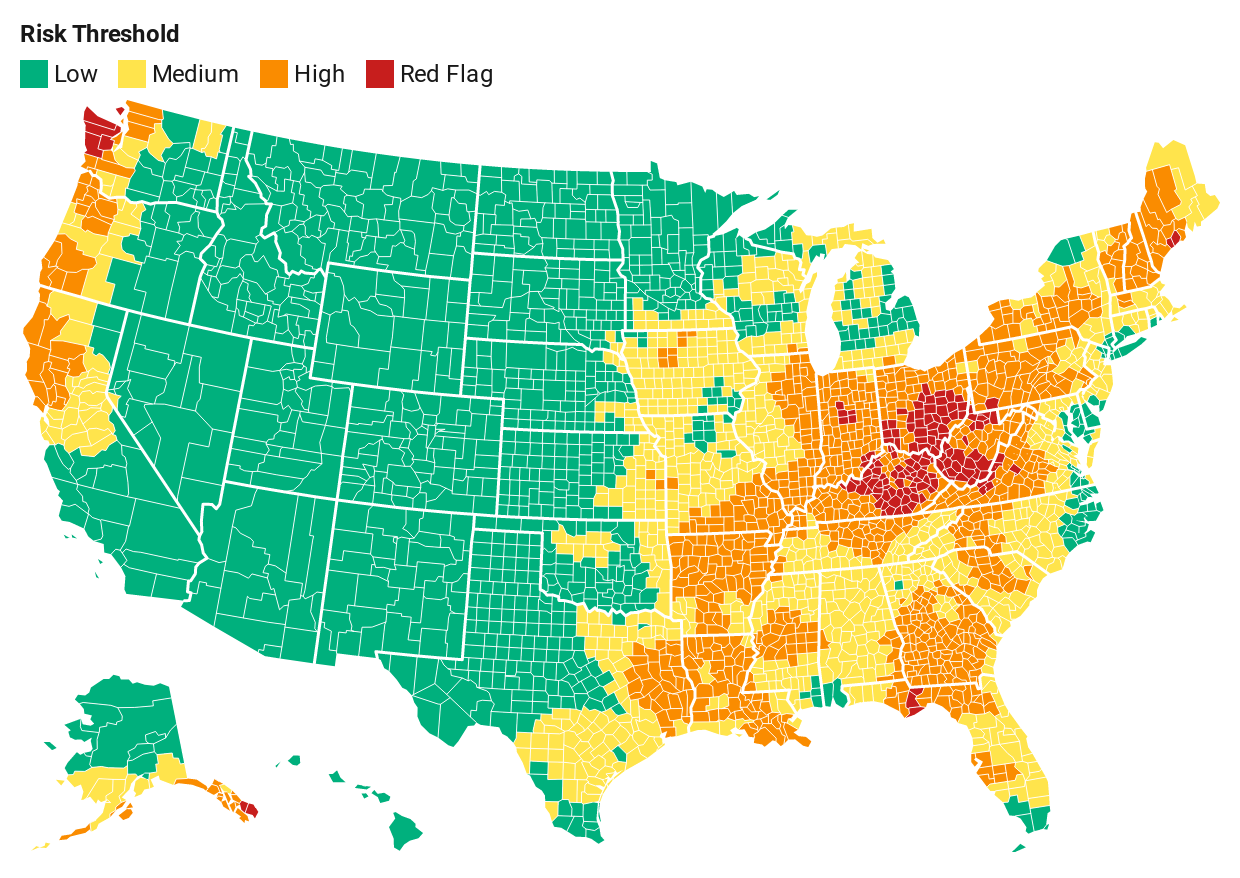
With the Biden administration elevating climate change concerns to the national agenda, the American Communities Project leveraged data from Four Twenty Seven, a physical climate risk data firm and affiliate of Moody’s, to understand how the risks manifest by ACP type — and where populations and infrastructure may be especially vulnerable.
Four Twenty Seven analyzes several physical risks to the U.S. landscape, including sea level rise; hurricanes; extreme rainfall; water stress; and heat stress, characterized by higher temperatures. Many of Four Twenty Seven’s projections through 2040 show the risks are regional, as illustrated in maps below. We also parse the degree to which high risks differ by ACP type. Six key takeaways emerge from filtering:
Sea level rise stands out as a climate hazard in Military Posts, based on the percentage of these counties affected compared with the ACP’s 14 other community types.
The threat of hurricanes hangs over a clear majority of African American South counties, where the populations tend to have lower incomes and less higher education experience. No other community type reaches the 50% threshold, though Military Posts come close.
Extreme rainfall is also expected in a majority of counties in the African American South as well as mostly-white Working Class County and blue-collar Middle Suburbs. When it comes to the African American South’s two big climate risks, many Black homeowners and renters, in particular, live in low-lying areas and lack flood insurance, making them more vulnerable. In Middle Suburbs, where the manufacturing sector has been hit hard by globalization these past 30 years, intense floods could pose additional economic harm, negatively impacting industry and transportation into the future.
More than three-quarters of two rural community types with young populations — Hispanic Centers and LDS Enclaves — expect to experience significant drought conditions in the coming years. This may be especially harmful in Hispanic Centers, where agriculture is a key industry and heavily dependent on water availability.
Heat stress is forecast in a majority of Evangelical Hubs, i.e. lower-income, less educated, and less diverse communities with a large number of Evangelical adherents, located in the Midwest and South. That education and income are the strongest socioeconomic drivers of health effects from heat may make Evangelical communities more sensitive to absorbing these perils.
Among the 47 Big City counties, all five physical risks are notable, with hurricanes, water stress, and heat stress the most prevalent by percentage. For these stratified, diverse communities, populations are likely to be unevenly affected by the hazards.
Where East Meets West: Rising Seas
It’s unsurprising that sea level rise presents the greatest threat to populations living along the U.S. coastline — most of the country’s geography is in no danger of rising seas. There are several zones to watch. The mid-Atlantic region into the upper South — from New Jersey to North Carolina — contains a dozen counties deemed red flag for their significant exposure of coastal flooding. These counties have a combined population of 863,519, based on U.S. Census estimates in 2019. South Florida and counties in Louisiana, Mississippi, and Texas ringing the Gulf of Mexico are red flag or high risk. A few patches of the Alaskan coastline, too, are in the red flag zone. The Pacific Northwest holds about a dozen counties with a high risk of sea level rise. (Scroll over the map to see a county’s risk level and community type designation.)
As mentioned above, rising sea levels are a great danger in Military Posts. Of the 89 counties, 19% are dubbed red flag or high risk. According to a Union of Concerned Scientists’ report in 2016, “The military is at risk of losing land where vital infrastructure, training and testing grounds, and housing for thousands of its personnel currently exist.” This could have a real impact on military readiness by reducing operational capacity.
Communities of color and diverse, densely populated places are also in the line of danger. For the 43 Native American Lands, the 370 African American South counties, and the 47 Big Cities, the numbers are 14%, 13%, and 13%, respectively. Many non-white households living near the coasts, particularly in the African American South and Big Cities, haven’t received sufficient flood investment protection and don’t have flood insurance. Four Twenty Seven explored the link between race and climate change in a piece in July 2020. Meanwhile, 12% of Urban Suburban counties face red flag or high risk.
The Dividing Line for Hurricanes
More of the U.S. population faces the danger of hurricanes. Consider that the entire coastlines of the Carolinas, much of Florida as well as the Louisiana and Alabama coastlines are deemed red flags. Beyond those red zones, the risk is high in all the states along the eastern seaboard and the Gulf of Mexico. Hurricanes are low or no risk moving westward. (Scroll over the map to see a county’s risk level and community type designation.)
As we’ve seen in recent years, hurricanes can wreak havoc on the regional infrastructure, impeding a community’s recovery. In the article “The Effects of Infrastructure Service Disruptions and Socio-Economic Vulnerability on Hurricane Recovery,” the author-researchers surveyed nearly 1,000 households in Florida after Hurricane Irma and found “that physical damage to property, disruption of infrastructure services such as loss of electric power and cell phone/internet services and other factors (i.e., homeowner’s or renter’s insurance coverage, receiving disaster assistance and loss of income) are significant predictors of post-disaster recovery when controlling for age and race/ethnicity.”
Drilling down, hurricanes are of the greatest risk in many densely populated and diverse places. In this rich mosaic, the standout is the African American South, with 64% of counties at red flag or high risk, and where populations are vulnerable because of housing conditions. Two other community types see close to half of their counties in the danger zone: 48% of Military Posts and 45% of Urban Suburbs face red flag or high risk of hurricanes. The same is true of more than a quarter of Big Cities.
Appalachia’s Ground Zero for Extreme Rainfall
For extreme rainfall, the risk picture looks markedly different, covering more of America’s interior. The Midwest’s Ohio, Appalachia’s West Virginia and Kentucky, and Washington State’s coastline are dubbed red flag. But high risk fans out across the Midwest as well as the South, Northeast, and Pacific Northwest. In March 2020, severe weather in the Midwest and Ohio Valley, including Missouri, Ohio, Kentucky, Tennessee, West Virginia, and Pennsylvania, caused $2.6 billion in damage, according to NOAA estimates. (Scroll over the map to see a county’s risk level and community type designation.)
More intense patterns of extreme rainfall are expected to hit the Middle Suburbs particularly hard, as 62% of these 77 average-income, mostly white counties face red flag or high risk. Meanwhile, 58% of the 337 counties of Working Class Country, known for mostly white populations without much higher education, are red flag or high risk. The African American South is not far behind, with 56% of counties deemed red flag or high risk.
Drought Conditions Most Everywhere
Water stress risk covers much of America’s interior, many sparsely populated places that make up the country’s breadbasket as well as swaths of more densely populated ones, including along the East Coast. Red flags show up in many regions: a small pocket of the Midwest, chunks of the Plains, including the Ogallala Aquifer, the intermountain West, the Southwest, as well as sizable portions of California, including the Central Valley. The Department of Homeland Security reports that “water and wastewater systems, energy, and food and agriculture are the critical infrastructure sectors most vulnerable to drought conditions.” (Scroll over the map to see a county’s risk level and community type designation.)
Community types known for having younger populations are poised to experience much water stress. Of the 161 agriculture-dependent, lower-income Hispanic Centers, 85% face drought-like conditions that are considered red flag or high risk. The pattern is similar for nearly all 41 of the rural, middle-income LDS Enclaves. Of the Big City counties, 62% expect to contend with water stress deemed red flag or high. Of the 154 College Town counties, 38% are in the red flag or high risk categories.
The Midwest — Hot, Hot, Hot
More and intense hot days are red flag risks in almost all of Missouri, much of Illinois, southwestern Iowa, and a touch of Arkansas. However, most of the Midwest is in the heat zone. Risk is high for nearly half of Ohio, all of Indiana and Oklahoma, part of Wisconsin, most of Iowa, Nebraska, Kansas, Kentucky, Tennessee, and the tip of Texas. Note that humidity, an important heat stress factor for assessing heat-related health risks, is not included in Four Twenty Seven’s analysis.
Then, perhaps not surprising, the southern part of Arizona, part of the Deep South, Florida, and Hawaii are at high or red flag risk for extreme heat. (Scroll over the map to see a county’s risk level and community type designation.)
Increasing temperatures have the potential to gravely impact public health. Affected communities are home to many lower-income families that often cannot afford air-conditioning, work outdoors for a living, and/or live in difficult housing conditions. Four Twenty Seven’s white paper “Heat and Social Inequity in the United States” examines heat vulnerability in detail.
Heat waves can also take a toll on physical infrastructure, particularly in cities, and the EPA recommends protecting roads and bridges with materials that can withstand heat as well as bolstering energy efficiency to avoid power problems. Arizona, for its part, maintains a detailed extreme heat response plan.
In the Midwest and South, Evangelical Hubs are expected to bear the brunt of the heat, with 65% of its 372 counties falling into the red flag or high risk categories. Working Class Country stands at 51%, while 50% of Rural Middle America’s 599 counties, running across the country’s northern half, are deemed red flag or high risk. This has the potential to affect labor productivity because many jobs in these parts are performed outside or near machines radiating heat.
A variety of diverse and more homogeneous suburbs should expect challenges here as well, including 34% of the 77 Middle Suburbs, 32% of the 222 Exurbs, 32% of the 47 Big City counties (which often include suburbs), and 22% of the 106 Urban Suburbs.
Climate Change in Focus
The Biden administration is taking these physical risks to the U.S. seriously based on its early actions, budget, and personnel. On Inauguration Day, President Biden signed several executive orders on climate, including recommitting the U.S. to the Paris climate accord to reduce greenhouse gas emissions and adapt to the effects of climate change. Moreover, Special Presidential Envoy for Climate John Kerry and White House National Climate Advisor Gina McCarthy are putting job creation at the center of the climate agenda and taking a more focused approach to tackling environmental inequities. The administration is also raising up the issue globally, hosting a climate summit of world leaders on April 22, the 51st Earth Day.
As the Covid-19 pandemic has spread across the country, its impacts on the county types of the American Communities Project have changed. The urban places that were once the biggest hot spots are not anymore. Instead, a selection of rural communities has come to dominate the “cases per 1,000 population” breakdown.
Using that measurement, the communities that have seen the highest numbers of Covid cases so far are the Native American Lands, LDS Enclaves, and Aging Farmlands. All are currently higher than 100 cases per 1,000 people, meaning they have infection rates above 10%. Nationally, the figure sits at about 78 cases per 1,000 Americans.
Those three community types hold very different kinds of populations in terms of age and race, but they share one common factor: They tend to be fairly sparsely populated. At the outset of the pandemic, that spread of population was seen as an advantage with a virus that spreads through close contact between people. Now that we’ve passed the one-year anniversary of Covid-19, the data suggest that initial theory didn’t account for many other important factors.
These numbers suggest that differences in community attitudes on issues such as masking, gatherings and, in a broader sense, politics (since Covid-19 has become politicized) likely have bigger impacts than sheer density.
The Data
The ACP compared county-level data on the total number of cases up to May 6, 2020 (the first peak of the pandemic) to county-level data on the total cases up to January 30, 2021 — and the changes are dramatic.
Back in May, Urban Suburbs had the highest number of reported cases per 1,000 population at 6.3 cases per 1,000 people. Behind these suburban communities were Big Cities and Native American Lands, both at 5.1 cases per 1,000 people. No other community was even at 4 cases per 1,000.
The most remarkable thing about the data from January 30, 2021, is the sheer increase in cases. The national figures climbed from 3.7 per 1,000 people to more than 77 per 1,000 people. The number of cases in that time went from 1.2 million to more than 25 million.
But the differences in the relative caseloads stand out. Urban Suburbs now sit below the national average. At the same time, Native American Lands now stand far above the other types with a total of 120.8 cases per 1,000 people.
But the increases in LDS Enclaves, Aging Farmlands, Hispanic Centers, Evangelical Hubs, and Rural Middle America are especially pronounced. All had fewer than 2 cases per 1,000 people in May, below the national average. And all now stand at essentially 80 cases per 1,000 people or higher, above the national figure.
Messages in the Numbers
What’s driving those changes and differences in the numbers is hard to pin down with more research or reporting visits (which have become difficult during the pandemic), but what the ACP knows from contacts in those communities offers some possibilities.
The struggle with Covid in Native American Lands has been a continuing story throughout the pandemic, going back to last spring and summer, when some tribal lands closed themselves off from visitors. Those counties had high death rates early in the pandemic and tend to have above average numbers for diabetes, a disease that can increase the severity of the virus. The January data shows that cases are still very high in those places.
The high numbers in Aging Farmlands are more surprising. Many of those counties are very small, holding just a few thousand people, which would seem to lessen the likelihood of transmission. But reports the ACP has gathered from Aging Farmland communities suggest that masking warnings are not always being heeded. For example, in Gove County, Kansas, Ericka Nicholson, Economic Development Director and president of the local volunteer ambulance service, has written about the friction in her community for the ACP.
Driving the higher-than-expected jumps in the LDS Enclaves and Evangelical Hubs may be a drive to attend religious services in person. Those communities tend to hold large number of religious adherents who attend church regularly. Church attendance is an important part of life here. An October survey from Lifeway Research, an evangelical research firm, found that evangelical ministers were less likely than others to say they have not held services in person.
It should also be noted that Aging Farmlands, LDS Enclaves, and Evangelical Hubs all voted heavily for Donald Trump, who had questioned mask mandates, in November.
While the spike between May and January hit everywhere, some communities showed a relative improvement in their infection rates.
Urban Suburbs and Exurbs, which are both among the best educated and wealthiest types in the ACP, are both below the national average for infections, even though they are fairly densely populated. Those are also communities with very high health insurance coverage rates and large numbers of workers who are probably able to transfer their work to home. They hold a lot of advantages in the pandemic.
College Towns were singled out in the fall for having high infection rates as students came back to campus and did what students tend to do, socialize. But the January numbers show rates in those communities are lower than most. That’s despite the fact that Covid testing is a part of the regimen on many campuses, which means cases are probably being caught. It suggests that there has been some success in virus containment measures, perhaps because of pushes from college administrations for students to mask up.
The low infection numbers in Military Posts are also worth noting. Many of those counties are fairly rural, but the bases on them can be very densely populated and personal interactions are an important part of everyday life. And yet, at 68.1 infections per 1,000 people, these communities are doing better than almost every other in the ACP. The numbers suggest that discipline and following orders, two things Military Posts do well, can make a big difference with the virus.
The extremely low numbers for the virus (relatively speaking) in Graying America, will need more study, but behind them could be caution from older populations combined with the fact that many of these communities are vacation areas. The pandemic has lessened some of that travel.
This is just a first look at these changes in Covid infection rates. In the coming weeks, the ACP will be reaching out to people in communities around the country to see how these numbers match the reality they see on the ground.
If someone wanted to design a place where the underlying causes of the nation’s Deaths of Despair epidemic were built into culture and geography, it might look a lot like Montana. The state’s staggering beauty contrasts sharply with the many challenges it faces around suicide, alcoholism and drug use.
In the U.S., people are more likely to die by their own hand in sparsely populated areas, and Montana has one of the lowest population densities of the 50 states. In a country where veterans, older men and gun-owning households are at higher risk, Montana has more of all three than the average American state. It treasures rugged individualism in a time when loneliness is commonly reported as a mental health problem. In a world where more suicides and attempted suicides occur at higher altitude, it sits on America’s Rocky Mountain spine. While it is well-known that effective treatment and follow-up for depression requires access to mental health professionals, Montana struggles to recruit and attract psychologists, psychiatrists and social workers. Montana has had one of the highest rates of suicide in the country for a century and bounces, depending on the years, between the top and slightly trailing positions in America’s rankings.
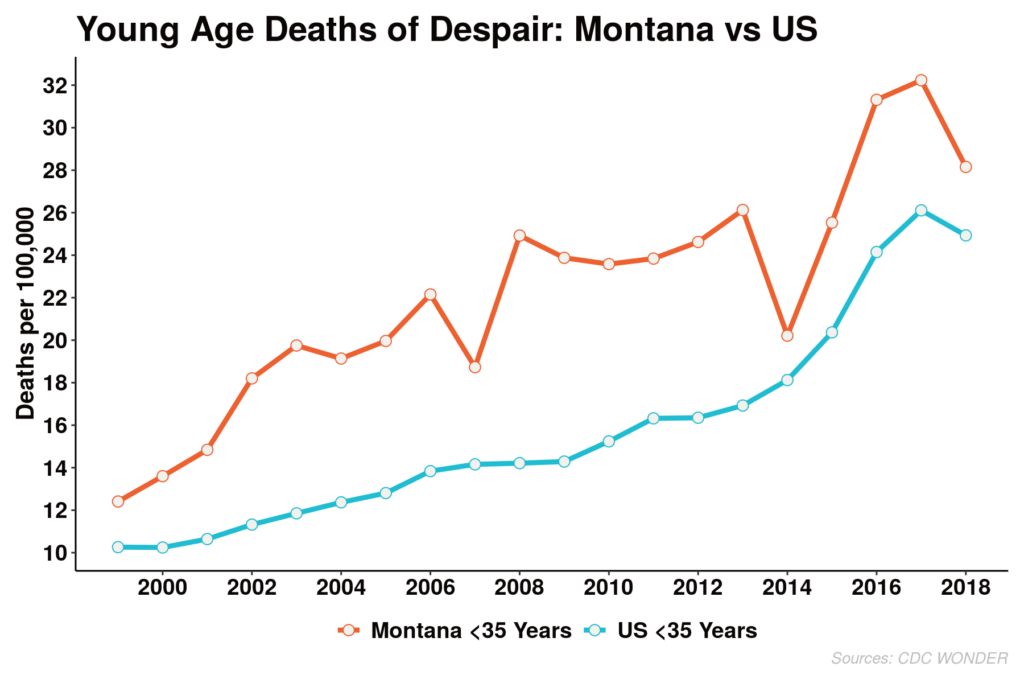
And so, as the United States saw a strong and steady upward trend in deaths linked to suicide, alcohol and drugs, Montana moved up in tandem with other states. History and geography, however, give the problems that lead to early death a particular, and particularly challenging, profile. Montana is seeing rising numbers of deaths among young people, and it’s seeing that trend among enrolled residents of the native tribes that call Montana home.
The Montana Landscape
This piece is the second in a continuing series of reports on Deaths of Despair across the nation by the American Communities Project funded by the Arthur Blank Family Foundation. Our first report, in July, laid out the size and impact of the problem across our 15 county types. Data analysis and visualization are provided by the Center on Rural Innovation.
The state is not very diverse. The Census Bureau puts the white population at about 86% and the Native American population at roughly 7%, meaning Asian and Pacific Islander, Black, Latino, and mixed-race populations only make up about 4% of the state’s people. The trip from the western border with Idaho to the eastern border with North and South Dakota, at about 750 miles, is longer than the trip from Washington, D.C., to Chicago, which would take you through five or six states. And even if Montana is not known for racial diversity, it holds a wide range of different community types. Within those far-reaching borders are counties classified using the American Communities Project matrix as Aging Farmlands, Working Class Country, Rural Middle America, College Towns, Evangelical Hubs, Exurbs, and Military Posts. With just a few exceptions, these various community types have seen significant run-ups in the numbers of deaths from alcohol and drug abuse and suicide.
Clustered on the eastern end of the state, the Aging Farmlands have seen a gradual rise in the deaths of despair. And on the western border, the counties that make up Montana’s Working Class Country have seen significant rises in all classes of early deaths.
Deaths of Despair by Year Groups [Colored by ACP Types]
A Long List of Challenges
I meet the state’s suicide prevention coordinator, Karl Rosston, as he is about to begin a training program for nurses on warning signs for people contemplating ending their own lives. “We’ve been in the top five for the last 40 years. As a matter of fact, we’ve been near the top since we started keeping data in 1918.”
At a cafeteria table at Montana State University in Bozeman, he describes a daunting set of variables, some of which have a solution, many of which don’t. “We’re a northern state. We have vitamin D deficiencies because we have less sunshine. And Vitamin D deficiencies are correlated with higher risk for depression.”
The opioid overdose problem that has been ending tens of thousands of lives in America for years is present in Montana, but not a leading factor in early death. Rosston noted that in 42% of his state’s suicides, alcohol was found in the body, the rates for opioids and other drugs are much lower. “I see a lot of people who use alcohol to self-medicate their depression or anxiety. There’s one problem with that, alcohol is a depressant. Using a depressant to medicate your depression is not going to work too well.
“We’re near the top in the nation in alcohol consumption per capita, in alcohol-related deaths and DUI. And then you throw in access to lethal means,” which, in Montana means firearms that are easy to acquire in the state, “and you have a really major issue. Because bottom line: Nationally between 70 and 90% of suicide attempts are by overdose, but it’s one of the least lethal means, anywhere between 3 and 11%. But when you use a firearm it’s more like 90%. Nationally about 51% of all suicides are by firearm, in Montana it’s about 63%.”
Isolation is a problem. Simply put, at 147,000 square miles, but just a little more than 1 million people, much of the state is empty, or close to it, at a population density of just 6.7 people per square mile. It has about the same population as Rhode Island in an area about 95 times the size. Isolation is bad for depression, and vast distances make for practical challenges, said Rosston. “At the law enforcement academy, they tell me it can take an hour and a half to two hours to respond to a 911 call.”
Yellowstone County, just outside of Billings. Montana’s population density is under seven people per square mile. Photo by Ray Suarez
When I asked Rosston, who reviews the death certificate of every suicide in the state, to give me a recent, typical case, he said, “You have a 40-year-old male, who has had a recent divorce. May have quit his job or is not working, chronic pain. Uses a firearm. Recent history of increased drinking. That’s the profile I see all the time. The relationship component is huge, as is the firearm.”
However, the disturbing growth Rosston sees in the numbers are not among the middle-aged white men, the military veterans or the chronic pain sufferers who have long buttressed Montana’s deaths of despair figures. Rather, he sees worrying signs among young people, and especially Native Americans, both in urban areas and on tribal lands.
Every state in the union contributes data to the national Youth Risk Behavior Survey. Montana’s 2019 numbers are sobering reading for anyone trying to understand the rise in deaths of despair. More than a third of the state’s teens say they felt so sad or hopeless for two weeks or more in a row during the previous year they stopped going to school. More than a quarter thought about suicide, and for about one out of five, it was serious enough to contemplate a plan for ending their lives. One in 10 had actually attempted to end their life. In contemplating, planning and attempting suicide, the rates for girls exceeded that for boys. Almost a quarter of high school girls, 23.5%, reported making a plan to end their lives, a rate roughly twice as high as that for high school boys at 12%. Some 12% of girls reported they had attempted suicide, a rate about 50% higher than that reported by high school boys. For boys and girls, the rates of all these suicide-related behaviors exceeded the national average. Among their Native American peers, the attempted suicide rate was almost twice as high.
The numbers are no surprise to Christina Powell, co-director of Bozeman Help Center, a crisis hotline. “If there’s a common thread, it’s the ability to tolerate loss. And when I say loss, I’m talking about everything. From things like, you know, a girlfriend or a boyfriend. Loss can be everything: loss of job, loss of status, relationships, loss of family. Loss is in some ways perceptual, in many ways concrete. All human beings experience a level of loss throughout a lifetime. That’s to be expected. Loss seems to be consistently there in moments of despair.”
THE CRISES FACING NATIVE AMERICAN YOUTH
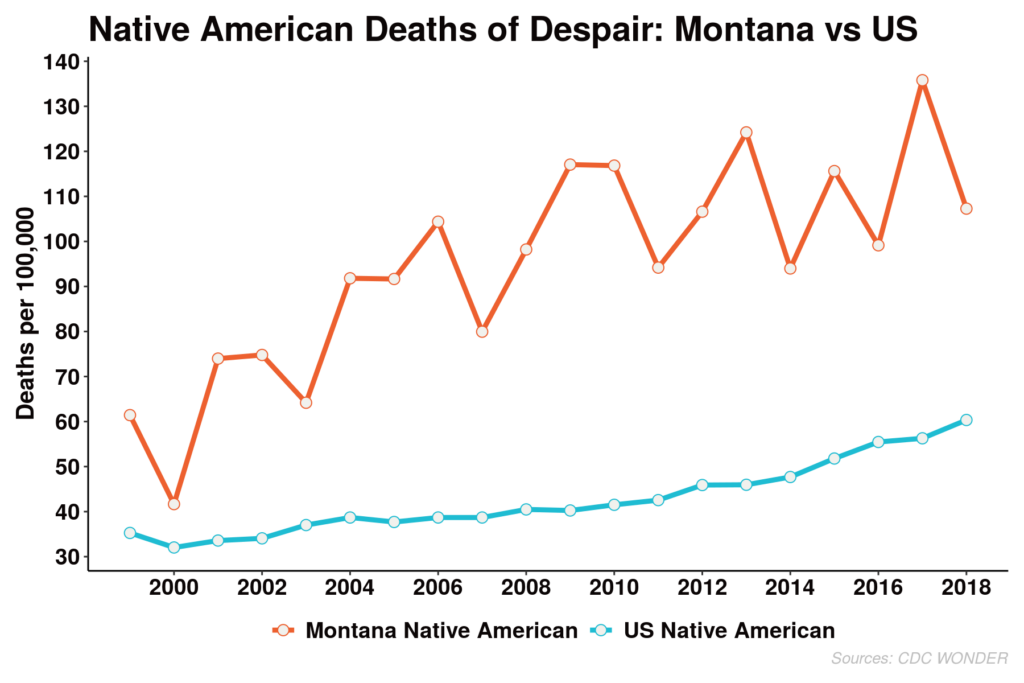
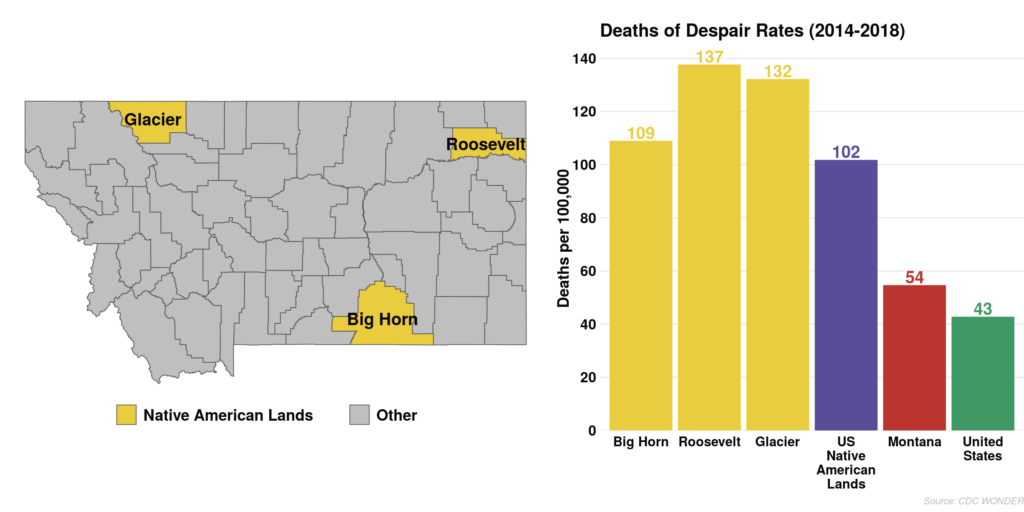
The Deaths of Despair numbers are particularly concerning in the Native American Lands county type in the ACP. Our first report noted how the rate in the Native American Lands of 101.6 per 100,000 people, was nearly three times the national rate of 38.3. And several Native American Lands counties in Montana (Big Horn, Roosevelt and Glacier) sit above the national figure for Native American counties. The roots of those high numbers are deeply tied to larger historical and cultural challenges in the Native American Lands counties.
Educator, activist and Crow tribal member Shane Doyle sees despair on the reservations, and says it makes sense, given what teenagers are up against. The Crow Reservation is mostly in Big Horn County. “Look at what has occurred here over the last 150 years. If you’re a kid, you think it’s normal to live in utter poverty. You think it’s normal to face a cascade of health issues. Unless you can see your way through to the issues of how we got here, you’re going to be weighed down by fatalism.
“If you can’t describe how Native people were once proud and strong and healthy and resilient, if you can’t conjure that up in your mind, it’s going to lead you to believe either Native people deserve this, or are stupid, or lazy. Or you believe the myths, we can’t handle alcohol, or how you don’t fit into society. Myths made popular by books and media and movies.
“If you decide you don’t want to accept it, what options do you have?”
Speaking to tribal members and other Montanans, on the reservations and off, a phrase kept popping up in interviews: “historical trauma.” It can’t be measured by researchers, it can’t be tracked from year to year, or compared in state-by-state tables. For adults trying to head off the suffering and early death so common in Indian families, that trauma is as real and tangible as statistics about high school completion or drug possession.
“Think about what it’s meant to experience generations of catastrophic and cataclysmic loss,” Doyle said. “The whole process started with smallpox, diphtheria, typhoid, diseases brought here from outside. That was just the beginning of hard times for Native people here. Most of them lost at least 75% of their communities, then land stripped away.”
Along with poverty and physical suffering came cultural eradication, with children moved off tribal lands and away from families to boarding schools, not once, but for generations of children, an intentional stripping away of ancient languages and cultural knowledge. Doyle said, “It’s a community that’s been traumatized for well over 150 years, and hasn’t been able to regain its independence.”
The land is stunning. Jagged mountains emerge from golden grasslands. Threads of cloud crisscross the renowned sky. Suddenly curious cows raise their heads in unison to watch a single car come by on a gravel road. All that breathtaking beauty can’t hide the worn mobile homes, the sparse store shelves, the cracked windows mended with masking tape to hold the powerful wind rippling the roadside brush.
Confronting the Problems
Alma Knows His Gun McCormick is the executive director of Messengers for Health, a program on the Crow Reservation bringing education, advocacy and health services to tribal members. While identifying the need for better healthcare on the reservation as an important issue in fighting deaths of despair, McCormick does assign a role to historical trauma, as well. The role of rejection in the history of her Crow people and other Montana tribes is underestimated, and it binds her people to this day. “We see the natural events, boarding school, broken treaties, racism,” she said. We can describe those facts, but underlying all of it, it’s a spiritual thing … it’s rejection. Because of being displaced, having our lands taken away, assimilating to a culture different from ours, we experience a spiritual rejection.”
McCormick connects her people to essential health services and the latest diagnostic procedures, and at the same time assesses something harder to see, “a heaviness” that keeps her people in its strong grip. “That identity, those values, that’s what has kept us over the years, facing adversities of historical trauma. That is how we have overcome.”
McCormick said the Indian Health Service, an arm of the federal government, makes mental health treatment available for tribal members, but stigma makes even those in deep trouble shy away. “They don’t seek it out. Confidentiality is key and, unfortunately, that’s one of the barriers that keeps people from going to Indian Health Services, lack of confidentiality. And not only in the area of mental health, just going and receiving healthcare.”
In small communities like Crow Agency, it is well-understood that people have mental health and drug counseling needs, McCormick said, but there is little confidence that a family’s private matters would stay private. “Information seems to leak out. Everyone knows everyone. If they went to an appointment, maybe they were diagnosed with something, or if some things going on, information goes out.”
If they try to go elsewhere, it can mean a long drive. “People have to go into Billings if they want to see a specialist. It’s a hundred miles round trip, and transportation can be a significant barrier to people seeking healthcare.” During the COVID emergency, burning through Montana through the autumn and into the winter, McCormick was able to use pandemic relief funds from the state to issue $30 gas cards, which allows a reservation family to make the long trip to the state’s biggest city. Some communities on reservation land are much farther away, and get a $40 card to cover the gas.
As a licensed clinical social worker, and a man immersed in data from his state and around the country, Karl Rosston easily rattles off the numbers that define his state’s challenges from untreated pain to distance to the nearest psychiatrist.
He also cites both historical trauma and an alienation from the tribal past as big factors in suicide rates on the reservations, about twice the national average. “Where we often see a huge gap is between the youth of the tribes and the elders. The elders, one of their main jobs, is to pass down the traditions of the tribe. We see a huge gap where these kids are not learning their culture, not learning their language, not learning their healing ceremonies, and you have a generation of lost kids. Then they’re exposed to poverty and addiction and crime and gambling and everything else evident on our reservations, and you can understand why you have such a high rate of despair, and suicide.”
Underlying Issues
The pain of too-early death is present across the Native American Lands counties of Montana. There is a strong desire for change, and there’s an acknowledgement that high levels of family dissolution, substance abuse and joblessness cannot be changed overnight. Lack of daylight and altitude that reduces the effectiveness of anti-depressants are impossible to change. Tribal members wrestle with the long- and short-term nature of their challenges and try to find near-term solutions that save lives, while still wishing to tackle the big, structural problems.
Peggy White Well Known Buffalo said she saw problems everywhere she looked on Crow lands: drug abuse, alcoholism, domestic violence and threats to the maintenance of the language and the tribe’s traditions. With her Center Pole project, she tried to pick off those problems one by one, providing a cultural hub, a source of nourishing food, and training in Crow arts and traditions. We talked in the Center Pole’s café as she gave instructions and greetings in Crow to workers and volunteers bustling in and out.
White said a vision during a traditional sun dance pointed the way. In her vision, she walked past tables full of food and saw an Indian man who told her to “feed the ones that need it. Give it to people who don’t have.” Switching back and forth between English and Crow in the story, she recalled, “I know what it is not to have food. I can remember not having enough to eat.”
Reluctant to use the term “mental illness,” White recalled her own grandson’s death, just weeks before. In a video addressing White, her grandson apologized for ending his life and forced her to look back in regret, and wonder why she had not done more to pull the young man into her orbit. “Why didn’t I check on him when I didn’t see him for six months. Why didn’t I try to guide him in my spiritual beliefs? Why didn’t I try to spend more time with him? It was really hard.”
White works with recovering alcoholics and drug users, as well as children and adults who have suffered domestic abuse. Lightening the burden of historical trauma, White said, requires an approach to Native people that preserves the best of their past to bring healing and balance to the present. She takes young people to Crow holy places, teaches them the use of native plants for religious customs and herbal remedies for medicine.
Young Tribal Members
McCormick is committed to getting her people treatment, and she wants to find an approach that incorporates a heavy influence of Crow traditional teaching into a community health model to combat substance abuse and early death. “We are designing it right now. We’re researching intervention on how to improve self-care when people have chronic illness. It shows very strongly our people need mental and emotional wellness support. We set up a support group with our cultural ways, our language, our kinship, our wisdom passed down.”
Collena Brown grew up in the tiny town of Grass Lodge and has lived there almost her entire life. She watched as the local Boys and Girls Club, run by the tribe, lost its charter and went belly-up. Though her family was preparing to leave town for new work, Brown instead revived the charter, and is running her new club separately from the tribal administration. “We started everything from the ground up, from finding board members, finding funding. I had never written grant applications in my entire life.”
The new Boys and Girls club was finding its feet just as the Crow reservation grappled with the coronavirus pandemic, and school-age children were sent home to learn remotely, with very little support or follow-up for remote, self-guided learning. Toward the end of the year the schools remained closed. Brown is trying to keep kids current with their studies while supporting parents who must work. “The kids know that we’re there, that we’re here to help them.” The Boys and Girls Club is hiring high schoolers as tutors, and raising up leaders at the same time. “We’re teaching them the joys of having a job. The responsibility of looking after themselves. We don’t take calls from parents. If you can’t make your scheduled shift, you have to call.
“We’re making sure the teenagers know what responsibilities they have.”
She worries about the threat of early death, the kids she can’t reach in time, and what to do about their memories. “We almost glorify the ones who had committed suicide. We have to remember them, but I don’t think we should make it bigger than it is, so that the youth see it in a good light.”
Brown said she sees teenagers who are nearly on their own, with loose association to broken families, and homes far removed from other connections. “They have no relationship with their parents. No support whatsoever. A kid is looking for a safe place, somebody who will listen to them. In town, it’s a little different, maybe you have to be a little careful where you go. But farther out? A lot of them are stuck out there.”
Overcoming Isolation and Finding Meaning
That isolation, that lack of connection, is dangerous for people in crisis whether they find themselves miles from the nearest town on the Crow lands, on a farm first planted by European ancestors at the turn of the last century, or in one of Montana’s small cities. Kathy Allen trains the crisis counselors who work the phones at the Bozeman Health Center, and said the combination of shame and isolation leads people to crises they conclude they cannot share with the people around them. So they end up on the phone. “Part of our job is to reduce that shame, validate that the person is in pain, that of course these thoughts are coming up for them.
“I talk to a lot of teenagers who feel shame about reaching out. In Montana, there’s a mentality around not needing help, being able to get through things on your own.”
Resilience, and the lack of it, was identified as a culprit on reservations and off, among people of all races and ages. “It’s not just money,” said Shane Doyle. “You can’t just give a kid money and say, ‘Now go and be happy.’ There are a lot of angry young men here in Montana. And they’re angry because they haven’t been able to connect and express their humanity.”
Karl Rosston wants to screen for depression among every child in the state by the age of 15, a common age of onset, to get help early to someone who might otherwise endure decades of suffering that ends in early death. He is training nurses around the state to look for the behavioral clues to someone more likely to die a death of despair. “The more tools they have, the better they’re going to be able to recognize and identify these people that are at risk.”
Christina Powell wonders about what has changed in society. She knows there are a lot of walking wounded among us, and at the same time wonders if it is the challenge of daily life that has changed, or us? “What is our ability to tolerate loss? Is it being degraded as time goes by? Is there an increase in the experience of loss? That’s hard for me to believe.
“Are we adequately preparing our children to face loss?”
Shane Doyle said we never ask the most obvious question: “What does it mean to have a high quality of life? Our education system has been built to produce workers.
“How about happy human beings?”
Ray Suarez is co-host of the public radio program and podcast World Affairs, and covers Washington for Euronews. He is the author of three books on American life, most recently Latino Americans: The 500-Year Legacy That Shaped a Nation.
Covid-19 is widely thought to have triggered the worst economic crisis since the Great Depression, surpassing the Great Recession that caused significant hardship just over 10 years ago — the problem of hunger vividly displayed by food lines across America these past eight months.
Earlier this month, Feeding America released a forecast of the total population in food-insecure households based on projected changes to annual unemployment and poverty resulting from the pandemic. In Feeding America’s definition, this “assumes a national annual unemployment rate of 11.5% (7.6 percentage points higher than 2018) and a national annual poverty rate of 16.6% (4.8 percentage points higher than 2018).”
“Every food bank, whether they serve urban, suburban, or rural hunger, was impacted by Covid-19 with its widespread health and economic impact. You cannot prepare for that, but food banks have responded. This is what we do — we stand in the gap for those who need our help,” says Trisha Cunningham, president and CEO of the North Texas Food Bank, which serves 13 counties: the Big City of Dallas; Navarro in the African American South; the Exurbs of Denton, Collin, Rockwall, Kaufman, and Ellis; and the Evangelical Hubs of Fannin, Hunt, Grayson, Lamar, Delta, and Hopkins.
Covering 10,000 square miles in area, the North Texas Food Bank ended its fiscal year in June providing nearly 97 million meals — 5 million more than its 2025 goal, and 12 million more than anticipated before Covid. Today, NTFB is providing access to 10-11 million meals per month versus a prior year rate of 7-8 million.
In a wide-ranging interview, the ACP asked Cunningham about the scope of the problem in her area, how she and her team have been managing, who’s helping, what’s working, and what worries them this winter. Our edited exchange is below.
Ari Pinkus: Could you describe what you’re seeing in your community and hearing from customers you serve now? How does this compare with communities near you?
Trisha Cunningham: We hear from our network of 200+ partner agencies that clients they serve are understandably worried and stressed. Many have lost jobs or have seen reduced hours. And there is so much uncertainty around not just the virus itself, but around employment, government assistance programs and schools, on which many children and families rely on for meals.
But our clients are also extremely grateful, resilient, and strong. They often must make difficult choices, such as buying groceries one week or paying a utility bill or filling a prescription, and many were facing these challenges even before the pandemic.
According to Covid-related projections from Feeding America, NTFB’s service area has the second highest number of food insecure people in Texas (behind Houston).
Pinkus: How have the demographics of people you serve changed in the pandemic? Could you talk about the increased need?
Cunningham: Pre-pandemic data reflected the lowest food insecurity rates seen since before the Great Recession. However, the coronavirus pandemic is going to change these numbers in all 50 states, including Texas. Feeding America projects one in five North Texans may struggle with hunger this year, including one in four children. This encompasses almost 900,000 individuals.
Texas is projected to have one of the highest rates of food-insecure children in the country by the end of 2020 — a staggering number of 2.1 million children. This is a 28.7% food insecurity rate, up from 21.6% in 2018.
At the North Texas Food Bank, we have always served the working poor, children and families, and vulnerable populations such as seniors, veterans, disabled individuals, and the homeless. The pandemic has exacerbated the challenges that many people were already facing. At the same time, we have also seen that approximately 40% of individuals nationally are new to charitable food assistance, including many in North Texas.
Overall, we are distributing about double of what we did pre-pandemic. This demonstrates both the depths of the hunger needs that had already existed in our area and the impact that the Covid-19 pandemic has had on food insecurity and hunger.
A line of cars at Fair Park, South Dallas in spring 2020. Photos courtesy of North Texas Food Bank.
Pinkus: How have you changed your staffing and practices to meet this new demand, and what Covid-19 precautions are you taking?
Cunningham: At the onset of the pandemic, we flipped our business model to provide nutritious kitted boxes of food that could be delivered in a low- to no-touch method.
This required more labor to kit the boxes at a time when we had to halt our traditional volunteer operations. Many staff members hit the production floor to sort and pack boxes and to distribute foods at our mobile distributions. As our community’s needs increased, we tried to exhaust all resources and applied for Texas National Guard support. A small group is with us through December 2020.
Times of crisis also spawn innovation. A partnership spearheaded by our board chair brought together funders through the Communities Foundation of Texas and technology through the company Shiftsmart, which is helping displaced hospitality workers be paid to fill the vacated volunteer roles at local nonprofits. The North Texas Food Bank was the initial pilot and the model has expanded nationwide. It is a win-win that we will continue to use as long as there is community support. We are excited to have opened back up limited volunteer opportunities for external groups that operate under strict health and safety precautions.
We ramped up our own direct service through mobile distributions in areas of highest needs across the 13 counties we serve. These distributions are done drive-thru style to implement social distancing practices, and we have received tremendous feedback from the community, with our efforts in Fair Park in South Dallas serving as the largest scale mobile pantries to date (see pictures).
Food kits at Fair Park.
Texas National Guard at Fair Park.
Pinkus: What federal, state, and local support has your organization received? Are you receiving support from unexpected places?
Cunningham: We have received overwhelming support from our elected officials. Since day one, we have ensured they were involved in understanding how we are working in their areas and where they can use their connections to help get their communities increased access to food.
Direct support has come through a few channels. We accessed emergency funds due to the emergency disaster declarations at the local, state, and federal levels. State of Texas Assistance Requests allowed the emergency feeding network to access funds to purchase food and supplies directly from the food supply market. Additionally, this request allowed us to access workforce support by the National Guard after we lost most of our volunteers.
We also benefited from the CARES and Families First Coronavirus Response Act.
The USDA created a short-term program that created grocery food boxes to ease truck-to-trunk style distributions keeping everyone safe and to help get more food out into the community.
We are also grateful to our Texas State Agencies who have issued multiple waivers that have increased SNAP and Emergency Food access. These waivers have increased the flexibility of requirements, removed barriers, and simplified many processes.
Honestly, we could not have met the food needs without the support of these programs. One of our greatest concerns now is how we can support the long-term needs. We have not seen any drop in demand, but many of the government programs are slated to stop by the end of 2020.
Mobile distribution volunteers.
Theresa lives with COPD and diabetes — two conditions that make her more at-risk of serious illness if she contracts Covid-19. Since mid-March, trips to the doctor, the pharmacy, and her local food pantry are the only times she leaves the home she shares with her brother and two grandchildren. “I wouldn’t be here if I didn’t need it, let’s put it that way,” Theresa says as volunteers load up her car with nonperishable food items, dairy products, sweet potatoes, oranges, cucumbers, broccoli, and a note of encouragement. This photo and caption courtesy of Feeding America.
Pinkus: What policies have been most helpful to you?
Cunningham:
Simplifying the TEFAP intake form, the form required for households to receive emergency food from the USDA. This simplified form helped allow many of our partner agency-led and our own mobile distributions by reducing the 2-page intake form down to four simple questions, and not requiring a signature, thereby keeping everyone safe from direct interactions.
SNAP flexibility – Virtual online application assistance and waiving work requirements allowed so many who either could not leave their house or had lost their jobs to access SNAP benefits and purchase meals for their own families.
Pinkus: What constitutes a meal, and how do you ensure healthy food options for customers?
Cunningham: We follow Feeding America’s guidelines that 1.2 pounds of food equals 1 meal. We have a dedicated nutrition team with whom we consulted when putting the kitted boxes together to ensure the contents were well-balanced and nutritious.
From the onset of the pandemic through October, 93% of the food distributed has been nutritious (NTFB utilizes the Dietary Guidelines for Americans as its primary guide in determining what is considered a nutritious item).
We have been focused on our produce distribution for years, and it is especially important now. The Food Bank works to source fresh produce from local and national growers and rescues unsold produce from grocery store retailers. Produce is distributed through a variety of sites and programs, including NTFB Partner Agencies, the School Pantry program, and our Mobile Pantry program. Distributing these delicate products requires refrigerated warehouse space, refrigerated trucks, and an investment in manual labor to get the products out quickly.
During Covid-19, our Nutrition Services team revamped its services to include a robust online and virtual presence, including cooking demonstration videos that coordinate with our kitted food boxes, online recipes, and targeted virtual workshops for children, seniors, and families.
Pinkus: What are your biggest worries heading into the holiday season and the winter?
Cunningham: We know that having access to a holiday meal is important to all families. Hunger is a year-round issue, and we are always working to address this. We are working with our partner agencies to ensure they have the food they need for the expected increased demand and to distribute food as safely and efficiently as possible, including our mobile pantry distributions which will continue through the holidays. As more people gather indoors with the winter weather, we could see an increase in Covid-19 cases, which leads to further economic and financial impact on already struggling neighbors.
The holidays are also normally our busiest time for fundraising. We are working to ensure a strong fundraising season so we can continue to support the increased need in our community.
Pinkus: How do Americans’ plans to stockpile food affect what you see at your food bank?
Cunningham: Early in the pandemic, we all heard stories of empty shelves in local stores. With higher demand, supply was very tight, and everyone was vying for the same resources — shelf stable and canned foods. This led to a strain in the supply chain and our partners could not donate as much as they normally do. It also led to higher prices and longer lead times. We have had to purchase more food items to maintain the inventory necessary to meet the increased demand.
Pinkus: To what degree are you receiving increased donations in money and/or food from Americans who see their neighbors and fellow citizens in greater need?
Cunningham: North Texas has always been an extremely giving community, and this has been true as we work through the most substantial crisis we have ever faced. We used to say that hunger was a hidden issue, but I do not think it is hidden any longer. Because of that, thousands of our neighbors (and beyond) are donating for the first time. This is alongside our steadfast supporters who have trusted us and empowered us for years.
The estimated value of the NTFB Covid response through October was $47.2 million. This is costly but vital for our community. We know the impact of this crisis will continue at a high level long after the stories of families seeking food assistance have left the public eye. We are incredibly grateful for the outpouring of community support we have seen over the past few months.
Pinkus: How are you seeing this crisis as an opening to educate your community around food insecurity and dispel misconceptions?
Cunningham: The emergency food safety net has been around for quite some time, but it has always been a challenge to convince everyone that it is necessary and must be fully supported. What Covid-19 has allowed is for those of us in the anti-hunger space to demonstrate that the large federal and state programs that fight hunger not only work but should be able to be accessed by all.
Many families have found themselves in a new situation in which they did not plan to be, but long-standing anti-hunger programs are helping them get food on the table in a crisis, just like they are designed to do. Fighting hunger is a nonpartisan issue, and I think we can all agree no one deserves to be hungry.
Partner agency walkup distribution.
Partner agency volunteer, Good Samaritan of Garland.
Despite the consternation around mail-in voting during the pandemic, a clear majority of Americans are leaning toward voting by mail this fall — if they can. At the same time, a majority say they are concerned about the accuracy of counting votes submitted by mail. Minority centers, encompassing the African American South, Hispanic Centers, and Native American Lands, show the most concern about the accuracy of ballot counting, no matter the means of voting: mail, electronic, or paper.
To Vote or Not to Vote by Mail
A Dynata survey taken some 100 days before the presidential election finds that 60% of Americans are very or somewhat likely to vote by mail if it’s an option for the general election, while 28% say they are somewhat or very unlikely to use this method. At this point, 12% are not sure. California, Vermont, and the District of Columbia join Colorado, Hawaii, Oregon, Utah, and Washington in automatically sending all registered voters mail-in ballots.
The likelihood also ranges widely depending on a resident’s community type: In Big Cities, 68% say they are likely to vote by mail if given the choice, while in minority centers, 48% say so. (In minority communities, 30% say they are unlikely to vote by mail.)
Of all the community types, the less diverse Middle Suburbs are most split between whether or not they are likely to vote by mail: 49% say they are, while 39% say they are unlikely to mail in ballots. Compare those percentages to rural white communities, consisting of Aging Farmlands, Evangelical Hubs, Graying America, LDS Enclaves, Rural Middle America, and Working Class Country, where 50% say they are likely to vote by mail, and 34% say they are unlikely to vote this way.
These disparities may be explained by the circumstances in different kinds of communities.
Big Cities have suffered mightily these past four months from the coronavirus pandemic and have been contending with many protests. Residents may be more hesitant to venture out to the polls and potentially expose themselves to health and social concerns.
Minority centers have long been disenfranchised in the voting process, and concerns remain high about voter suppression in communities with large African American, Hispanic, and Native American populations. Many residents may not trust that their vote will count if they use an alternate method to in-person voting; they may also have unstable housing situations, making mailed ballots difficult to obtain and return.
The Middle Suburbs, made up of 77 counties concentrated the Northeast and upper Midwest, have been ravaged by deaths of despair, including drug overdoses, in the past several years. Longer-term, globalization and deindustrialization have taken a toll on these communities — and their residents. They went heavily for Donald Trump in 2016, but many are leaning away from him now. President Trump has denounced widespread mail-in voting, while he and his family vote by mail.
Concern About Counting
As election security steps into the spotlight again, there is a fair bit of concern about the accuracy of the vote count, regardless of the method used: 56% of Americans are concerned or very concerned about voting by mail, 50% say the same about electronic ballots, and 48% about paper ones, according to the Dynata survey. A majority in minority centers show concern with all three methods: mail, electronic, and paper.
Mail
Minority centers and Exurbs express the most concern about accuracy via mail-in voting at 63%. At the other end of the spectrum, Big Cities and Urban Suburbs are tied at 53%. Communities of rural whites, the young and mobile, and the Middle Suburbs are in the upper 50s.
Electronic
On electronic ballots, young and mobile communities — College Towns and Military Posts — show the least concern, while minority centers see the most: 41% of young and mobile communities say they are concerned or very concerned, perhaps because of their comfort with technology; 59% of minority centers express concern. Most communities hover around the average of 50% or tick to the low 50s.
Paper
While using paper ballots is slightly less concerning among Americans overall, 54% of minority centers say they are concerned or very concerned about the accuracy of paper votes counted, showing how voter disenfranchisement runs deep in the African American South, Hispanic Centers, and Native American Lands.
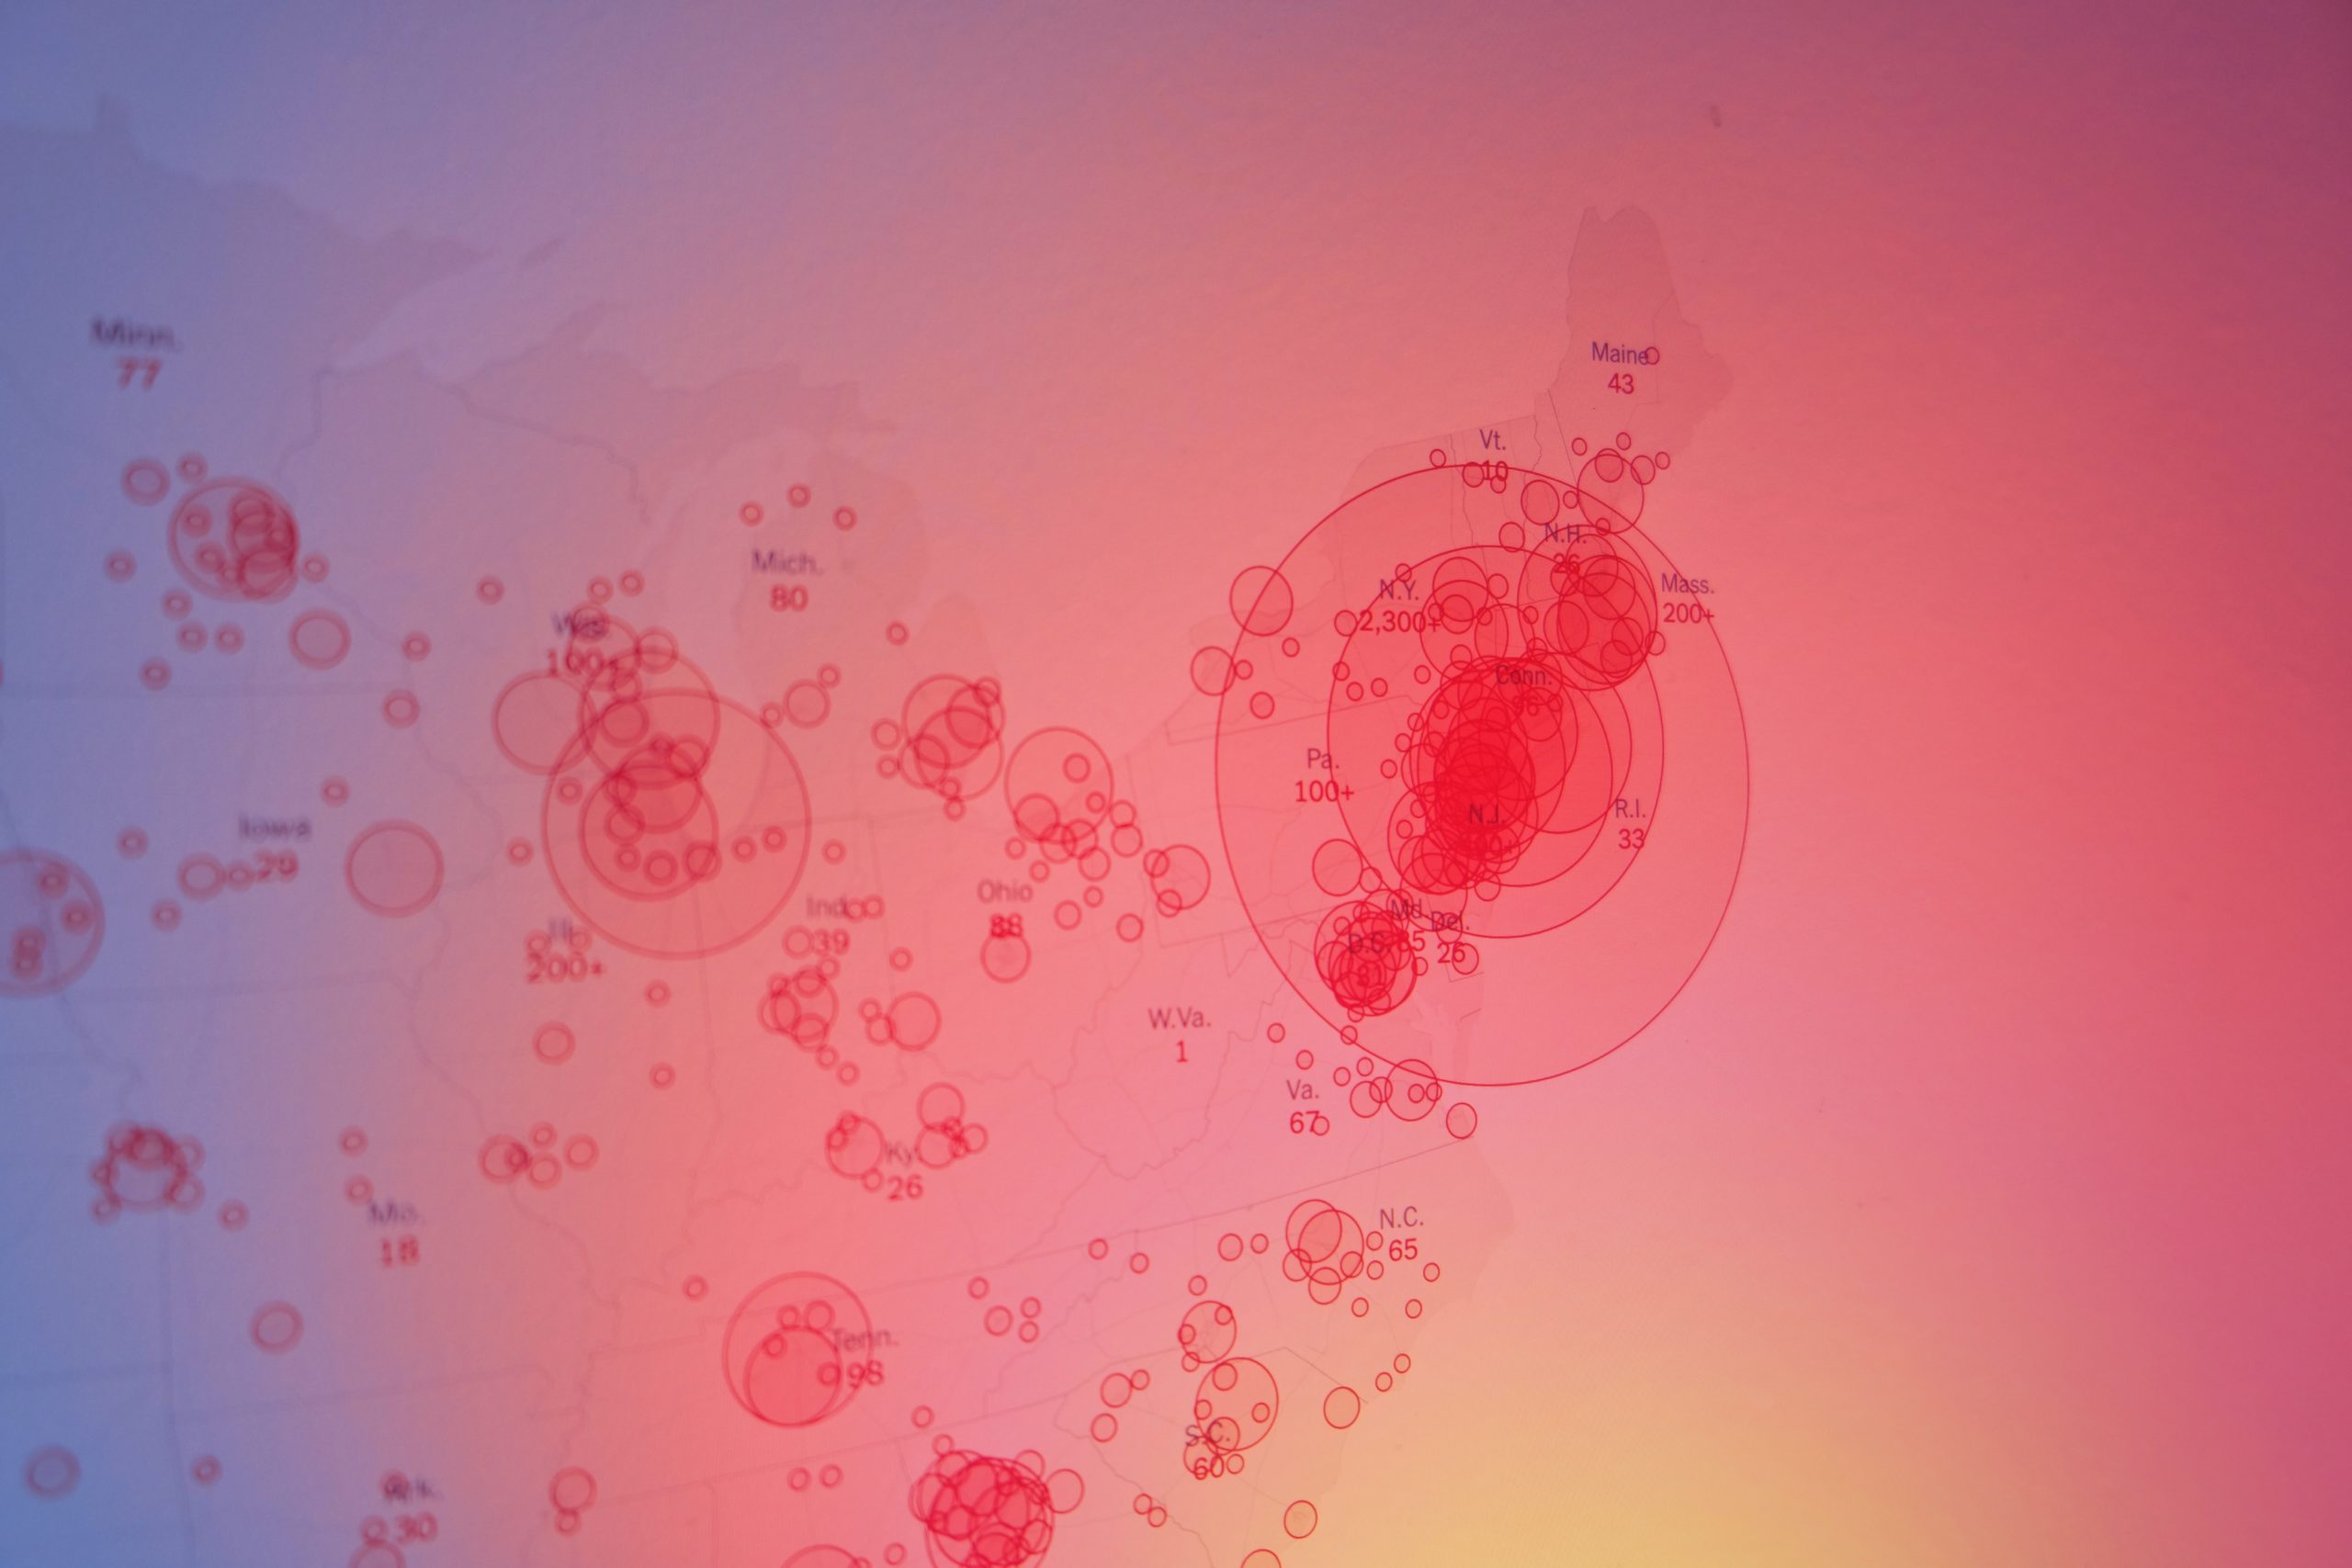

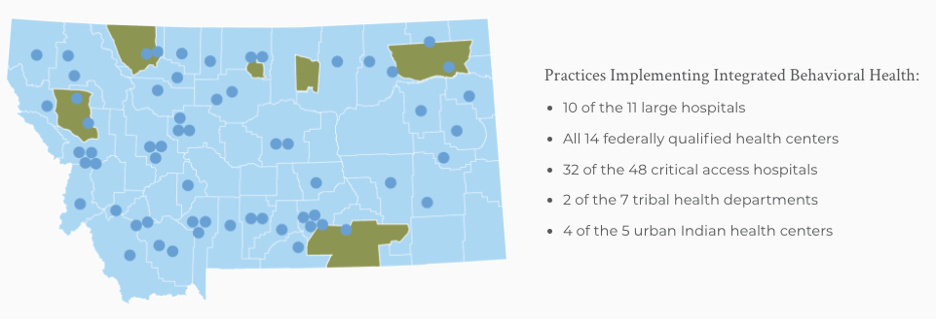
 Associate Professor Lee Banville joined the University of Montana faculty in 2009 after 13 years at PBS NewsHour, where he was editor-in-chief of the Online NewsHour.