The American Communities Project is undertaking a 30-month study of deaths of despair across the country, supported by The Arthur M. Blank Family Foundation. These are deaths resulting from drugs, alcohol, and/or suicide. The study includes data analysis as well as on-the-ground reporting in Georgia and Montana. Participants are: Dante Chinni, director; Ari Pinkus, senior editor; Lee Banville, professor at the University of Montana; Andy Miller, CEO and editor of Georgia Health News; and Ray Suarez, on-the-ground reporter. Data analysis, mapping and graphics by the Center on Rural Innovation.
Note: This page will be updated with new content throughout the span of the study.
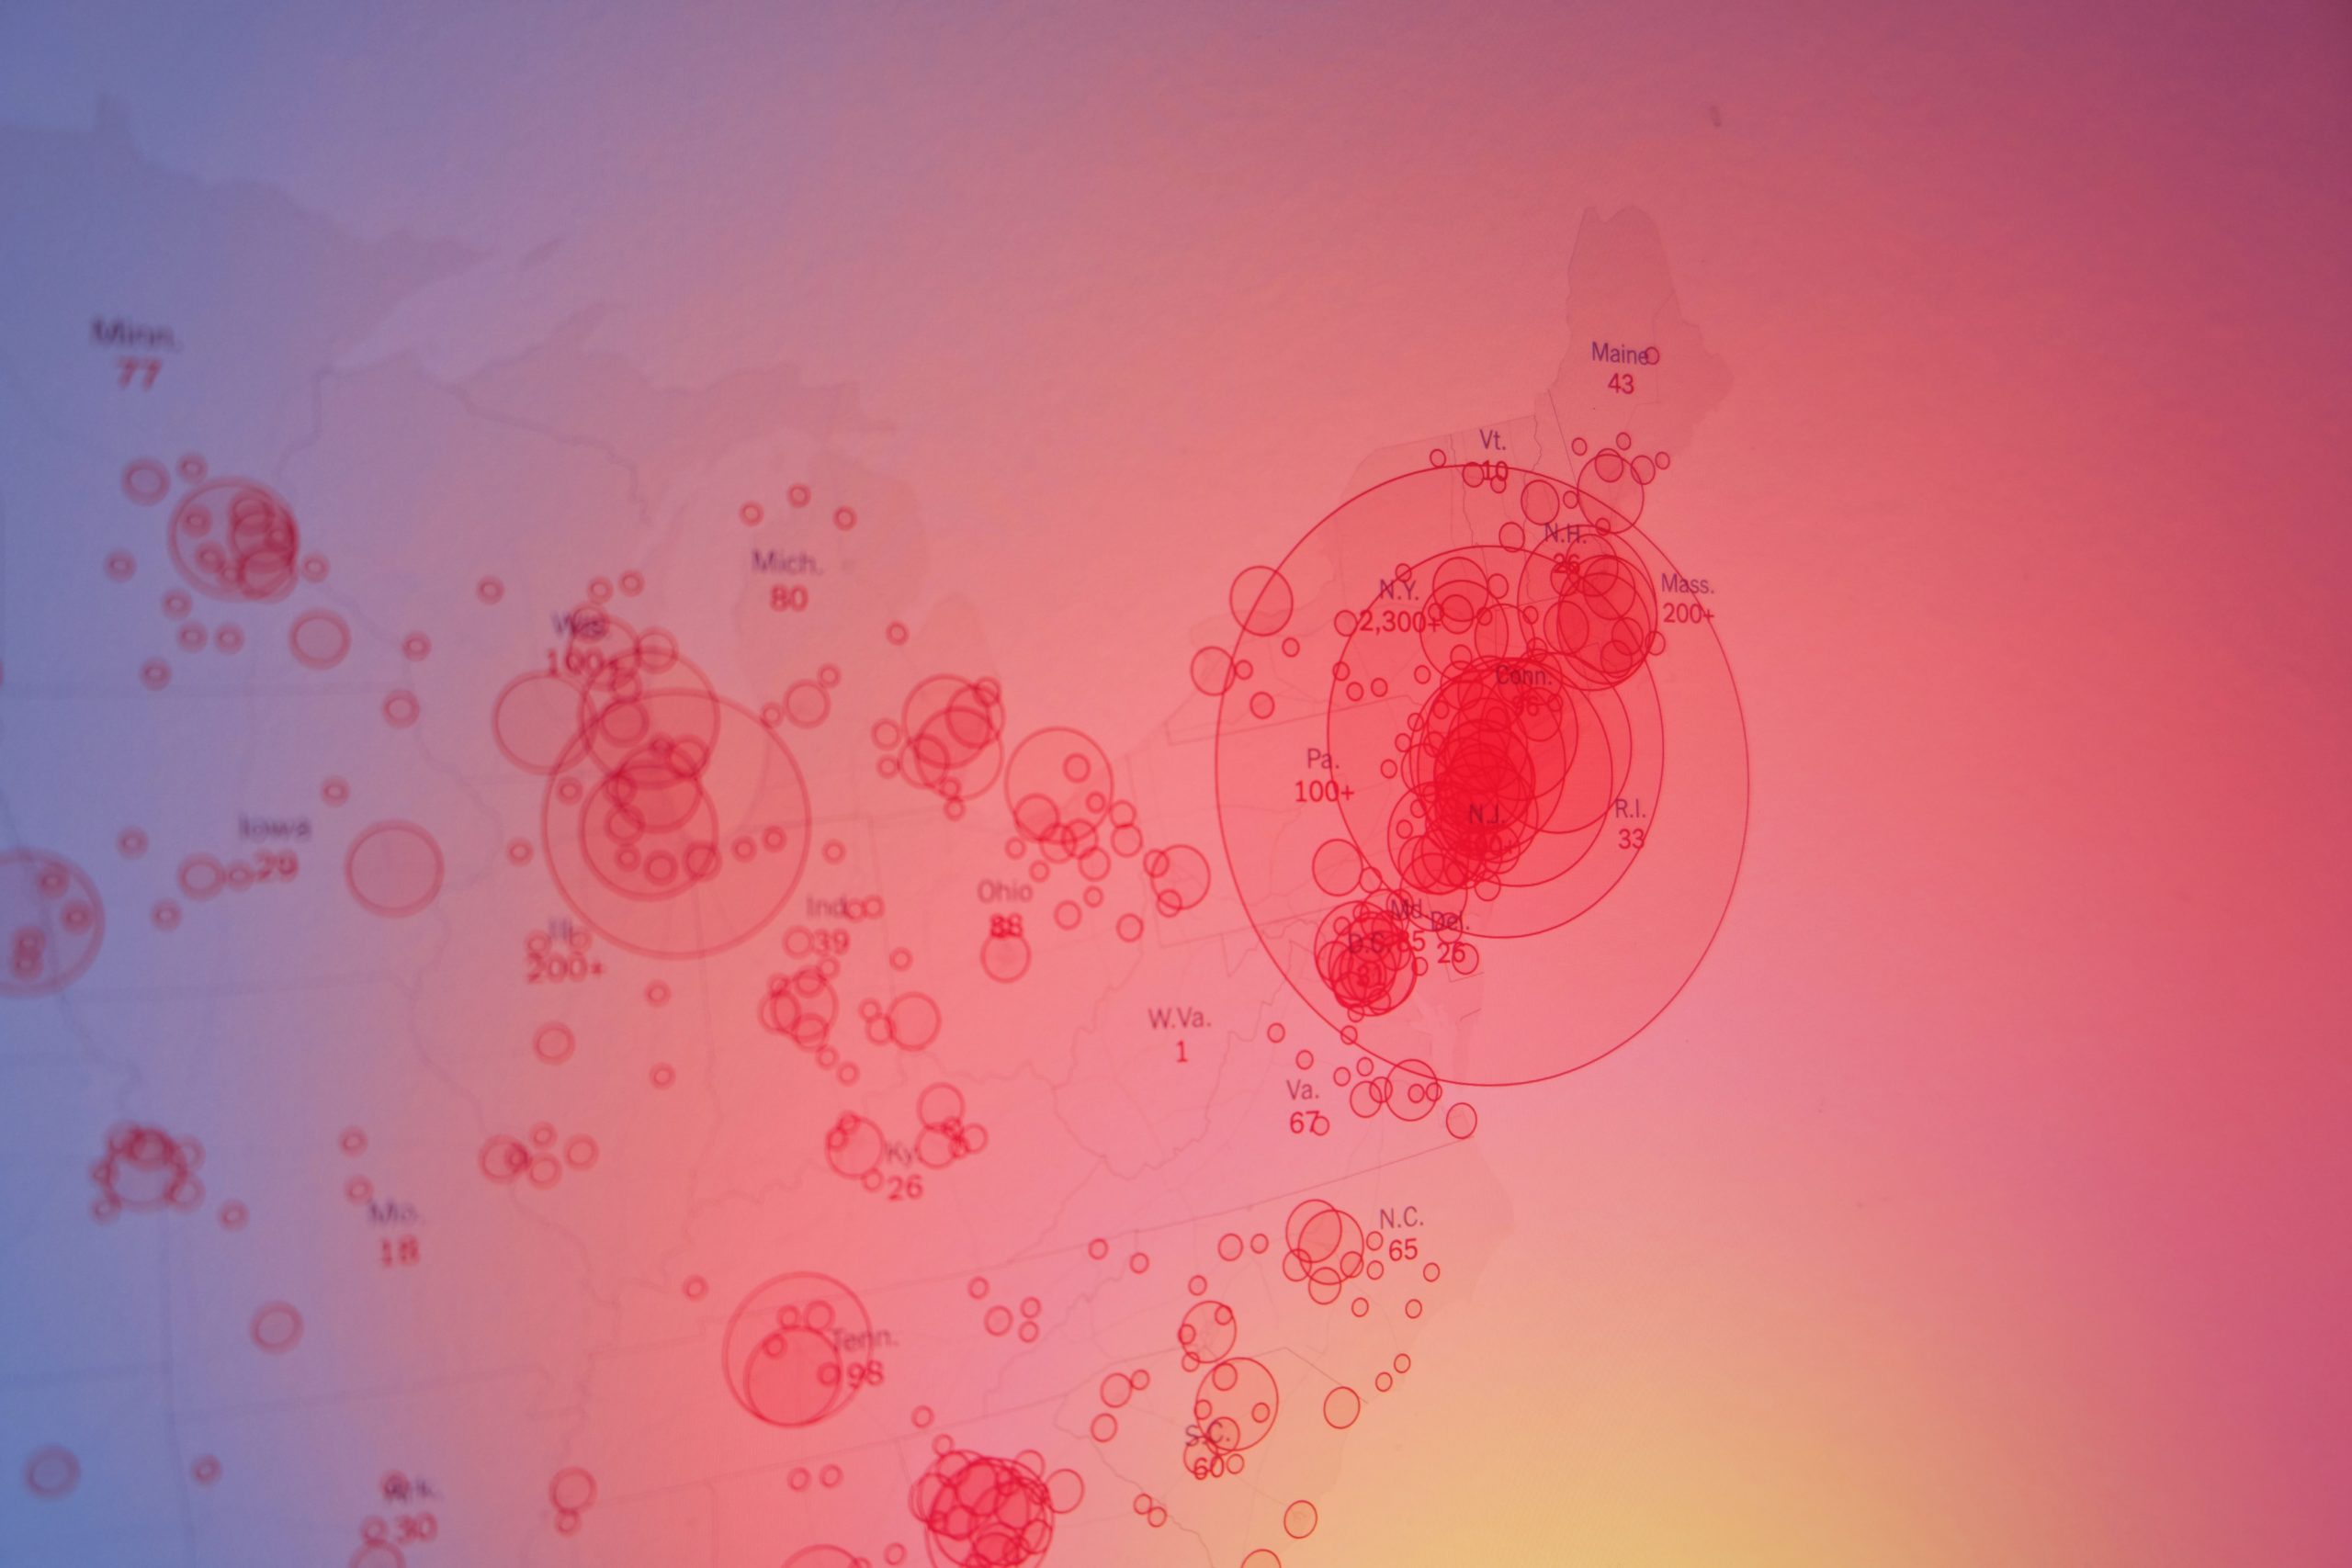
There’s a long list of measures that examine who is struggling in the United States — from poverty rates to income inequality — but in recent years a complicated set of personal struggles and challenges has come to be measured in one phrase, Deaths of Despair. This phrase describes deaths caused or brought on by alcohol and drugs as well as suicide. Behind the three words is a long list of root causes.
With this piece, the American Communities Project begins a two-year exploration into the causes and effects of Deaths of Despair, as well as positive interventions that might help decrease the phenomenon, funded by The Arthur M. Blank Family Foundation.
We’ll explore the term through the ACP’s 15 community types and analyze what drives the differences in deaths by community. The data raise many questions, including:
Why do some types of community seem to struggle with high numbers of Deaths of Despair and others do not?
How much of a factor is the racial composition or median age of a community, or the economic situation on the ground?
How do some communities overcome their challenges?
This effort will also explore the impact of the Covid-19 pandemic on Deaths of Despair in the United States. The Well Being Trust has already written that the pandemic could lead to an additional 75,000 deaths from alcohol, drugs, and suicide.
Three Major Findings
This first article on the topic is a snapshot of what has become an important issue in the American discourse on health, well-being, and socioeconomics. An analysis of Centers for Disease Control and Prevention data from 2014-2018 with the help of the Center on Rural Innovation reveals three major findings.
On the whole, urban places are faring much better that rural ones in the Deaths of Despair data, but they are not immune. There are notable differences among different kinds of urban communities, particularly the blue-collar Middle Suburbs, where the numbers are high.
Deaths of Despair rates do not break down cleanly along white and nonwhite community lines. In particular, communities of color have vastly different experiences with Deaths of Despair. Native American communities have suffered greatly, while communities with large African Americans populations have not.
Traditional economic and educational measures of a “thriving” community are not wholly determinative. Some “struggling” communities have high Deaths of Despair numbers while others have lower ones. The finding suggests other cultural factors play a bigger role.
Diving into the data brings a fuller understanding of these points.
The ACP Frame and Findings
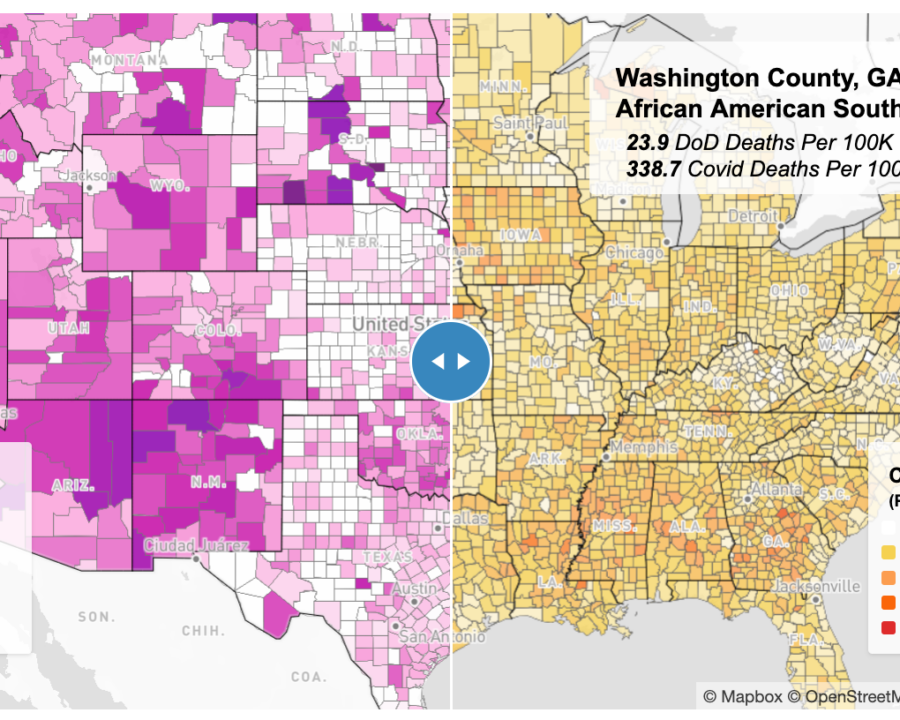
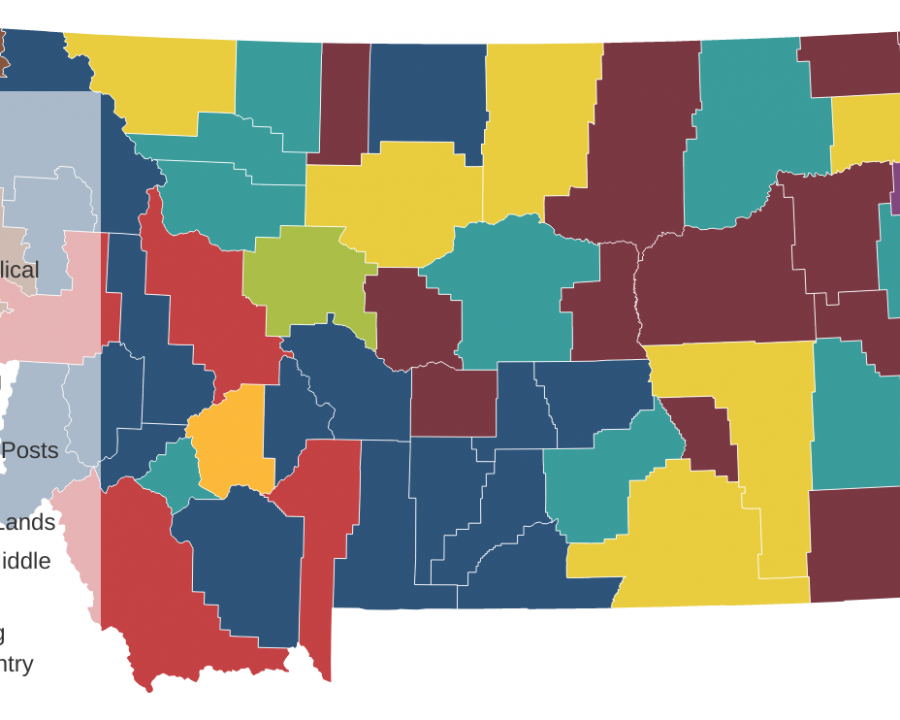
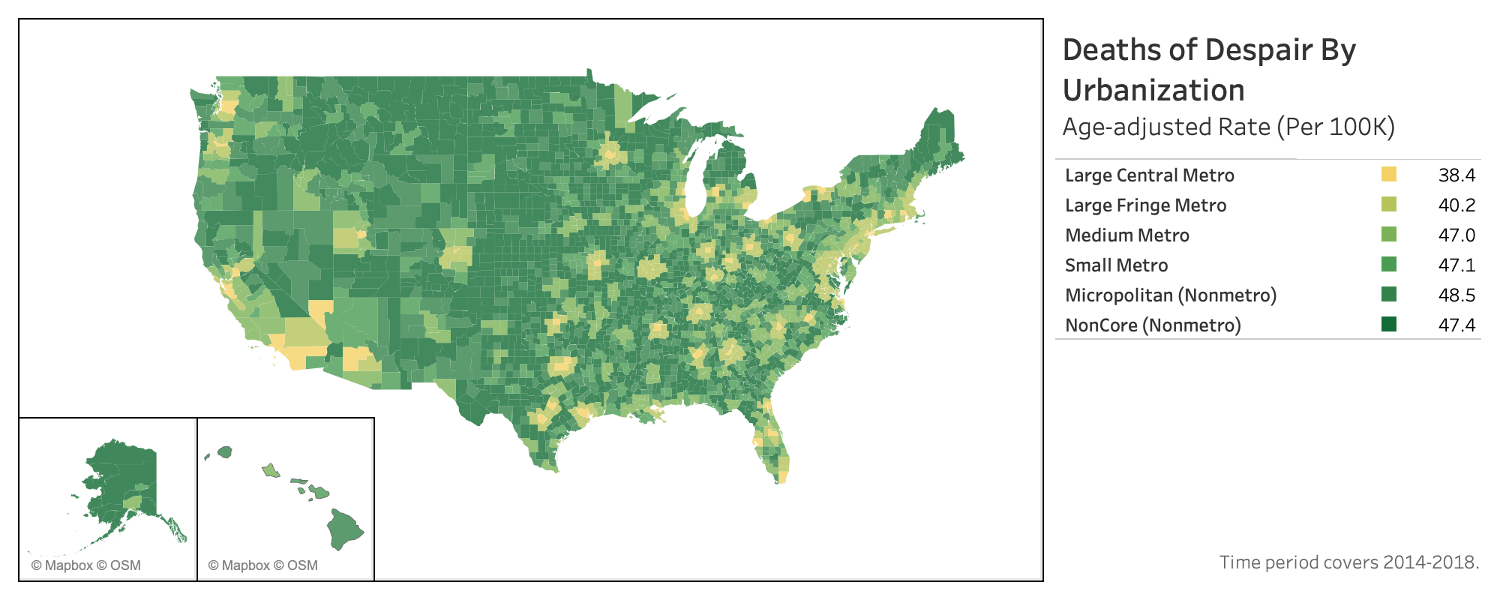
The frame for this analysis is the 15 community typology created by the American Communities Project at the county level on the map below. Click on individual counties to learn their ACP type and age-adjusted Deaths of Despair (DoD) rate — as well as the rates for each of the component elements of that figure. The side of the map displays the overall Deaths of Despair rate for each ACP type. All the rates are per 100,000 people while adjusting for age.
This analysis was done with the help of the Center on Rural Innovation using the CDC’s WONDER database. The causes of death associated with alcohol, drug, and suicide follow International Statistical Classification of Diseases and Related Health Problems 10th Revision. All Deaths of Despair cause codes are based on the codes used by Angus Deaton and Anne Case in their 2020 book, Deaths of Despair and the Future of Capitalism. A more detailed methodology can be found in this PDF: Deaths of Despair Methodology.
More Nuanced Divides than Urban/Rural
Since the phrase Deaths of Despair became a common term five years ago, much of the focus has been on rural communities’ struggles. Princeton Professors Case and Deaton published research showing increases in mortality rates among white, non-Hispanic Americans between the ages of 45 and 65 who did not hold a college degree — a group that makes up a larger percentage of rural communities.
Indeed, the National Center for Health Statistics breakdown of urban and rural counties shows that rural focus has merit. The figures below are all annual averages for the five-year period from 2014 to 2018.
As the map above shows, the Deaths of Despair rate is lowest in the most populous urban counties, and the figures tend to climb as population density falls.
Large Central Metro Counties (metropolitan hubs with more than 1 million people) have 38.3 Deaths of Despair per 100,000.
Large Metro Fringe Counties (other counties in metro areas with at least 1 million people) have 40.2 deaths per 100,000.
Medium Metro counties (between 250,000 and 1 million people) have 46.9 deaths per 100,000.
Small Metro counties (those with less than 250,000) have 47 per 100,000 people.
Micropolitan counties (between 10,000 and 50,000 people) have 48.4 Deaths of Despair per 100,000.
Non-core Metro counties (10,000 people and under) are just a bit lower at 47.4 per 100,000.
The consistent climb from largest to smallest community is not perfect but it is close. The difference between the most populous counties and the least populous is 24%. It suggests that urban communities hold advantages in the Deaths of Despair story. Perhaps closer proximity to friends and neighbors leads to less loneliness and/or more urban places have access to better resources.
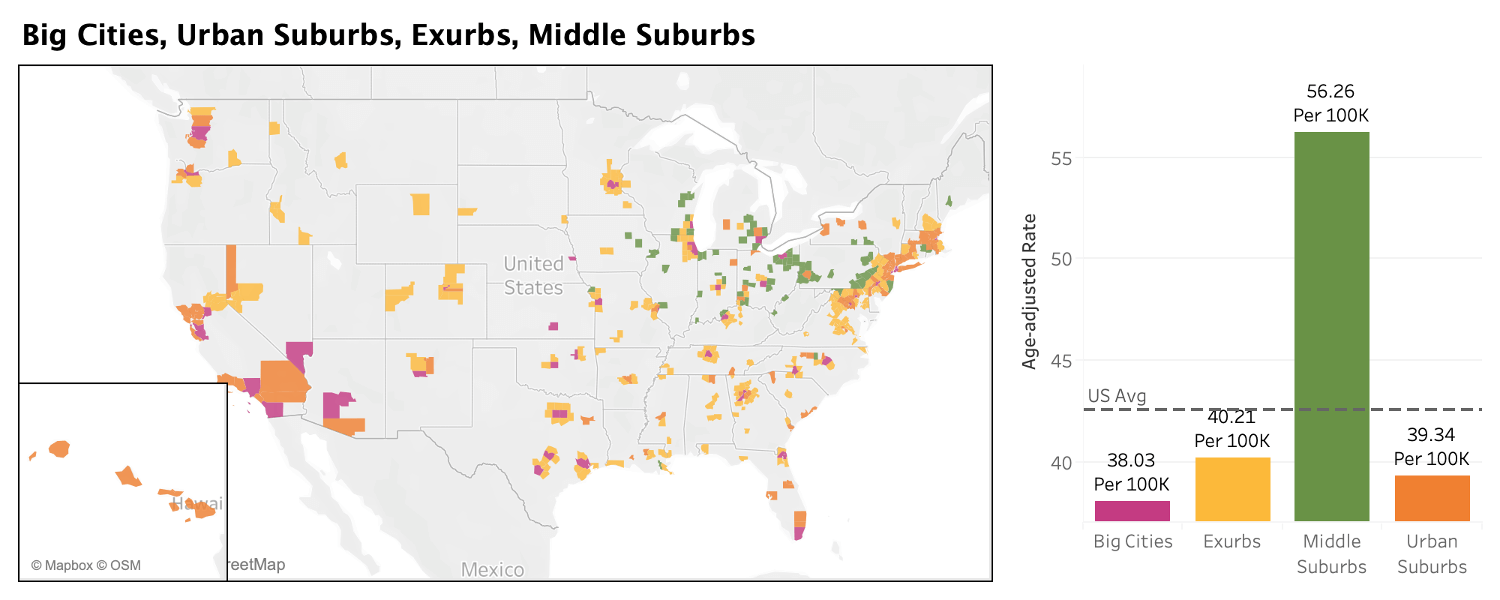
But in the ACP frame, the numbers in the most urban areas look very different, again, using averages from the same time period, 2014-2018. (See the map and chart below.)
The Big Cities, counties home to the nation’s most populous cities, come in at 38.0 deaths per 100,000 residents. Nationally, deaths are 42.5 per 100,000.
The Urban Suburbs, which tend to sit outside those big urban centers, look very similar, with 39.3 deaths per 100,000.
The less-populous Exurbs on the outskirts of many urban areas, have 40.2 deaths per 100,000 residents.
But the Middle Suburbs, a set of blue-collar urban counties based in the Industrial Midwest, are far above the others at 56.3 deaths per 100,000 residents. The figure is roughly 19% higher than the most rural county type in the National Center for Health Statistics urban-rural classification.
The differences in the data are not only regional but also more proximate.
Consider Delaware County, Ohio, an Exurb of Columbus. It has a Death of Despair rate of 24 deaths. But one county away to the northeast, the Middle Suburb of Richland County, has a rate of 65.
Outside of Detroit, Oakland County, an Urban Suburb in Michigan, has a rate of 40 deaths per 100,000, but neighboring Macomb County, a Middle Suburb, has a rate of 57 deaths.
What’s driving those distinctions is complicated.
The Middle Suburbs tend to have lower incomes than their neighboring counties and fewer college degrees, two big factors in the Deaths of Despair rate. In addition, these counties, long home to manufacturing employment, have been hit particularly hard by deindustrialization in the past 20 years. Many residents have lost union jobs, and experienced economic and health hardships as a result. Their blue-collar legacy also means some workers likely have endured repetitive stress injuries, which may have spurred greater use of prescription drugs.
Drug use is the top cause of death among the Deaths of Despair categories in the Middle Suburbs, making up more than half of all deaths at 31.7 per 100,000 people. Drugs are the leading cause of such deaths in many of the ACP community types, but not at that ratio.
The Middle Suburbs also tend to be older than other urban-oriented communities and are not adding population as fast as surrounding counties — in some cases they are losing population.
The Middle Suburbs’ hardships illustrate that the Deaths of Despair crisis does not break down neatly along the urban/rural divide.
Bright Spots and Pain Points in Communities of Color
The ACP’s two recent health and well-being reports showed that the challenges for the African American South, Hispanic Centers, and Native American Lands were steeper than for other ACP community types on a range of issues, from health insurance coverage to food security.
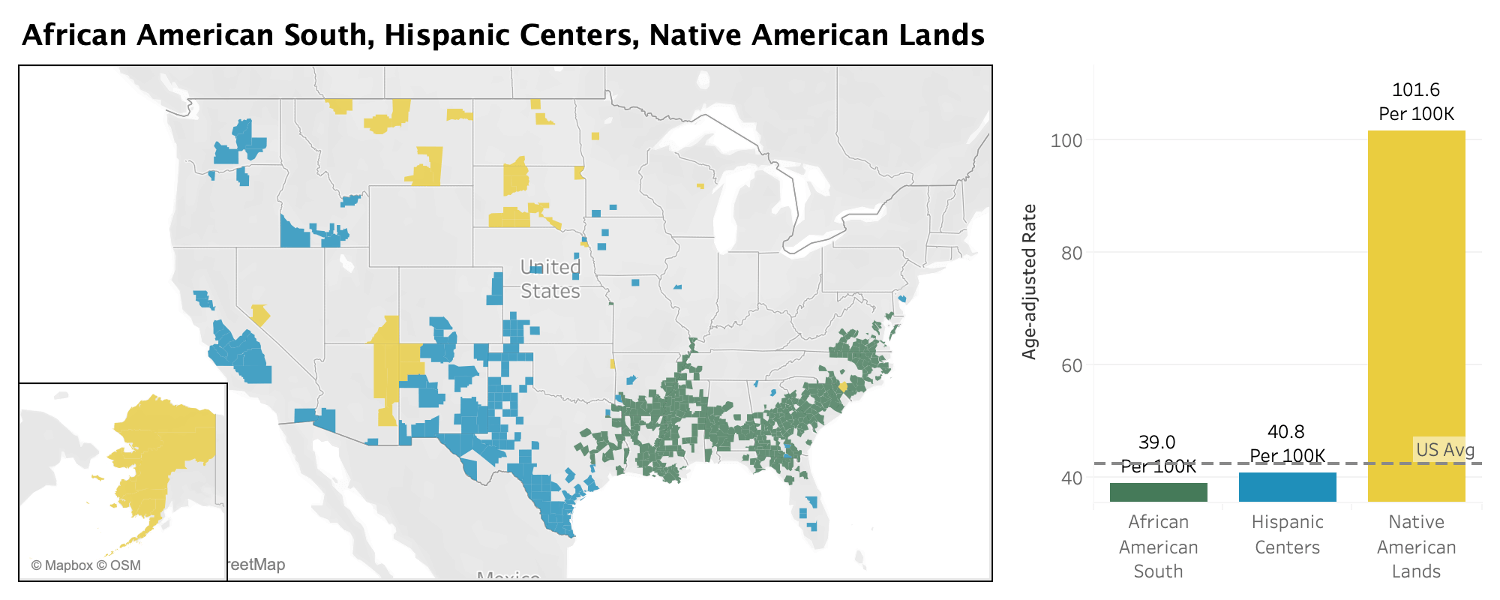
That pattern does not hold for Deaths of Despair. The roles of race and ethnicity seem muted, when looking at the average age-adjusted rate of Deaths of Despair from 2014 to 2018.
The African American South does better than the country as a whole. Hispanic Centers do better as well. However, Native American Lands have the highest rate of death in the ACP, by far. In other words, a “minority community” does not necessarily have more Deaths of Despair. (See the map and chart below.)
Among communities of color, and among the data overall, one community type stands out: the Native American Lands. In these 43 counties, the overall Deaths of Despair rate is a staggering 101.6 per 100,000 people. The Native American communities are also nearly twice as high as the next highest community type, Graying America, which has an overall rate of 57 per 100,000.
To be sure, those high figures are driven by a few counties with the greatest struggles. In Oglala Lakota County, South Dakota, the figure is 226 per 100,000 people. In nearby Mellette County, South Dakota, the rate is 183. In 20 Native American Lands counties, the overall rate for Deaths of Despair is above 100 per 100,000. The problem runs deep.
Native American Lands contain a discrete set of counties in the ACP. Most of these 43 counties are majority Native American, and the Native American populations within them are unique. They generally live together on reservations away from others. For those reasons, this group of communities may reveal the most about the challenges of a specific racial/ethnic group. These are places where the ties between community and identity are especially strong and where the challenges are many. On reservations, residents experience poor health care and extreme poverty. Off of tribal lands, discrimination is part of everyday life. Many of these communities also bear the scars of intergenerational trauma.
The deaths in the Native American Lands are driven most heavily by alcohol. The alcohol-related death rate in these communities is 44.2 per 100,000 people. That figure is higher than the overall Deaths of Despair rate of seven of the other 14 ACP types, but alcohol is not the only hard test in these counties. The suicide rate of 31 per 100,000 is the highest of any ACP type as well.
In short, the challenges in the Native American Lands appear complicated and deeper than any one concern. While economic opportunity has long been a struggle in these places, that alone doesn’t explain the high numbers here. Isolation may play a role, as most of these communities are remote. And many Native Americans say the discrimination they face away from their tribal lands can be harsh and make reservations feel like the safest places to be.
At the other end of the spectrum, the low rate for Deaths of Despair in the African American South is striking. The numbers there, 39 per 100,000 people, are not just below the national average of about 42.5 per 100,000, but below the figures of the whiter and wealthier Exurbs, where the rate is 40.2 per 100,000.
To be clear, most counties in the African American South are not majority African American, but counties where the Black population sits above the national average of roughly 13%. Racial divides and tensions are often woven into everyday life.
Despite an uneasy environment, the overall Deaths of Despair rate or the rate on any single factor (drugs, alcohol, or suicide) is not particularly high in the African American South. The death rate from drugs is well below the national number — 15.9 per 100,000 versus 18.6 per 100,000 nationally – and the alcohol-related death rate is also lower. The suicide rate is higher than the national figure, but just marginally so. For the most part, the communities of the African American South have not been deeply affected by the Deaths of Despair problem.
Hispanic Centers also do well in the Deaths of Despair data. Their rate, 40.8 per 100,000, sits just under the national figure, 42.5 per 100,000.
Deaths of Despair here are driven heavily by one factor, alcohol. The rates for death by drug use and suicide are below the national averages. But the death rate from alcohol is well above it, 14.4 per 100,000 versus 10.2 nationally.
There is a geographic pattern to the highest spiking Hispanic Centers. Nineteen of the top 20 are in New Mexico, Texas, and Colorado — and some figures are high. In Rio Arriba County, New Mexico, there are 66 alcohol-related deaths per 100,000 people. In Cibola County, New Mexico, the rate is 44. Hispanic Centers in California and the Midwest appear to fare much better. These places are driven by agriculture and tend to have lower unemployment rates.
In total, the differences in these three types of communities of color offer evidence that being a member of minority race or ethnicity is not the prominent driver for Deaths of Despair. Other societal ills seem to have bigger impacts. Indeed, the relatively good numbers in the African American South suggest that large Black populations may be helping some communities ward off the worst aspects of the epidemic. In the coming months, we will visit communities in Georgia and Montana to explore these issues at the community level — and how different kinds of places respond.
The Roles and Limits of Income and Education
Health and well-being in the United States, measured by a long list of indicators, are often driven by two principle elements, income and educational attainment. A community with high scores in both areas tends to offer residents more services, more opportunities, and more stability. Employers want to access the labor force. Stores want to access the consumers. In the broadest sense, many human needs are more easily met.
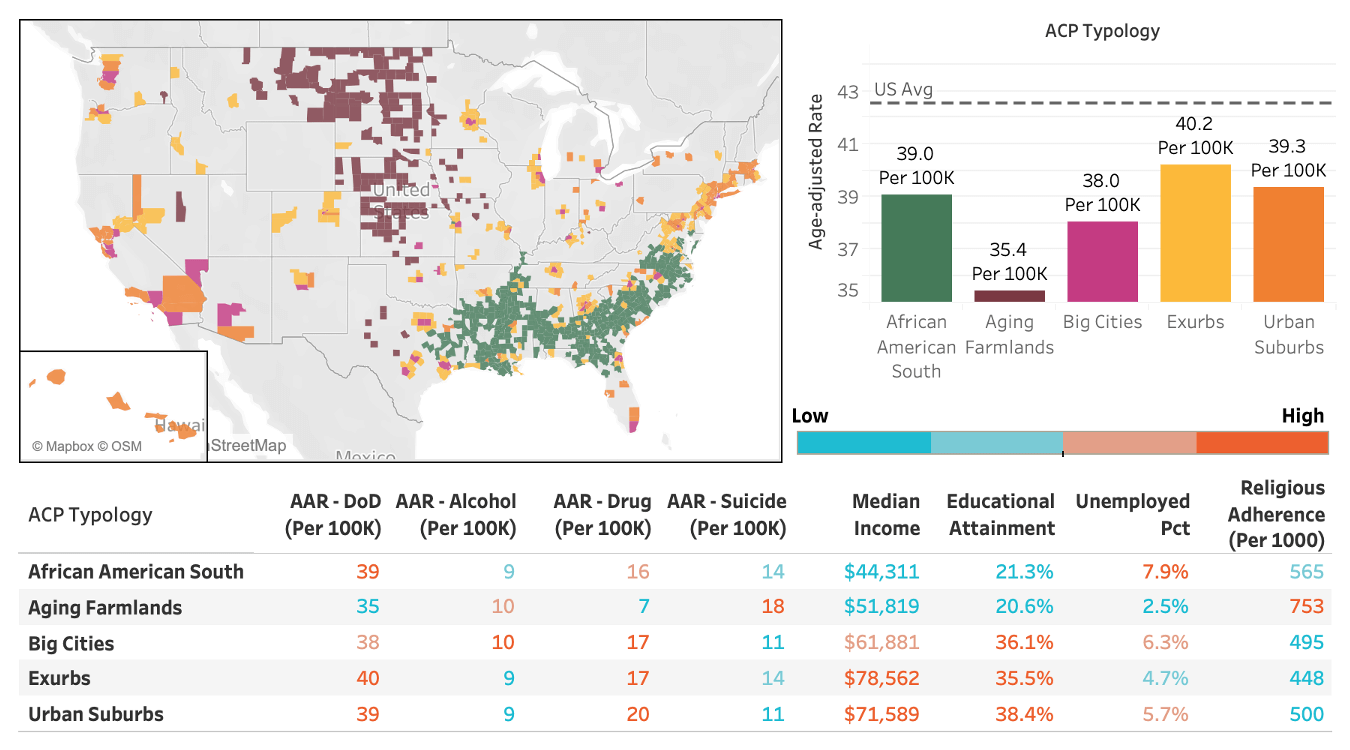
Yet in the Deaths of Despair data, economic and educational success is not necessarily a ticket to handling the epidemic better. The nation’s highly-educated and well-to-do communities — the Urban Suburbs, Big Cities, and Exurbs — tend to do well. But a closer look at the five ACP community types with the lowest death rates per 100,000 people reveals a much more complicated picture, as the graphic below shows.
Overall, the Aging Farmlands stand out in the data, with an age-adjusted death rate of just 35.4 per 100,000 people. The densely-packed, diverse Big Cities don’t match that. Yet those rural counties look almost nothing like the educated urban enclaves on the list. Only about 21% of the adults in the Aging Farmlands have a four-year college degree. And the median household income, $51,800, is $10,000 below the amount in the Big Cities, and $20,000-or-more below the median household income rates in the Urban Suburbs and Exurbs.
Similar points hold true for the African American South, where only about 21% of adults have a four-year degree and the median household income is even lower, about $44,300. (That figure is far below the national median household income, $60,300.) Those African American South communities also have a relatively high unemployment rate, 7.8% from 2014 to 2018, compared to 5.8% percent nationally. Despite those educational and economic challenges, the African American South comes in below the national average on Deaths of Despair.
In other words, the traditional measures of socioeconomic prosperity do not necessarily mean communities fare better in the Deaths of Despair epidemic. Community types with higher median incomes and more degrees perform worse than the Aging Farmlands and African American South. In some cases, they perform much worse.
The Aging Farmlands and African American South do have their trouble spots around people ending their own lives. While both have low rates of death associated with drugs, as mentioned above, the African American South’s death rate from suicide is slightly higher than average, while the Aging Farmlands’ suicide rate is quite a bit higher than the national figure — 18.2 per 100,000 versus 13.5 per 100,000 nationally.
It could be that the overall Deaths of Despair numbers are lower in these communities because their economic situations and rural locales make accessing some drugs more difficult. Other drugs, like meth, are cheaper and more readily available.
The data suggest other elements in these communities must be making a difference, perhaps by promoting greater social cohesion and meaning. One possibility is the impact of religion.
Both the Aging Farmlands and the African American South have high religious adherence rates, 75% and 57% respectively, according to the American Religion Data Archive. Those numbers are solidly above the 49% national figure for religious adherence and also above the religion figures for the wealthier, better-educated top performing types. The faiths that dominate the Aging Farmlands and African American South are very different, but they have a common impact — helping stitch the communities together.
To be clear, religious adherence alone doesn’t appear to hold down Deaths of Despair figures. Other community types with large religious populations — the Evangelical Hubs and LDS Enclaves — have much higher Death of Despair rates per 100,000. But the specific religious traditions in the Aging Farmlands and African American South seem to be vital in holding these largely rural communities together.
Looking Forward
In the coming months, veteran reporter Ray Suarez will travel to Montana and Georgia, two states of focus in this effort, to look at how Deaths of Despair have impacted specific Native American Lands and African American South counties.
It seems so long ago, but it was only late February when the Covid-19 virus first arrived in the United States and quickly spread to North Texas. Less than four frightening months later, we still face uncertainty about a “second wave” occurring in summer or early fall.
The potential threat of Covid-19’s spread increased significantly in late March, forcing hospitals, private practices, and clinics to reduce procedures and surgeries deemed non-emergency. This strategy was an attempt to conserve bed capacity for the expected surge in patients. Unexpectedly, many people suddenly feared seeking medical treatment because they were afraid of contracting Covid-19 in hospitals or clinics.
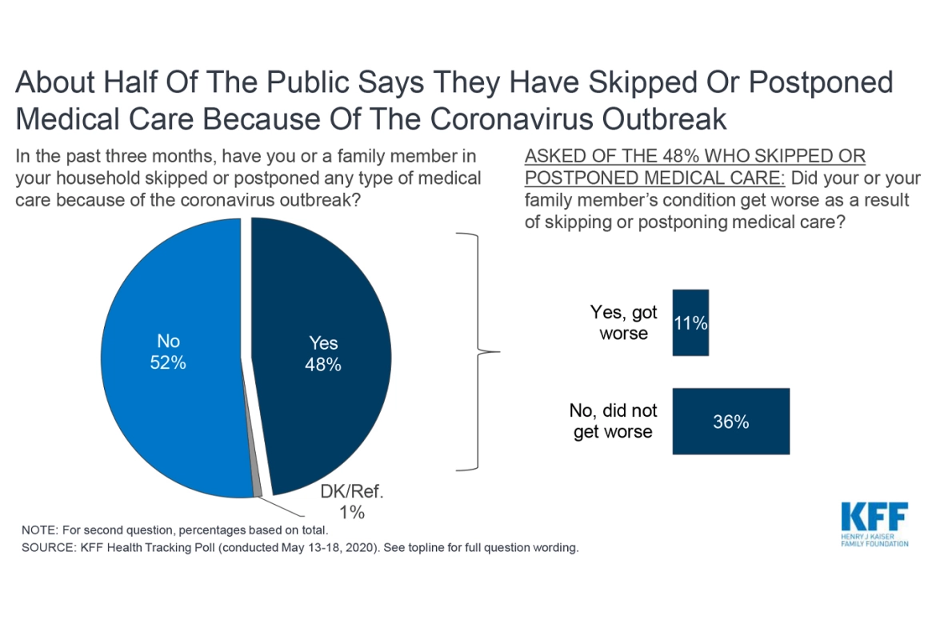
A recent Kaiser Family Foundation tracking poll showed that approximately half of the public stated they had skipped or postponed medical care due to the Covid-19 outbreak. The poll also asked people who skipped or postponed surgery if their medical conditions had become increasingly worse, with 11% responding “yes.”
In the “Morbidity and Mortality Weekly Report” released June 3, 2020, the Centers for Disease Control and Prevention stated, “During an early 4-week interval in the COVID-19 pandemic, emergency department (ED) visits were substantially lower than during the same period during the previous year.”
According to the report, the striking decline in ED visits in the U.S., with the highest decreases in regions where the pandemic was most severe in April, suggest the pandemic has altered the public’s use of the ED. In addition, residents who use the ED as a safety net because they lack access to primary care might be disproportionately affected because of their concerns about Covid-19.
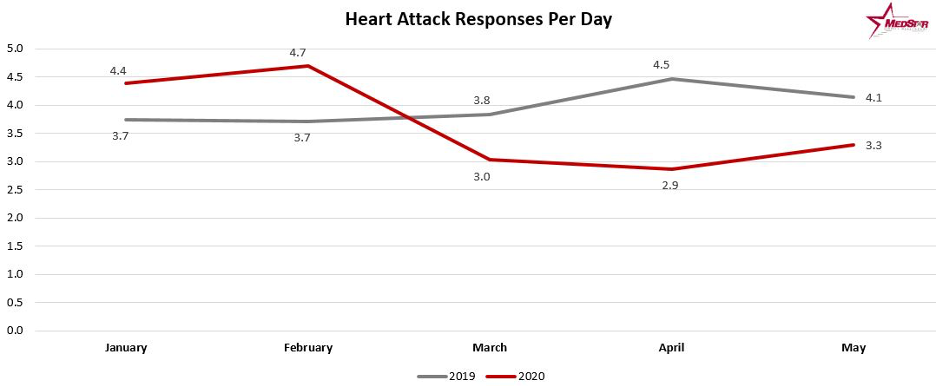
Such fears had wide ramifications as many people afraid to call 9-1-1 for chest pain and numbness in their arms were experiencing severe cardiac episodes and strokes. In Fort Worth, Texas MedStar Mobile Healthcare reported cardiac arrest cases were up 55% in May 2020 compared to the same time last year. Of those cardiac arrest patients, numbers for those pronounced dead on scene were up a staggering 65%.
The Medstar data also reflected a 21% decrease in calls for heart attacks. This is similar to national trends as a survey of more than 860 Emergency Medical Services (EMS) agencies conducted by the National Association of Emergency Medical Technicians found 61% of EMS agencies reporting decreases in responses, with an overall U.S. average of 35%.
Increasingly, hospitals and health systems are concerned about the growing numbers of adverse patient outcomes due to hesitant delays to call 9-1-1. In reality, ambulances and hospitals are perhaps the safest places to be during the Covid-19 pandemic. Health-care professionals are rigorously tested and trained to treat the virus while using the latest infection control procedures.
In the Kaiser Family Foundation report, Dr. William Jaquis, president of the American College of Emergency Physicians, said the anecdotes he’s heard of people delaying care have been troubling, with patients suffering heart attacks and strokes at home. He urged people not to skip going to the emergency room.
“Don’t sit home and have a bad outcome,” Jaquis said.
Research from Cigna revealed similar results, suggesting patients may be deferring care for acute conditions due to concerns over Covid-19. Cigna’s research also disclosed that hospitalization rates had decreased.
“Reductions in hospitalizations for non-elective conditions such as acute coronary syndromes and transient ischemic attacks raise the possibility that patients may be deferring necessary elements of clinical care,” said Saif Rathore, Cigna’s head of data and analytics innovation. “We believe this data calls for efforts to ensure patients continue to seek critical care during the Covid-19 pandemic.”
No matter the research or U.S. region, everyone’s health appears to be impacted by the ongoing fear of Covid-19. Unfortunately, the virus will be with us for a while. During this trying time of a “new normal,” we cannot lose sight of continuing our crucial non-Covid-19 treatments. Such fears could cost us additional lives, including your own.
Stephen Love is President/CEO of the Dallas-Fort Worth Hospital Council.
No matter where protests have been going on during the pandemic or what the cause is, the vast majority of Americans, 80%, worry these gatherings will trigger a second wave of the coronavirus. The worry over a second wave tips to the mid-80s in the more homogenous Middle Suburbs and Exurbs, according to an American Communities Project analysis of a recent Dynata survey. These suburbs generally have not borne the brunt of the virus to date. Communities also see the risks of any kind of protest differently. Generally, older Middle Suburbs are most concerned about risk while younger College Towns and Military Posts are least concerned.
Most and Least Worried by Community
Among the questions Dynata asked Americans: “How worried are you that the protests which have been happening around the country, including those against coronavirus restrictions or those against mistreatment of minorities such as African Americans, will trigger a second wave of the coronavirus?”
In the Exurbs, 49% answered they are “very worried.” Comparatively, in Big Cities, where some protests over police brutality and racism have swelled to tens of thousands of people in close proximity for multiple days, 43% reported being “very worried.”
While the worry crosses communities, there are places where sizable numbers are unfazed. About 13% of Americans nationwide said they are “not at all” worried. In young and mobile communities (College Towns and Military Posts), 15% said they are “not at all” worried. By and large, young people are considered less susceptible to the virus, and fewer residents in college and military locales have underlying health conditions that put them at greater risk. Moreover, if the young and mobile are not mixing with older residents in their daily activities, they may feel more at ease about the virus.
These favorable health and environmental conditions do not hold in minority centers (African American South, Hispanic Centers, and Native American Lands), where 15% also said they are “not at all” worried. These communities have been hard hit by the virus in part due to residents’ underlying health conditions as well as housing and essential worker challenges, including being in close quarters, unable to socially distance. At the same time, disseminating information about the virus to these communities has been uneven to poor.
On the question of people’s feelings about the protests (of any kind) happening around the country during the pandemic, risk is the main concern. Nationwide, 43% of Americans agreed that “it’s too risky to have large protests during the pandemic.” The figure climbs to a high of 50% in the middle-income, average-educated Middle Suburbs; affluent, well-educated, multicultural Urban Suburbs are next at 44%. It’s worth noting that these places are located in metropolitan media markets, where newscasts show teeming crowds in adjacent Big Cities, with and without face masks, day after day, along with reminders about the dangers of not socially distancing.
In young and mobile communities, the response “too risky” hits a low of 36%.
In minority centers, 18% said “it is definitely worth the risk to have large protests during the pandemic.” The next highest are diverse, stratified Big Cities at 15%. These community types are perhaps most deeply and broadly impacted by the way people of color are treated.
What also surfaces in this question is the general acceptability of large protests. On this point, 9% of Americans said “large protests are never acceptable.” Most community types hover around this marker. In Big Cities, it drops to around 7%, perhaps because such protests are more prevalent — and visible. Whereas, in rural white communities (made up of Aging Farmlands, Evangelical Hubs, Graying America, LDS Enclaves, Rural Middle America, and Working Class Country) 12% said “large protests are never acceptable.” Given that, it’s not hard to see how reestablishing order may be a message that resonates with a slice of America.
Protesting Over Orders
Protesting stay-at-home orders is also unpopular with a wide swath of Americans. Nearly 50% said they disapprove of the protests over orders to stay at home and close non-essential businesses.
The question to survey participants: “You may have seen in the news that some people are protesting orders to stay at home, closing of non-essential businesses and other social distancing efforts. To what degree do you approve or disapprove of these protests?”
The Middle Suburbs had the strongest negative reaction to the protests. In these 77 counties located around the major Northeast and Midwest cities, 56% said they disapprove, with 40% saying they “strongly disapprove.” In the Exurbs, 52% said they disapprove, with 34% saying they “strongly disapprove.”
At the same time, Exurbs have the highest percentage of people who said they approve these protests at 27%. Note that many people in Exurbs reside in areas of lower population density. Social proximity is a key contributor to the spread of the coronavirus. Greater approval follows in diverse Big Cities at 25% and less-virus-impacted young and mobile communities at 22%.
Strong Views About Armed Protests
A majority of Americans disapprove of the armed protests that have taken place over stay-at-home orders. Nationwide, 59% of Americans said they disapprove of the armed protests. Urban Suburbs and young and mobile communities also stand at 59%.The number jumps to 63% in the Middle Suburbs and 64% in the Exurbs.
The question: “In some places heavily armed protesters have gathered in public spaces such as legislative buildings to protest orders to stay at home and enforcement of other social distancing efforts. To what degree do you approve or disapprove of these armed protests?”
Overall, 18% of Americans said they approve of these armed protests. Approval reaches 23% in minority communities, 20% in the Middle Suburbs, and 20% in Big Cities, showing the split views in these communities.
As states have lifted stay-at-home orders while many continue to restrict business, this issue has receded. Time will tell whether Americans’ worries about protests will amount to more Covid-19 cases in the coming weeks.
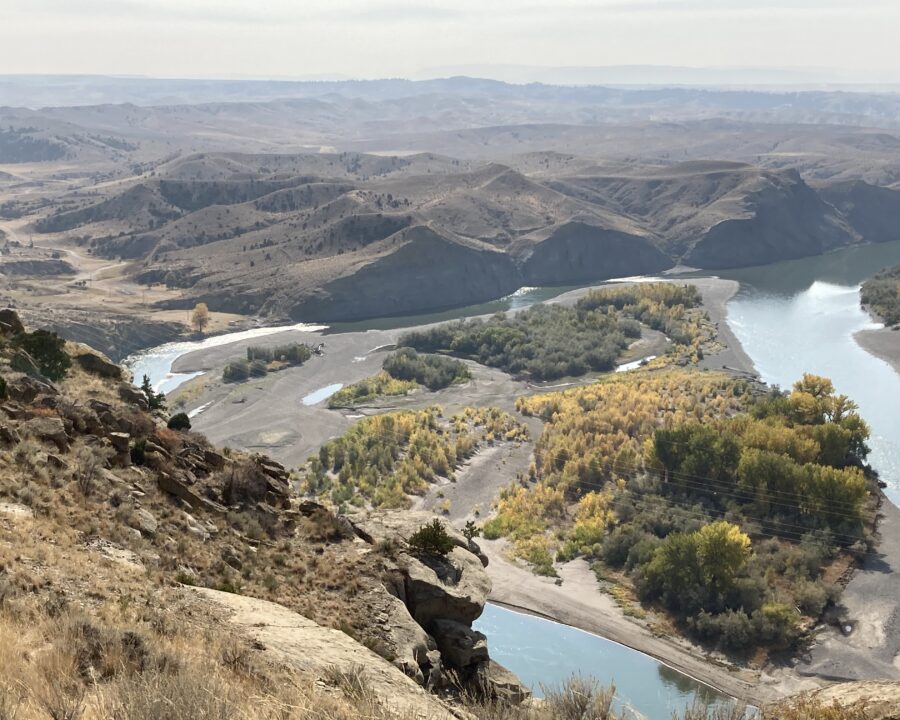
As the nation heads into a summer of “reopening” after the Covid-19 shutdown, many Americans are heading off on summer vacations — and some communities in the ACP face unique challenges.
Travel means people from different places coming into contact with one another. In particular, resort communities — places with a large number of second homes — are likely to see more new arrivals through second-home owners and renters.
Where Second Homes Are Plentiful
In the ACP, the counties called Graying America look like they are more exposed to potential trouble this summer. Nearly 20% of the homes in Graying America are second homes, according to an ACP analysis of Census data from the Center on Rural Innovation.
That number stands out far above the rest of the community types in the ACP. The only other types in double digits are the Native American Lands at 11.2% and Working Class Country at 11%.
In these community types, high second-home percentages are likely directly related to their locations. Graying America counties are largely scattered in rural areas in the North, Mountain West, and Florida, particularly near the shoreline. Many Native American Lands are clustered in Arizona, New Mexico, and Montana. Working Class Country counties are mostly located in the upper Great Lakes and throughout Appalachia. All are locations where people tend to own cabins, condos, and cottages for getaways.
(You can see the locations below. Graying America is navy blue, Native American Lands are bright yellow, and Working Class Country is brown.)
Health Challenges in Graying America and Native American Lands
More travelers to Graying America and Native American Lands could pose special challenges to those places. Both hold populations that are more vulnerable to the virus — older people and those with underlying health conditions.
As the name suggests, Graying America stands out by the age of its residents. About a quarter are 65 or older in the median Graying America county compared with the national average of 16%.
The Native American Lands score high for adult obesity, 36% in the median county, and are also high above the national average for uninsured people, 18% in the median county versus a national average of 10%.
On top of those health concerns, both community types have a limited number of ICU beds in case of coronavirus spikes. Of the 364 counties in Graying America, only 135 have any ICU beds. The numbers are even sparser in the Native American Lands’ 44 counties: Only six have any ICU beds.
Opening to Visitors, Safely
As summer vacation arrives, Native American Lands and Graying America communities face crucial decisions.
Native American Lands are home to Indian reservations, which can make their own rules about visitors. And, of course, any community can tighten restrictions as they see fit. But the high numbers of second homes in both Native American Lands and Graying America mean many of these counties need tourism dollars to thrive economically.
Now they face questions around how far to open the door in welcoming visitors. How do they handle seating in restaurants and capacity levels in stores? How do they weigh the goals of making visitors feel safe as well as socially comfortable?
For that reason, these community types will be important to watch this summer as the Covid story turns to the topic of second waves and hot spots. Graying America and the Native American Lands are in an especially challenging position.
In times of a pandemic, the phrase “essential worker” can offer a sense of security. It means you’re insulated from at least some of the economic tumult that has come with the Covid-19 virus.
But a look at essential workers in the American Communities Project’s 15 county types shows that being an essential worker is not necessarily as positive as it appears to be. The communities with the highest numbers of essential workers are not those with the highest incomes or levels of educational attainment.
Rather, the data show that rural communities and those with large minority populations tend to have the largest percentage of “essential employees.” The African-American South, Hispanic Centers, Native American Lands and the Aging Farmlands all have more than 59% of their employees in essential positions on average. Meanwhile, the smallest percentage of essential workers — all under 49% — are in the Urban Suburbs, Exurbs, and College Towns places with higher educational attainment rates and more dynamic economies.
First, a lot of high-paying jobs that require a college education — everything from lawyers and consultants to software engineers — have not been deemed essential by government entities during the pandemic, but they are good jobs that pay well. And, perhaps more important, even though they are not essential, they can still be done remotely.
Many of those jobs have moved from the downtown office to the home office — or the couch. Even as offices have shuttered, temporarily, workers with higher-skill, knowledge economy jobs are better positioned to ride out work-from-home orders. Those people are more likely to live in Urban Suburbs, Exurbs, and College Towns, as well as Big Cities.
On the other side of the equation, many of the “essential jobs” during the pandemic are as high-end as many imagine. While the mind might go to front-line health-care workers such as doctors and nurses, there are also plenty of people working in other areas away from hospitals and ambulances.
The Department of Homeland Security describes “essential employees” as workers who conduct “a range of operations and services that are typically essential to continued critical infrastructure viability.” Included are jobs in industries such as “medical and healthcare, telecommunications, information technology systems, defense” but also “food and agriculture, transportation and logistics, energy, water and wastewater.”
Essential — With New Risks
To be clear, those jobs, such as truck drivers, trash collectors, grocery store clerks, and managers, are all important and essential jobs during the Covid-19 outbreak, but they are not all well-compensated positions where life-and-death decisions tend to be part of daily work. There is a group of workers in the pandemic who are facing increased danger in their daily lives who did not go into their jobs looking for that kind of risk — and who are not compensated for it.
And the communities with the highest numbers of “essential jobs” in the ACP are likely to have those positions of the lower-paying, less-technical variety. (We noted recently that some of the biggest spikes in Hispanic Centers have been taking place in communities with meat-packing facilities.)
Those community types with the most essential jobs are below the national average in educational attainment and median household income, with the communities with large minority populations scoring low on those education and income measures.
For the most part, these are not wealthy, highly-educated places and the communities with large minority populations in particular have high uninsured rates — all above 14% of the population.
The numbers all serve as important reminders as the pandemic stretches on and reaches more into rural areas. There may be more job security in some communities and types of communities, but that job security comes with added risks and challenges.
During the past month, the spread of the Covid-19 virus has taken a turn across the country with two major impacts, as seen in the American Communities Project: Rural communities are seeing some of the biggest growth in cases, and Hispanic Centers and Native American Lands are seeing their infections skyrocket.
While the nation’s attention has been focused on New York City’s success in bending the curve during the pandemic, many communities in the ACP are living through very different realities. The infection numbers for the last month, combined with data on the number of ICU beds in each type, show serious challenges may be looming, particularly as some places relax restrictions on travel and business operations.
The Overall Picture
The virus’s move from urban areas and into more rural locales can be seen in the percentages of coronavirus cases in each of the ACP’s 15 types.
Only two community types saw declines in their case percentages: Big Cities and the Urban Suburbs, the two most densely populated types in the ACP. Meanwhile, four community types saw increases in the last month as a percentage of the total number of cases in the country: Exurbs, College Towns, Hispanic Centers, and Rural Middle America.
To be clear, cases were up in all types, but they were up more sharply in some than others, which led to the percentage gains and losses.
The increases in the Exurbs and Rural Middle America suggest that the virus continues to move out of population centers into the next ring of population density. The Exurbs, generally on the fringes of urban centers, and Rural Middle America communities, considered small-town hubs, would logically be the next stops for virus spread.
The increase in cases in College Towns is more complicated. Many colleges and universities sent students home in March, so, in theory, the big increases there are happening even after the population has contracted. That may be something for schools to consider as they weigh whether to open their campuses this fall. (Already this week, the California State University system announced that fall classes will take place online.)
The jump in the Hispanic Centers may be in part due to the location of those communities. The southwestern states have seen some sharp increases in the last month — more on those communities below.
Especially Large Case Jumps
Three community types stand out for their numbers of confirmed cases: Hispanic Centers, Native American Lands, and Rural Middle America. In all three types, Covid-19 cases climbed by more than 300% in the last month, compared to the national increase of 140%.
Those increases likely have different drivers.
Rural Middle America
In Rural Middle America, it’s the sheer number of locales adding up to a big tally. Almost 600 counties fall into the category, and the increases in most have been slow and steady. In the group, 70 counties have had no increases. Another 230 counties have increased their caseloads by 10 or fewer. One group of 65 counties has been hit harder, with increases of 100 or more.
In that way, Rural Middle America’s increase seems to largely follow the expected infection pattern: a small selection of hot spots and a few places with more serious issues while a slower spread dominates elsewhere.
Hispanic Centers
In Hispanic Centers, the story is different. While there are only 161 Hispanic Center counties around the country, 20% of them have seen increases of 100 or more cases in the last month, and these are scattered around the country. A few examples:
Yakima County, Washington, saw an increase of more than 1,200 cases.
Moore County, Texas, increased by 500 cases.
Dawson County, Nebraska, had a bump of roughly 700 cases.
Nobles County, Minnesota, went from 0 cases to more than 1,200.
One thing these Hispanic Centers and others share: meat-packing plants. The tightly packed factory floors and limited protective gear in many of those facilities have created a big story during the pandemic.
Add in that Hispanic Centers tend to have higher rates of uninsured people — 19% for the median county versus a national average of 10%, according to the Robert Wood Johnson Foundation’s County Health Rankings and Roadmaps. Thus, one can see how the numbers there can grow quickly when the virus arrives. Lack of insurance usually means fewer visits to the doctor and a less healthy community overall.
Native American Lands
For the Native American Lands, the increase in cases is largely driven by just a few of the type’s 44 counties. Nearly half of the counties, 20, saw no increase in cases in the last month. At the same time, only six counties saw increases of 100 or more.
But the jumps were not just about one region of the county or one reservation. The biggest increases were in McKinley and San Juan counties in New Mexico and Navajo and Apache counties in Arizona. But Robeson County, North Carolina, is next on the list, followed by San Juan County, Utah. And Adair County, Oklahoma, is not far behind with 45 new cases.
The numbers suggest that once the virus moves into these communities, it can spread quickly. Higher-than-average obesity rates and lower-than-average insurance rates only add to the problem in these communities.
The larger point in the data, however, is that the Covid-19 story is far from over. Summer travel season is arriving. The combination of a vacation-seeking public and states with looser virus health guidelines could create a long list of challenges this summer — as well as the potential for more hot spots to pop up around the country.
Those are just a few of the issues the ACP will be watching as the story around the pandemic evolves.
As the Covid-19 pandemic rages on worldwide, New Zealand’s Prime Minister Jacinda Ardern, 39, is earning praise for her government’s swift and compassionate response to the virus — now practically eradicated from the country. Well before the global crisis hit, Ardern was interviewed by Michelle King and appears in King’s new book The Fix: Overcome the Invisible Barriers That Are Holding Women Back at Work. King asked: “What do you want your government to be known for?” Ardern replied: “I want our government to be known to have been kind.”
What can leaders and workplaces take from Ardern’s example? As King sees it, Ardern speaks to a different leadership model based on values, one that’s vital for current and future workplaces to be successful. I spoke to King recently about cutting through the denial of workplace inequality, considering the MeToo movement’s impact, and closing inequities. What’s crucial is to listen to the diversity of lived experiences, throw off old notions of the ideal leader and worker, and create cultures of equality that harness employees’ differences for our emergent era. Excerpts of our interview are below.
As background, the American Communities Project recently analyzed December 2019 survey results from Dynata about the state of the MeToo movement across the country and within community types. On average, 42% of Americans say MeToo has done its job; 36% say it’s gone too far; 22% say it hasn’t gone far enough. However, opinions look different at the community type level. More than a quarter of people in Hispanic Centers and the African American South say the movement needs to go further. In two small rural communities, Aging Farmlands and LDS Enclaves, a clear majority of people believe MeToo has gone too far.
Which of the following best represents your feelings about the MeToo movement?
As the table above shows, people’s feelings markedly differ by community type.
Below King shares how she sees the MeToo movement as well as how organizations deny gender biases, how they can improve their cultures, and why it’s necessary.
Impact of the MeToo movement on workplaces
I’m not a spokesperson for MeToo, but I would just say it’s raised awareness and disrupted people’s denial around how we still have a really long way to go. The MeToo movement is advocating for what I see as the fundamental human right, which is to feel safe at work. That’s the bare minimum. I think a lot of women and men were kind of shocked to realize that we’ve got a long way to go. I think by the time people are raising sexual harassment and assault issues in your workplace, you have lost; your culture is broken, and it needs to be fundamentally fixed.
This is a cultural issue because in every one of those instances somebody could have spoken up, somebody could have said something, somebody could have been an ally, but they didn’t have the right environment that enabled that.
How denial of inequality manifests in the workplace
I’ve been doing a lot of work on this recently for my PhD paper. I think it starts with the general lack of awareness about how inequality works. Normally you’ll see that with the belief that it’s a workplace with a meritocracy. An example of how that plays out now is the willful blindness we see in workplaces when it comes to the challenges of how Covid-19 is detrimentally impacting the productivity of mothers. It’s detrimentally impacting black colleagues because of systemic racism and issues related to health around that.
There’s this willful blindness around how not all experiences of the pandemic are the same. And even though companies may acknowledge it, or occasionally pay lip service to it, there’s this tendency to be like OK, business as usual. And let’s just have the meetings; let’s just require everybody to be at the same standard while ignoring that the playing field is not level. A lot of mothers are the primary dependent caregivers. That creates tremendous challenges for working mothers.
But what we also see just more generally in relation to gender denial is the denial of difference or different experiences of work. So you’ll be hearing managers say things like the workplace is a meritocracy. You’ll hear them say women don’t experience any barriers. I mean I’ve got loads of men writing to me as my book’s come out, making all sorts of comments around the invisible barriers because there’s just this belief that if you work hard you’ll succeed, right, that all the biases and prejudices that we had before we stepped into workplaces somehow disappear. And it’s simply nonsense.
Why storytelling breaks through denial
Storytelling is a key. We’ve had these really annoying business cases around diversity and inclusion for years. The reality is that does nothing; it just leads to token efforts, around quotas, or what I call women-fixing, women leadership development programs, mentoring, anything that helps women fit into workplaces that don’t really value them in the first place.
Storytelling is actually one of the tools you have for disrupting all of that because it shows you the lived experience of workplaces. In my book, I share many, like the time my boss just threw a dish towel at me and told me to wash the dishes in the sink because I was the only woman on the team. And nobody said anything. Everyone had this muffled laugh.
Or the time that I was working, and this isn’t in my book, but I was working for very large organization and I was pregnant with my second child, and the CFO I was working for said to me, this is why I don’t like hiring women because they go off and have babies.
You have those moments, where you’re kind of slapped with prejudice and discrimination. It’s in those moments that you realize, oh, this workplace doesn’t work for me in the same way that it does you because you don’t value me. It all comes down to value and the way in which we value each other. I think storytelling compels us to want to fix inequality that we know our colleagues are experiencing.
How King employed storytelling to show inequality
Author Michelle King, who’s now director of inclusion at Netflix.
I used the power of storytelling when I was doing my PhD and working with the senior male partner in this professional services firm who denied my research. I had surveyed over 1,000 men and women in this organization. I had countless hours of interviews. I had so many data points, and I could point to all of them and say look, overwhelmingly 87% of women and men are saying the organization is gendered and that creates challenges for them. And he just ignored it. He was like, I don’t believe your data points; you have biases. These data points aren’t great; he just came up with every excuse to not look at it.
I said I’ll tell you what, maybe all of what you’re saying is true. So why don’t we just step back from this and to test what I’m saying is actually correct and my research is correct? Why don’t you go out and speak to two or three women that you trust in your workplace, and ask them about their lived experience, and ask them whether they’ve witnessed or experienced inequality moments throughout their careers? Ask them if this data resonates. And he did, and he was blown away. I mean these were women he worked with every day, who he trusted, who had never once spoken up and told him just how different their experience in the work environment was.
And that was the catalyst to shift his denial and get him to a place where he was like wow; actually I’m a leader and I’m responsible for this experience of the people who work for me, and they’re not enjoying this experience, so I’ve got to do something. That’s where I met him on his journey to wanting to create a culture of equality.
Why Don Draper from Mad Men matters
I love Don, because I think Don in my book is such a good example of how prototypes work. Most organizations are hardwired for an ideal type of leader. When you think of what good looks like, pretty much in any organization, research over 30 years in any geographical context has shown that you’re going to think of a white, middle-class, heterosexual, able-bodied male.
But importantly, you’re also going to think of somebody who is willing to engage in dominant, assertive, aggressive, competitive, and even exclusionary behaviors to get ahead. The problem in organizations when that’s the ideal — and it’s been ideal standard since the 1950s — is leaders lead in that way. They encourage employees to behave in that way, and then that creates entire cultures that reflect those behaviors as values. That’s really what creates inequality because the more ways that you differ from this Don Draper-ideal, the more barriers you’re going to face trying to advance at work. And the more ways you’re similar, the more privilege you have because it’s easier. It’s an unearned benefit you get from naturally fitting the ideal standard.
The Don Draper-ideal standard came about in the 1950s with Ford Motor Company, and it might have served us when workplaces were pretty much all men — it doesn’t serve us today. When I think of COVID-19 and the types of leadership behaviors we need to manage remote workforces, the old-school, command and control, transactional style of leadership just doesn’t work. We need leaders who can be transformational, leaders who can be empathetic, who can be democratic, who can be caring, and those are behaviors typically associated with women leaders.
Social capital’s significance in the workplace
My PhD is actually on organizational politics, which is when you engage in the political aspects of work that are inevitable for how organizations function. You do that to gain social capital. Think of it like a bank, and you build up enough credit with your colleagues at work so that when you need something or you want something, you can go and cash it in, right. You build up that goodwill through developing relationships, forming coalitions, supporting your colleagues when they need it.
It’s a lot easier to build those relationships if you are similar to individuals in terms of values, but also in terms of backgrounds. So if you look the same, think the same, act the same, went to the same school, it’s easier to develop that relationship. It’s easier to cultivate social capital. That’s why the political aspects of work are incredibly unfair because they enable individuals to develop with access to networks like the boys’ club or form relationships with powerful people, and it’s often to the detriment of underrepresented groups in organizations who don’t have their race or gender or ethnicity or economic background in common with people who are in positions of power.
It’s such a great example of how workplaces are not equal and why hard work doesn’t necessarily guarantee success because you can do everything right, but still not advance because you don’t have the needed social capital to get that promotion or to get access to the high-profile development opportunity.
So social capital in organizations is everything, far more important than IQ or EQ, but getting it is what can be incredibly challenging for individuals who come from underrepresented groups.
How to value mothers
As The Fix states: “Mothers suffer a per-child wage penalty of approximately 5 percent per child on average after controlling for the usual factors that affect wages.”
The one thing that works with the motherhood penalty, and it’s so frustrating because we don’t talk about it enough, is publishing salary data. When you publish your salary data, you’re accountable for closing the gap. In my book I’ve got some case studies that have done this. Making that public commitment to opening up the books and showing people where the gaps are and how they’re going to close them, that’s how you do it. We shouldn’t have these pay gaps. We shouldn’t be devaluing mothers because they most strongly are the antithesis of Don Draper.
It’s just frustrating that organizations devalue women, particularly when a study by the same Federal Reserve Bank of St. Louis came out showing that over a 30-year period, mothers are the most productive workers, and particularly mothers of two children. Now any mom reading this article is going to be like, well, of course, it makes complete sense because we know how hard we have to work and how efficient we have to become, right; these are life skills.
It starts with creating cultures that value mothers. It’s not enough to have a flexible workplace policy in place, or maternity leave; you have to create a working environment that fundamentally values the contributions that mothers bring.
Navigating workplaces today
I think you’ve got to choose your company wisely. I make it a practice now when I’m interviewing for a job to really ask the leaders in organizations how they practice equality, what inclusion means to them, where or how they’re personally committed to it, what do they do day-to-day to create cultures of inclusion.
For people who are being passed over if you’re already in an organization, it’s very hard to advocate for yourself, as I share in the book with Sarah. I actually advocated for her. That’s why we need to develop cultures of allies, where we can be allies to one another. It’s much easier for women to advocate for one another.
I also don’t like asking underrepresented groups to advocate or solve inequality they had no part in creating, so this is more about those in positions of power and privilege, particularly white males. They can spend that privilege by really speaking out and advocating for women, asking why, when they’re confronted with decisions that seem to be biased, and pushing organizations to think differently.
Why companies with cultures of equality will outcompete their peers
It’s really basic; companies that have cultural equality will outcompete their peers because they will be more innovative. They’ll have different perspectives around the table that they value and so they’ll be able to utilize those different perspectives to achieve better outcomes. We see this play out in that Accenture study that showed in cultures of equality, companies are six times more likely to have employees that have an innovation mindset.
You’re just more likely to create the right environment for innovation, which is needed in the future world of work because we’ve got changes coming, disruptive changes. It’s not just Covid-19, but AI, robotics, nanotechnology. That’s going to happen in the next three to five years. The companies really have to get with it.
Don Draper is not going to serve us in the organization of the future. We need transformational leaders. We need empathetic leaders, leaders that have the cognitive, behavioral, and emotional flexibility to lead in different ways and adapt to change and be responsive.
More than six weeks into the Covid-19 pandemic, the virus’s impact on daily life differs sharply by community on everything from life impacts to actions taken, but there are some commonalities too, particularly in America’s kitchens where cooking has replaced eating out.
Currently, concern for health is top of mind for Americans. Nearly 90% of people across communities say they are “a little” or “very concerned” about the health of their family and express the same for people outside of their family, according to a mid-April survey of 2,100 people from Dynata, the world’s largest first-party survey insights company. (Dynata grouped some of the ACP’s 15 community types together in the cases of small sample sizes.)
But below that top level, some differences emerge, with rural white communities generally standing apart from other places.
Where Are People Washing Hands and Wearing Masks?
How are people protecting themselves and others now? Mostly adhering to the hand-hygiene guidelines of the Centers for Disease Control. More than 75% of people across communities say they are washing their hands “more” or “much more”; the range runs from 77% in rural white communities to 85% in young and mobile communities. Big Cities, which include the hardest hit communities of New York City, Chicago, New Orleans, and Detroit, come in at 82%.
Wearing a face mask is less widespread — 58% of Americans say they have done so. The range is much wider when comparing community types, from 65% in the dense Big Cities and Urban Suburbs to 49% among rural white communities, where social distancing is typically easier.
Daily Life Impacts Today and Tomorrow
At this point, more Americans in Big Cities, Urban Suburbs, Exurbs, Middle Suburbs, and minority centers (including the African American South, Hispanic Centers, and Native American Lands) say the coronavirus has impacted their family’s day-to-day life than those in rural white communities (encompassing Aging Farmlands, Evangelical Hubs, Graying America, LDS Enclaves, and Rural Middle America).
The percentage of Americans who say the coronavirus has changed their family’s life in “a very major way” or “a fairly major way” ranges significantly among communities. On the high end are Urban Suburbs and Middle Suburbs at 80%; in the middle are young and mobile communities (College Towns and Military Posts) at 75% and Big Cities at 73%; and on the low end, rural whites at 68%. The cities and suburbs abutting cities have seen the most cases and losses so far.
This schism between rural whites and all others holds when looking at future daily impacts, but is seen most severely in the Urban Suburbs (74%), Middle Suburbs (71%), and Big Cities (70%) compared with rural white communities (59%). Yet all point toward turning a corner as time goes by.
At Home, Cooking
Cooking meatballs for dinner in an Exurb. All photos by Ari Pinkus.
Being home and cooking are two important ways day-to-day life has changed for many. As more than 40 states are still under stay-at-home orders, 86% of Americans say they are spending more time at home. Community type by community type, the percentage remains in the 80s, except for minority centers (74%), where many residents work on the front lines, in stores, in meat-packing plants, and other industries in which it’s not possible to work from home.
With folks at home more, many suffering financially, and restaurants closed or only open for takeout and/or delivery, it’s not surprising that more people are cooking at home during this time — but the high percentage across the board is noteworthy. On average, 72% of Americans say they’re cooking at home “more” or “much more” due to the coronavirus. The trend is especially pronounced in the Middle Suburbs and Exurbs, where about 76% of residents report cooking at home “more” or “much more.” Not too far behind are young and mobile communities at 74% and Urban Suburbs at 73%. That may be because those communities have higher incomes and more restaurants near them so eating out was a bigger part of their lives. In rural white communities, the figure dips to 66%, perhaps because cooking at home was common before.
Beans at a BJ’s in Bucks County, Pennsylvania, an Exurb.
It follows that Americans are buying more food during this time. When it comes to perishable food staples (milk, eggs, bread, produce, etc.), 28% of Americans report purchasing “more” or “much more” of these items. The crowd standouts are Big Cities at 34%, minority centers at 32%, and rural white communities down the spectrum at 17%. For non-perishable food staples (canned foods, cereals, rice, etc.), the average is 35%. Minority centers are on the high end at 43%, with Middle Suburbs just behind at 41%. In Exurbs and rural white communities, just 29% are stocking up on these items.
As the pandemic wears on and social distancing continues through the summer, we’ll be watching to see if the pastime holds and grows — with or without the stay-at-home orders.
The Covid-19 pandemic is spreading across the United States in an uneven way that offers unique insights when viewed through the prism of the American Communities Project. For many Big Cities, the worst is here now. For the rural Aging Farmlands, the worst is likely still to come.
And differences in medical resources in various county types suggest the coming months could bring serious challenges to some communities as the virus moves across the country into different ACP communities. The types are laid out on the map below.
Up to now, stories about the coronavirus have focused on big urban areas and for good reason. As of Monday, the seven counties with the largest numbers of confirmed cases were all in the New York City metro area (four of the five Big City counties in the city and three adjacent Urban Suburbs). But just after those counties were Cook in Illinois (Big City home of Chicago), Wayne in Michigan (Big City home of Detroit), Bergen in New Jersey (Urban Suburb of New York), and Big City Los Angeles.
As of Monday, nearly all of the most urban types in the ACP had at least one case, according to the USAFacts tracker of the virus. In the Urban Suburbs and Exurbs, 97% of the counties had at least one case. In the Middle Suburbs, the figure was 99%. In the Big Cities, all 47 counties had at least one case.
But there is plenty of reason to expect that to change. Over the last three weeks, every one of the 15 types in the ACP has seen big growth in the number of counties with at least one case. In fact, in three weeks, every county type in the ACP has seen the number of impacted counties more than double — except the Big Cities and Urban Suburbs, where the numbers were already high.
As the table shows, some of the growth is massive. The counties of African American South went from being barely affected (29 counties) to more than 90% having a case (344 counties). The pattern looks similar for the Evangelical Hubs, from 16 counties to 311. Even the Working Class Country counties, which tend to be more remote, saw a sharp jump, from 12 counties to 230.
The Spike in the African American South
The Covid-19 jump in the 370 counties that make up the African American South is particularly noteworthy. Outside of the ACP’s urban-oriented types (Big Cities, Urban Suburbs, Middle Suburbs and Exurbs) the African American South had the largest number of cases of the virus as of Monday (more than 15,500) and its high count is not strictly a function of the size of its population.
Rural Middle America holds roughly 5 million more people than the African American South, but those counties only had about 6,100 cases. The College Town communities hold about the same population, but they only had 9,100 cases.
Some of the growth in the African American South may be attributed to those communities holding small towns with somewhat dense populations, making the virus easier to spread. That certainly describes Forrest City Arkansas, in St. Francis County, which the ACP visited last year. St. Francis had 17 confirmed cases of Covid-19 as of Monday.
But another factor is likely the high rates of uninsured people in those communities, about 14% compared to about 10% nationally.
And that growth in cases in the African America South could be particularly problematic because of other health concerns in those communities. The counties of the African American South also have higher than average rates of smoking (21%) and obesity (35%), which are listed as key risk factors for severe cases of Covid-19.
Furthermore, asthma, one of the most serious pre-existing conditions for severe cases of the virus, has a much higher rate of incidence among African Americans. Nearly 11% of that population has asthma and the number is 14% among children.
Challenges in Aging Farmlands and Native American Lands
Some places have seen lower numbers so far. The Aging Farmlands and Native American Lands counties still have fewer than 50% of their counties with a single case, but both have seen big jumps in the last three weeks. The Native American Lands went from two affected counties to 18, and the Aging Farmlands went from one to 37.
And both of those community types face deep challenges if the Covid outbreak hits them hard. County-level figures from Kaiser Health News show a lack of ICU beds in those places.
In the Aging Farmlands, only two counties have any ICU beds at all (Calhoun in Iowa and Walworth in South Dakota), according to the Kaiser Health News data. And there are only six total ICU beds in those counties. That is one for every 29,000 people over the age of 60. (Data show older people are more susceptible to severe cases of the virus).
The ACP recently posted a piece about Covid-19 from the perspective of Gove County, an Aging Farmland community in Kansas that had just recorded its first case of the virus. The concerns there were largely economic. Gove, which relies almost entirely on agriculture, had been struggling of late. But if the coronavirus cases multiply there, the community could face deep health challenges. The Kaiser data show no ICU beds in the county.
The figures aren’t much better for the Native American Lands. The Kaiser data show that only six of those 44 counties have even one ICU bed. There are only 54 ICU beds total in them, that’s one for every 2,800 people over the age of 60. And that doesn’t take into account the other challenges those communities face, including higher rates of diabetes — another condition that can lead to severe cases of the virus.
The Native American Lands are particularly interesting to watch because of reservations’ independence from state government. This structure leaves them uniquely positioned to act on their own.
Thus far the response to the virus has been not been the same in all Native American Lands counties. Some have remained largely open to visitors, while others have closed themselves up, placing guards at entry points and checking IDs. For instance, the Northern Cheyenne Nation, in Rosebud County Montana, has implemented a curfew from 8 p.m. to 6 a.m. and is limiting “traveling in and out of the boundaries” of the area.
In an ordinance, the Northern Cheyenne declared the disease is “an ultimate threat to the Cheyenne way of life and the overall balance of society.” Rosebud County has one hospital and one ICU bed, according to the Kaiser data. It has not yet recorded a case.
Does Virus Spread Differently?
But the larger message in these data is about the spread of the virus in the last three weeks. On March 16, Covid-19 could be found in 481 counties, by April 6 it was in 2,461 counties — that’s more than a fivefold increase.
The real question is whether the virus spreads differently in the communities of the ACP. For instance, Big City counties may tend to have more daily interactions between people, but other communities in the ACP, such as Rural Middle America may have more common meeting spaces — local stores, diners, and cafes — even if there are fewer people visiting them.
Does a rural location with a diffuse population provide additional protection from the virus, even in communities with higher rates of poverty, higher populations with risk factors, and lower rates of health insurance?
The ACP will be watching the numbers in the next few weeks for answers.


 In the “Morbidity and Mortality Weekly Report” released June 3, 2020, the Centers for Disease Control and Prevention stated, “During an early 4-week interval in the COVID-19 pandemic, emergency department (ED) visits were substantially lower than during the same period during the previous year.”
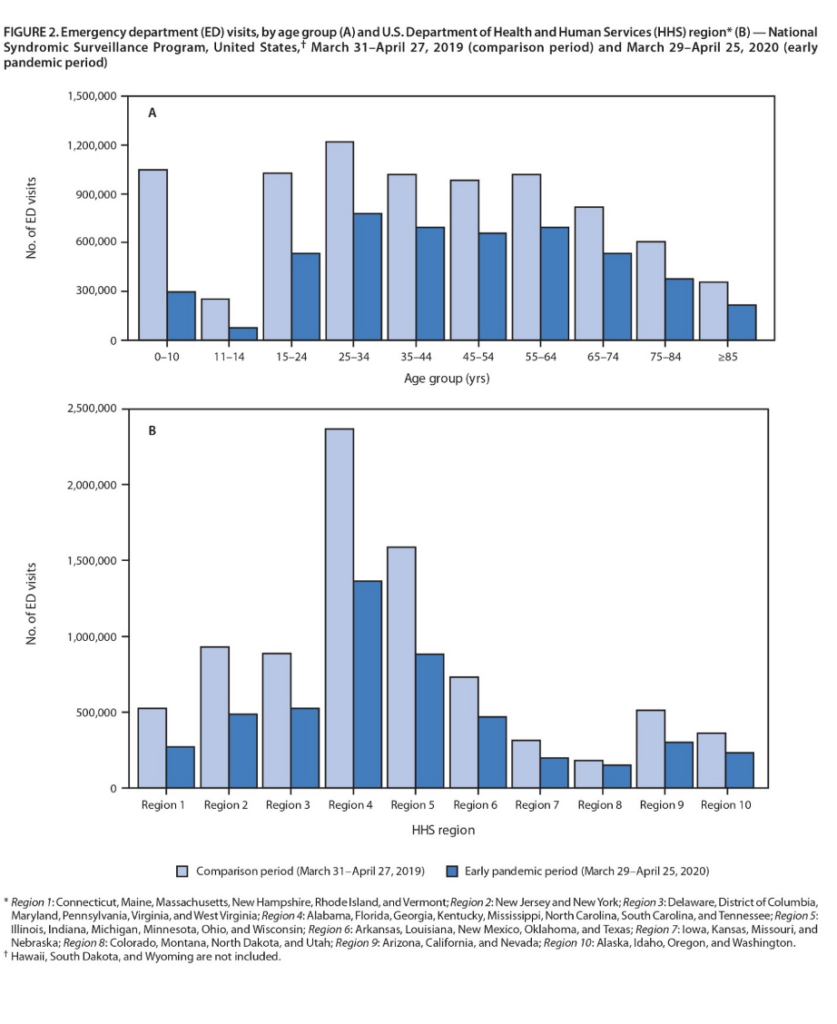
 Stephen Love is President/CEO of the Dallas-Fort Worth Hospital Council.