If you want to understand the complicated nature of the United States in 2023, ask Americans to define their country themselves. In the past year, the American Communities Project did just that. It visited four different counties and asked passersby to define 25 words, including America, and the responses showed a range of opinions.
It’s a “colonized country,” said a Native American woman in New Mexico. It’s “a lot of duplicity, a lot of dichotomy, but, at the end of the day, home,” said an African American radio host in Milwaukee. It’s the “land of the free because of the brave,” according to a veteran in Mississippi. It’s “a beautiful continent,” said a brewer in a Spanish accent in Ohio.
Those are very different interpretations of the United States, and depending on one’s perspective, each is valid. Furthermore, they just scratch the surface of the differences that define the United States. The media tends to explain the divides in United States in binary terms — red/blue, left/right, urban/rural. News stories discuss war between two conflicting “cultures” in the country. Sometimes included is a third option for “independents” or “centrists.” But look closer and the picture is far more complicated, marked by fault lines that can be hard to see.
The American Communities Project has just started to explore what those differences look like with a three-year project funded by the Robert Wood Johnson Foundation and today is releasing the first of three large public opinion surveys conducted with Ipsos. This survey of more than 5,000 Americans spread through the ACP’s 15 community types shows a deeply complicated landscape across the country on many issues — from gun ownership to race. But it also shows some areas of commonality and potential for common ground.
On the whole, three key points emerge in the data — centering in some way on dissonance.
- Americans experience and perceive very different realities. The most pressing issues at the community level can vary greatly. And there is a perception-driven disconnect between big local and national issues. Inflation is seen as a top issue everywhere, but beyond that the numbers get very complicated. Some cite guns and gun violence. Others cite opioids and drug addiction. Taxes rate high in others. And, more broadly, there is a dissonance between national and local concerns that suggests many attitudes are driven more by perception than experience. Some issues that voters say are big ones nationally, such as immigration, don’t show up as big issues in any community.
- Across communities, most people believe their lives are on the “right track,” but they are deeply concerned about the direction of the country. On the whole, people seem to feel good about their individual circumstances and pretty good about their community. But the views are much bleaker when the United States is the entity in question.
- A series of statements about values reveal some broad areas of agreement — particularly around the economy and abortion. But others show wide disagreement. In total, there are nine statements in which every community type is in broad agreement (that is respondents in all types are either over or under the 50% mark). For instance, 50% or more in each community type say, “Obtaining an abortion should be a decision made by a woman in consultation with her doctor, without government’s involvement.” But 10 other statements show differences across ACP community types, some massive. “The right to own a firearm is central to what it means to be an American,” is one such statement.
The ACP will mine the data from this survey over the next year to explore the drivers of the nation’s socioeconomic and cultural fragmentation, but this first release lays bare how and why the nation often seems at odds with itself. Simply put, the many communities within the United States see and live in very different realities. Those varied subcultures have a massive impact on what people believe it means to be an American and where they think the country should be headed. The data explain why it’s not surprising that the nation appears deeply divided, but they also suggest there may be paths to bridging those divides.
Poll Methodology
This American Communities Project/Ipsos poll was conducted June 7-23, 2023, using Ipsos’ probability-based KnowledgePanel® and from June 12-23, 2023, and July 7-10, 2023, using an RDD telephone sample. The poll was conducted among a sample of 5,093 Americans aged 18 or older, with 4,493 surveys completed online and 600 interviews conducted via telephone. For the online portion, the survey was conducted using the probability-based Ipsos KnowledgePanel® and was fielded in both English and Spanish. The RDD Telephone portion was conducted in English in the Native American Lands and Aging Farmlands. The Native American Lands and Aging Farmlands were excluded from some questions because the RDD mode of questioning made the survey too long. The data were weighted to U.S. Census targets in each area segment and at the national level. A fuller methodology can be explored here: ACP Methodology Oct 2023.
A note about how to read these data
The ACP’s community types were created by collecting and analyzing 36 different data points across all the 3,100-plus counties in the United States. The result is 15 different kinds of community spread across the United States. Some are regionally clustered, and others are scattered. You can see all the types mapped and explained below.
(Click type names to see more on each.)
| African American South: Places with large African American populations. Lower incomes and higher unemployment. |
Exurbs: Wealthy communities usually on the edge of metro areas, Largely white with lower crime rates. |
Military Posts: Located around military installations. Younger, middle-income, diverse communities. |
| Aging Farmlands: Sparsely populated and overwhelmingly white. Low unemployment, agricultural economy. |
Graying America: Places with large senior communities. Generally rural and less diverse, middle-income. |
Native American Lands: Places with large Native American populations. Young communities with lower incomes. |
| Big Cities: Counties holding the nation's largest cities. Dense and diverse. |
Hispanic Centers: Large Hispanic populations in mostly rural communities. Younger with lower incomes. |
Rural Middle America: Largely rural and white communities. Middle income and average educational attainment. |
| College Towns: Urban and rural communities that are home to campuses and college students. |
LDS Enclaves: Places dominated by Latter-day Saints adherents. Younger and middle-income. |
Urban Suburbs: Educated and densely populated communities around major metros. Racially and economically diverse. |
| Evangelical Hubs: Places with above-average numbers for evangelical adherents. Largely Southern with fewer college grads. |
Middle Suburbs: Middle-income, blue-collar communities mostly around metro areas. |
Working Class Country: Rural, blue-collar communities. Low incomes and college graduation rates. |
But more important, the differences between these types are apparent in a wide range of data, from age and race/ethnicity to income and education. Those differences in demographic data often go a long way toward explaining the differences in attitudes we see in this survey work. In this report, we sometimes reference those broader socioeconomic differences in the data, but users can explore the divides themselves using the ACP’s Data Clearinghouse, where scores of data sets can be visualized.
What Matters to Americans
For years now, the American Communities Project has been visiting different cities and towns, asking residents what issues drive them, but this survey marks the first time we’ve been able to statistically sample views from all 15 community types. The results show much of what we thought we might see, but also offer some surprises.
The survey asked the question of people in all the ACP’s types in two ways. First, what are the “most important issues facing your local community?” And second, what are the “most important issues facing the country as a whole?”
On those questions, broad differences surface.
Inflation Tops the Local List, Then a Lot of Disagreement
While the data show that the ACP’s 15 types showed varied opinions, the one thing all community types rank highly as a concern is inflation. Out of 20 issue statements, “inflation or increasing costs” ranks first for every type in their “local community.” The LDS Enclaves rate inflation highest, with 66% citing the issue as among the most important, while the African American South is the lowest of the 15 types, at 43%.
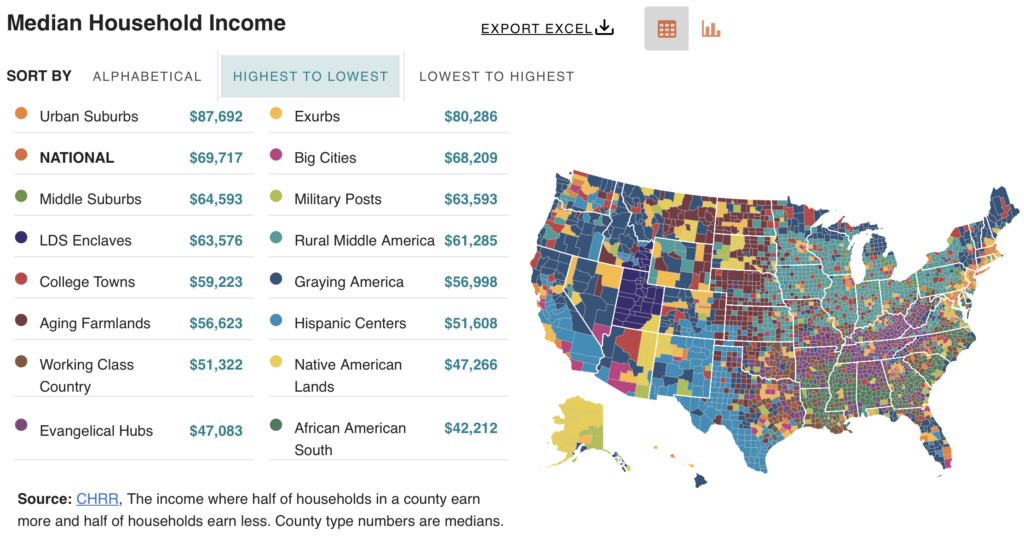
The numbers show just how deeply inflation concerns run in the country. Some of the communities in the ACP have median household incomes high above the national average, but they, too, rate inflation as a top concern. Median household incomes in the Urban Suburbs and Exurbs, for instance, sit at about $87,000 and $80,000 respectively, but in both places, 50% or more cite inflation as one of the most important issues. Of course, another way of viewing that data point is those well-off communities are doing well on most other measures so, of course, inflation stands out. Still, the fact the number is so high across the board shows Americans from all walks of life have concerns about paying bills.
Beyond inflation, however, the “most important issue” picture at the community level gets a lot muddier.
In the African American South counties, “crime or gun violence” is tied with inflation as the top concern, with 43% citing it as one of the most important issues. The issue is also a big concern in the Big Cities, where 33% cite it. In the Evangelical Hubs, “opioid or drug addiction” scores much higher than in other communities, with 40% of respondents singling it out. That issue is also a big concern in Working Class Country counties, where 29% choose it. “Taxes” stand out in the Urban Suburbs and LDS Enclaves. “Homelessness” is a top issue in the Big Cities at 33%, but it barely moves the needle in Rural Middle America at 9%.
Those differences make it easier to understand how the nation can sometimes find it hard to unite behind a common issue agenda. Beyond inflation, the topics that motivate voters vary greatly.
At the National Level: Dissonance
When the “most important issue” question moves to the national level, however, a different point emerges — dissonance between national and local issues. Issues that show up on the national “most important” radar, don’t necessarily show up at the community level.
That’s not true for everything. Inflation, for instance, shows up as a big issue nationally and locally, and it scores higher as a local issue. But consider two topics that have gotten a lot of attention in the news in recent years, immigration and crime. When those issues are viewed through a national lens (“most important issues facing the country”), they score far higher than they do at the community level.
Only 11% of Americans see “immigration” as one of the most important issues facing their local community. And most of the ACP community types are within a few points of that national figure. The one exception is the Hispanic Centers, many concentrated near the border, where 21% cite immigration.
But when the question turns to issues facing the country, the immigration number jumps to 23%, and some of the numbers are much higher. In the Evangelical Hubs, 33% say immigration is one of the most important issues facing the country. In Working Class Country, 29% cite immigration. Those communities don’t see that problem on the ground where they live, indeed most communities don’t, but they believe it is a big problem nationally. That dissonance begs the question of what’s behind the perception that there is a national problem. How important is physical proximity? How important are news sources and consumption habits?
The same is true, albeit to a lesser extent, on “crime or gun violence.” As a community issue, 21% of Americans rate it as one of the “most important issues.” Again, the exceptions are the African American South and Big Cities, which see the issue as a bigger problem.
But as an issue facing the country “crime or gun violence” is nine points higher, with 30% of Americans saying it is an issue of national import. The figure jumps 14 percentage points in Rural Middle America, from 11% as a community issue to 25% as a national one. The number climbs 13 percentage points in the Exurbs, from 17% as a community issue to 30% as an issue for the country. The number jumps 12 percentage points in the blue-collar Middle Suburbs from 23% to 35%. In fact, the number of people concerned about crime as a national issue is higher than the figures for crime as a local community issue in every type except the African American South, where the number is essentially the same at the national and community levels.
It's especially strange to see that kind of local-national divide on crime. Crime tends to be experienced either personally or through friends and neighbors, but these data suggest the opposite. The concerns are lower at the community, experiential level and higher nationally. Again, the data suggest that news consumption habits may have something to do with this dissonance. If one is not experiencing crime as a major problem directly, the concerns about it are likely coming from an external source of information.
There are other local-national divides that make more sense. For instance, there is a wide divide on concerns about “political extremism and polarization.” Only 13% of those surveyed say they feel it is a serious issue in their community, while 26% say it is a serious issue nationally. But that’s to be expected. Each of these communities is, in its own way, a kind of bubble reality. The polarization would likely be seen by many as the difference between their community and others. And the local “important issue” number on polarization is lower in every community than the national “important issue” number.
Still, it is hard to ignore the differences in the way these communities see their local issue and national issue palettes. Taken together, the data suggests a disconnect between lived experience and perceived experience, possibly tied to media coverage and consumption. The ACP will explore this question with interviews of residents in our community types as we go out into the field. In addition, data the ACP has gathered from Comscore, the global media measurement and analytics company, will allow us to examine the biggest media outlets in our 15 types.
How Americans Are Feeling
Personally
No matter where they call home, most Americans say their lives are going well. Nationally, 87% of Americans report their lives are heading in the right direction; only 11% say they are on the wrong track. When examined for each of the ACP’s 15 types, the percentages of people who say their lives are moving in the right direction are within 3% above or below this national average. Evangelical Hubs, in the rural South and Midwest, and Rural Middle America, across the country’s upper tier, reach 90%. Small-town, traditional values infuse the low-income Evangelical Hubs and the less diverse communities of Rural Middle America.
A bit lower are Middle Suburbs at 84%. In these Upper Midwest counties ringing cities, globalization since the turn of the millennium has led to stagnation. In the past 10 years, these counties have seen a marked rise in deaths of despair from suicide and drugs. In Big Cities, where housing access and affordability have been challenging and crime has risen, the percentage who believe their lives are going in the right direction stands at 86%. In Working Class Country, concentrated in Appalachia and hit hard by opioid addictions, the percentage is also 86%. (This was not asked of individuals in the Aging Farmlands and Native American Lands. Read the survey’s full methodology: ACP Methodology Oct 2023.)
Community Well-Being
Nationally, a clear majority of Americans, 63%, say their communities are going in the right direction. This is especially true in the LDS Enclaves, where 79% hold this view. These middle-income, Mormon-heavy communities in Utah and Idaho are known for strong familial, social, and religious ties. Aging Farmlands, sparsely populated older agricultural communities in the Central and Great Plains, are the next highest at 68%. Interestingly, affluent Exurbs along cities’ outer reaches, and low-income Working Class Country in Appalachia both stand at the same 66% level, above the national average. Exurbs experienced an increase in the child population since the 2010 census, while Working Class Country is known for its local, tight-knit culture. Meanwhile, underinvested communities of color, the African American South and Native American Lands, sit below average at 57% and 52% respectively.
America on the Wrong Track
While Americans largely agree that their lives and their communities are heading in the right direction, they broadly express very negative views about the trajectory of the nation. Nationally, 79% of Americans say America as a whole is on the wrong track; just 18% say America is going in the right direction. When digging into the 15 community types, more divides open up. For example, in the Evangelical Hubs, 90% of residents say the country is on the wrong track. In two other rural community types with older populations — Rural Middle America and Working Class Country — the view is nearly as bleak with 86% of residents voicing this opinion. The figures are markedly better in two rural youth bastions — Native American Lands and Hispanic Centers — at 70% and 72% respectively. College Towns sit close to the national average, with 78% of residents saying the country is on the wrong track.
A Closer Look at Values
To better understand what the nation’s fault lines look like in 2023, the survey asked respondents whether they agree or disagree with 20 statements on a range of topics, from the state of the country to policy to cultural hot-button issues.
An interesting split emerges. There actually is broad agreement from all 15 community types around several statements, particularly those concerning the nation today. That’s a finding that suggests for all the deep divides in the United States, there may be some hope for common ground.
Where Individual Americans Fit In
What’s most heartening is that 70% of Americans agree that “Americans have a lot more in common with each other than is generally believed.” This is particularly true in LDS Enclaves, Aging Farmlands, and Native American Lands, more remote counties, where the range runs from 81% to 75%. At the other end of the spectrum are more diverse communities — the African American South, Hispanic Centers, and Big Cities — ranging from 60% to 63%, still holding the clear majority view. In these environments, residents may be more likely to interact with people of different backgrounds and values on a daily basis.
On a more somber note, a large majority of Americans, 70%, agree that “The United States is in decline.” Like the wrong track numbers, the percentages with the view of U.S. decline are highest in rural community types — Evangelical Hubs and Rural Middle America, at 83% and 80%. Smaller majorities in the Big Cities and Hispanic Centers, at 62% and 61%, feel this way. Homogeneous communities tend to have a more negative view of the United States as a whole. (This was not asked of residents in the Aging Farmlands and Native American Lands.)
Americans are largely divided on a key statement: “These days I feel like a stranger in my own country.” Nationally, 46% feel this way. But there is a real gulf among communities. In Evangelical Hubs, 60% residents say they feel like a stranger in their country, whereas in Hispanic Centers, where many are immigrants or first-generation Americans, 35% hold this view. Multicultural Big Cities and Urban Suburbs are in the upper-30s. More aligned with Evangelical Hubs are other homogeneous communities, Working Class Country and Rural Middle America, at 53% and 51% respectively. (This was not asked of residents in the Aging Farmlands and Native American Lands.)
The divide is similar on a related statement: “It is increasingly hard for someone like me to get ahead in America.” Overall, 44% of Americans agree. Evangelical Hubs are 10 points higher than the national figure, while Aging Farmlands, Urban Suburbs, and Hispanic Centers run between 37% and 39%. Perhaps this yawning gap stems from residents’ differing expectations. Competition for opportunities has long been fierce in the Urban Suburbs and Hispanic Centers.
There is more agreement that “Experts in this country don’t understand the lives of people like me.” Indeed, 59% of Americans agree with this view. However, the urban-rural divide comes into play here. Between 66% and 71% of residents in Evangelical Hubs, Working Class Country, and Native American Lands hold this view. People who live in urban-oriented areas are less likely to feel experts don’t understand them, perhaps because many experts and their families and friends live in these places. In the Big Cities, 49% of residents say experts don’t understand their lives while 52% in the Exurbs say so.
Agreement on a Broken System, Except on Structural Racism
Americans broadly and deeply agree that the country’s legacy institutions and systems are broken. The strain of populism runs deep across communities. Mainstream media outlets come out looking particularly bad: Overall, 75% of Americans agree that “The mainstream media is more interested in making money than telling the truth.” In three rural, close-knit community types — LDS Enclaves, Working Class Country, and Evangelical Hubs — more than 80% of residents share this bleak view. But Urban Suburbs and the African American South, two community types typically far apart and home to residents of vastly different backgrounds, the percentage is the same at 69%.
A majority of Americans, 69%, agree that “The economy is rigged to advantage the rich and powerful.” A diversity of communities representing a mix of younger and older residents of varying educational and income levels — College Towns, Big Cities, Graying America, Military Posts, and Working Class Country — reach percentages in the low 70s. In communities of color — the African American South, Hispanic Centers, and Native American Lands — long suffering from underinvestment and wealth inequities, the percentages are in the low to mid-60s.
The notion that “Traditional parties and politicians don’t care about people like me” is a sentiment shared by 68% of Americans. Close-knit Evangelical Hubs, LDS Enclaves, and Working Class Country stand out for agreeing with this view, ranging from 74% to 76% of residents. Smaller percentages in stratified Big Cities and Hispanic Centers say parties and politicians don’t care about people like them.
In contrast, Americans are largely split on whether “Racism is built into the American economy, government, and educational system.” Overall, 48% say they agree that racism is built into the system. Belief in structural racism is a more dominant view in racially and economically diverse communities and less prevalent in homogenous ones. The range runs from 58% in the African American South and Big Cities to 40% in the affluent Exurbs to 38% in the older, sparsely populated Aging Farmlands.
Culture
When the topic turns to cultural issues, such as guns or religion or race, wide disparities emerge, with some gaps as big as 30 or 40 percentage points on the agree-disagree scale.
And perhaps most surprising in the data, there is broad agreement on the question of abortion.
Unity on Abortion
The differences in the 15 community types in the ACP extend into economics, demographics, cultural traditions, and faiths. That’s why the survey results on the statement about abortion come as something of a surprise. In every community type, from the Big Cities to the Evangelical Hubs, 50% or more agree with the statement “Obtaining an abortion should be a decision made by a woman in consultation with her doctor, without the government’s involvement.”
Some of that may have to do with the way the question was phrased. Respondents often don’t like the idea of getting between a woman and her doctor on a medical issue. And to be clear, there are differences in the communities’ attitudes on the statement. In the Big Cities, 73% agree with the statement, while only 53% agree in the LDS Enclaves. But the fact that there’s solid agreement across the board suggests that even if abortion is a contentious issue, it is also one where Americans everywhere tend to side with women making their own choices without interference.
Divides on Firearms, Faith, Family, and More
In many ways, abortion is an outlier cultural issue. Most of the other statements in the survey show sharp disagreements between the communities. In fact, generally speaking, statements that touch on cultural hot-button issues stand out for their ability to divide. Statements involving faith, firearms, and family highlight the splits.
The biggest divides center on the statement “The right to own a firearm is central to what it means to be an American.” Overall, 49% of respondents agree with that statement. That’s close to an evenly divided country. But 73% agree with the statement in the Aging Farmlands and 71% in the Evangelical Hubs. Meanwhile, only 30% agree in the Big Cities and 34% in the Urban Suburbs. And in the African American South, which is largely rural, only 40% agree.
Religion shows deep differences as well. Nationally, 58% agree with the statement “Faith and religion are important parts of American life.” But in the Aging Farmlands and Evangelical Hubs, 70% or more agree with that statement. Only 47% agree in the Big Cities and Urban Suburbs. The College Towns and Exurbs both stand at 51%. Graying America counties sit at 52%.
What about the make-up of the nuclear family? Only 44% of Americans say they believe “Traditional structures for families, with a wage-earning father and home-making mother, best equips children to succeed.” But agree numbers are much higher in the Native American Lands, LDS Enclaves, and Evangelical Hubs, 59%, 55%, and 54% respectively. And below 40% in the Big Cities, College Towns, and Urban Suburbs.
And the survey shows big divides on the question of whether “People should be free to express their gender identity however is best for them.” Nationally, that number goes right down the middle — 50% agree with it. But 61% agree in the Big Cities, while 60% agree in the Urban Suburbs and Native American Lands. Only 32% agree in the Evangelical Hubs and 37% in Working Class Country.
Taken together, these numbers not only show divisions in the country they also show how those divisions can be complicated.
There is a clear urban-rural split on most points, but additional factors also appear when you look closer. Look at the African American South on guns and Graying America on religion, both rural community types with views that look closer to urban communities on those points. And consider the rural Native American Lands counties, which strongly favor traditional families (a conservative idea) while also believing expressing one’s gender identity is a personal decision (a more liberal position).
Even the liberal-conservative, red-blue lines are not all clear in these data. The liberal-leaning College Towns and more conservative Exurbs agree that faith and religion are less important to American life than the nation as a whole. And the largely conservative Graying America communities are more accepting of people expressing their gender identity in whatever way they want than the Democrat-leaning African American South counties.
While the survey shows there are clearly sharp differences on these cultural “wedge” issues, the differences don’t all follow the tidy, binary definitions the media tend to fall back on. The data suggest that there are many underlying factors — from backgrounds and history to lived experience — that lead these communities to more nuanced opinions on what are ultimately very complicated topics.
Policy Views
Several statements in the survey fall under the category of policy, “would” and “should” assertions that involve government actions. Those statements seem to show less division than others.
For instance, there’s strong disagreement among all types that “The U.S. government should cut social programs in order to lower taxes.” Overall, only 29% of Americans say they favor that idea. The highest number supporting this come from the Evangelical Hubs, where 38% say they agree with the statement. But in seven of the types, less than 30% say they support the idea. The Big Cities and Native American Lands are the lowest, with 24% agreeing, but even in conservative Graying America only 25% agree.
But that doesn’t necessarily mean big support for a more activist government, particularly where regulation is concerned. Nationally, only about one third of those surveyed say they believe “Government should take a more active role in policing private-sector misbehavior.” And the figure doesn’t even break 50% in the more Democrat-leaning communities. In the Big Cities and Urban Suburbs, only 45% say they agree with the statement. Those are the highest “agree” numbers on the question.
And the survey does not show big support for increasing immigration. Nationally, only 19% agree with the statement “America would be better off if we let in more immigrants.” The highest number agreeing with that statement comes from the College Towns, where 27% agree. But even in places that lean liberal, support for the statement is small. In the Big Cities, 26% agree. In the Urban Suburbs, it’s 23%. Notably, the Hispanic Centers are below the national figure at 17%.
The survey is more mixed on immigrants and employment. Nationally, 51% agree with the statement “When jobs are scarce, employers should prioritize hiring people of this country over immigrants.” Some communities strongly agree with that statement — 65% in the Evangelical Hubs and 60% in the Aging Farmlands, Native American Lands, and Working Class Country. The Hispanic Centers do stand out on this question. Only 39% in those communities, which tend to have large numbers of immigrants, agree with that statement, the lowest of any of the community types.
On the whole, the policy statements show more agreement on some of the big issues facing the country than might be expected, especially given the gridlocked state of government in Washington. The data might even suggest there is room to find common ground in Congress. It should be noted, however, that these are broad ideas, and, in policy, the devil is often in the details.
What’s Next
The data here represent only a fraction of the entire survey the ACP conducted with Ipsos. In the coming months we will release more of the findings from the poll. In the meantime, the Project will consult with our partners and then head out into the field to see how these results resonate in the real world and what residents of these communities make of them.
We are still in the beginning stages of this effort to understand American fragmentation, but this first survey and the work we have done visiting communities in the past show how complicated America’s landscape is. A few points are clear. People who live in different communities live in different realities framed by different economies, different populations, and different beliefs about what the country is and where it is going. It is not a simple binary split — urban/rural, young/old, red/blue. Truly understanding the underlying drivers and finding ways to overcome them or coexist with them is a process. This is just the beginning of that work.