Across American Communities, Very Different Broadband Realities Abound
There are many ways to think of infrastructure in the United States — for example, roads, power lines, and water systems — but in 2024, broadband connectivity is also a crucial element of a community’s foundation. Now, a new analysis shows how uneven that tech infrastructure can look in the American Communities Project’s 15 county types, with rural communities seeing deep challenges.
The biggest concern may be the speed at which communities are connected. In a world where home internet connections have become important for everything from work and education to news and entertainment, the ability to tap into multiple streams on multiple devices is fast becoming a necessity.
And the analysis, conducted by Alex Kent, an Analytical Lead on the Google Elections team in conjunction with the American Communities Project (ACP), shows some urban communities have median speeds three and four times faster than rural locales.
Broadband Penetration
For years, rural advocates have argued that official broadband penetration rates from the federal government are not wholly accurate. And to be fair, measuring broadband connectivity rates can be difficult because they can vary dramatically by location. The percentage of homes with access in one corner of a county can look very different from the figures elsewhere in the same locale.
Kent’s analysis of penetration figures using the ACP community types looked very similar to the official measurements from the Federal Communications Commission, but provides important nuanced insight. Looking at the median figures for each type, Kent found numbers that were slightly higher than the federal figures.
Overall, in 11 of the 15 ACP community types, the median access rate was above 80%. That’s far from complete coverage and some community types in particular face challenges (the Native American Lands is only at 70% access), but the figures look like a decent baseline.
Speed and The Lack Thereof
Kent’s numbers look very different, however, when one looks at the speed of those connections using the standard measure of megabits per second or mbps.
The most urban types in the ACP, the Big Cities and Urban Suburbs, see median mbps rates of around 120. But the numbers then drop fairly sharply. The Middle Suburbs and Exurbs, in and around metro areas, are close to 100.
But the figures for rural places are much lower. In the Native American Lands, the median mbps rate is only 24. In the Aging Farmlands, the figure is 27. In the African American South and Working Class Country, the median mbps is 30.
These differences are about more than the ability to stream your favorite movie in HD or 4K resolution. They can have real repercussions in how lives are lived and could even impact things like population growth.
Larger Impacts
Mbps sounds like abstraction until you put numbers around it. What kind of broadband speed does one need to live a usefully connected life in 2024? The answer, of course, is it depends, but Consumer Reports magazine built a tool for measuring “How Much Internet Speed Do You Need?” and it provides some broad outlines.
For instance, according to the Consumer Reports guide, a home with two devices browsing the Web and sending emails, one device on a Zoom call and one streaming video needs 26 mbps. Add a third device, streaming video, and it goes up to 36 mbps. That’s already more than the median speed in seven community types (Native American Lands, Aging Farmlands, African American South, LDS Enclaves, Working Class Country, Hispanic Centers, and Graying America) and at the very edge of the speed for an eighth (Evangelical Hubs).
Throw in a fourth device, streaming 4K video, and the needed speed jumps to 61 mbps.
Now consider that Comscore data shows there is an average of 12 devices per household in the US (January 2024). The devices range from tablets and PCs to phones and set top boxes.
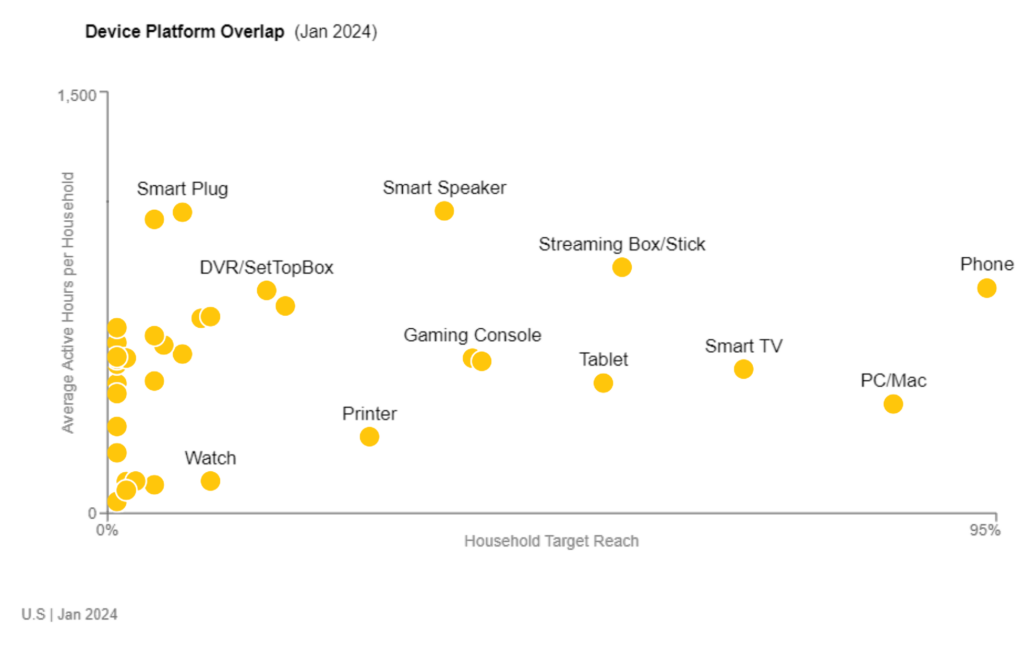
Source: Comscore CTVi January 2024
These data points are about more than simple creature comforts. In a time when working from home, online classes and telehealth appointments are becoming more and more common, low broadband speeds can block paths to economic growth and better lives for citizens.
Consider, for example, how limitations on a reliable internet connection could impact the quality of, or even the ability to tune-in to, our daily news programming of choice? In 2023, the American Communities Project published “How Top Issues Compare to Cable News Viewership,” which discussed the noteworthy differences in the ways that audiences from various community types are consuming different news programming.
In that analysis, we used Comscore data, which captures direct viewing from an average of 1-in-3 homes nationwide, to derive insights about where those communities go for cable news.
Today we can take a more focused look at those relying on internet connectivity for their Connected TV (“CTV”) viewing, with new insights from Comscore suggesting overlaps between broadband-impaired communities and those most reliant on CTV for their news and other content viewing.
The Comscore Congressional District CTV Index surfaces the reach of traditional television and the index of people who view via a connected TV device to get a better understanding of viewership trends.
Consider the snapshot (below) from the reporting, which reflects CTV viewership by audiences in Nebraska’s most rural Congressional District, the Third, over-indexes significantly as compared to Nebraska’s more populated First and Second Congressional Districts.
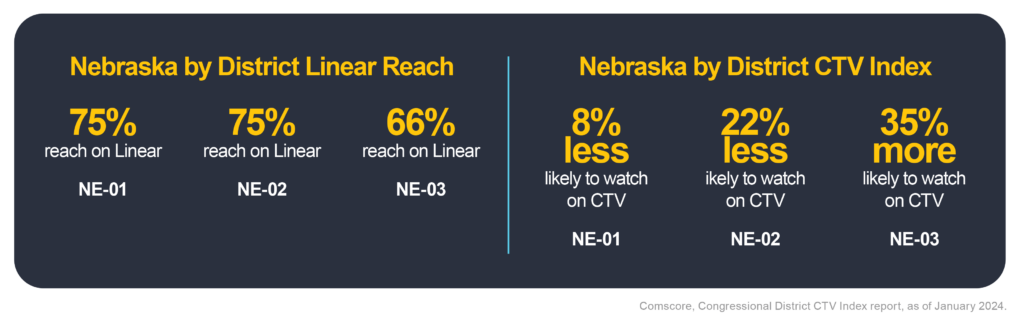
Comscore, Congressional District CTV Index report, as of January 2024.
Particularly since the pandemic, there has been a lot of discussion about the ability people have to change their lives by moving to different places because they can “work from anywhere.” Part of that conversation was about a new chance for rural communities to add population with people looking to get away from the city life.
The data here show a missing part of that equation. Increasingly, the ability to live a full, modern life involves being connected with the world from wherever one is. These figures show that ability varies greatly depending on where one lives with some places being at a decided disadvantage.
Dante Chinni is Director and Founder of the American Communities Project. David Kovach is Head of Market Innovation at Comscore.