
America’s Fragmented Economic Realities
People often assess how American households are doing collectively by looking at two key socioeconomic metrics: median household income and child poverty. However, the picture is more fragmented as other figures come into view. Economic disparities show Americans living in very different daily realities, which can impact perceptions of their neighbors, their futures, and the nation at large. Visionary policies can help knit communities socially and economically.
Consider the differences in income inequality across the country. The national rate stood at 4.9, that is households with higher incomes had income 4.9 times that of households with lower incomes. The income inequality rate ran from 3.8 in the LDS Enclaves to 5.4 in the African American South. LDS Enclaves, full of adherents of The Church of Jesus Christ of Latter-day Saints, are known for higher social cohesion, and the tech sector has gotten a footing in these parts. Generally, more homogenous communities had a lower score than heterogeneous ones, underscoring longstanding wealth disparities between races and ethnicities. In addition to communities of color, College Towns stood out for a rate of 4.9. These areas catch a wide swath of the population. While many residents may not have much, that’s likely to change as they mature.
Other community types scored better than national average by varying degrees. As described in the 2023 County Health Rankings & Roadmaps, “A higher inequality ratio indicates greater division between the top and bottom ends of the income spectrum.”
Other key socioeconomic markers at the community level widely strayed from their national numbers. While the national median household income sat at $69,717, according to the latest County Health Rankings, median incomes ranged as much as $45,500 by community type, from $87,692 in the Urban Suburbs to $42,212 in the African American South. In general, urban areas posted higher median household incomes. Southern communities as well as Native American Lands showed particularly low median household incomes.
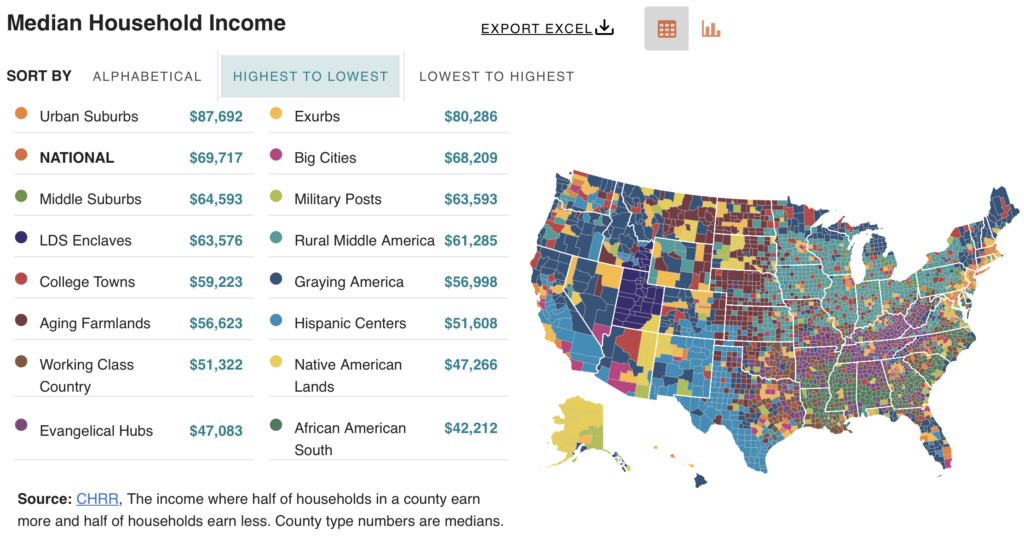
Much can be attributed to the dominant industries in different kinds of places. Notwithstanding the rise in teleworking from anywhere, high-earning, white-collar professionals remain concentrated in urban-oriented areas: Big Cities, Urban Suburbs, and Exurbs. Overwhelmingly residents in the Aging Farmlands, Rural Middle America, and Working Class Country work in middle- and lower-income agricultural, manufacturing, or service sectors. Military Posts are filled with government employees. In communities with large numbers of people of color, racial and ethnic wealth disparities again come into play. Government administration is a key industry here, too.
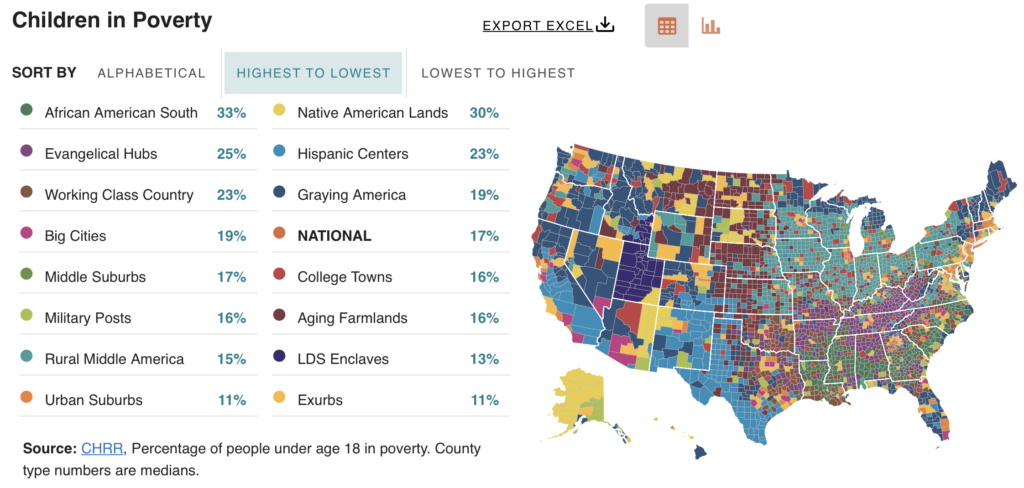
Children in poverty, defined as the percentage of people under age 18 in poverty, mirrors these divides. The national rate stood at 17%. Child poverty rates were highest in the African American South and Native American Lands at 33% and 30%, respectively. Evangelical Hubs, Working Class Country, and Native American Lands all sat in the mid 20s. Poverty shows up in different challenges, including housing and food insecurity, and churches, nonprofits, and neighbors often help with basic needs. But even higher-income Urban Suburbs and Exurbs had child poverty rates ticking above 10%, according to the 2023 County Health Rankings. This contrasts with nearby Middle Suburbs, which sit at 17%. The divide may be because Middle Suburbs, once a bastion of union households, have suffered the effects of globalization and stagnation since the early 2000s.
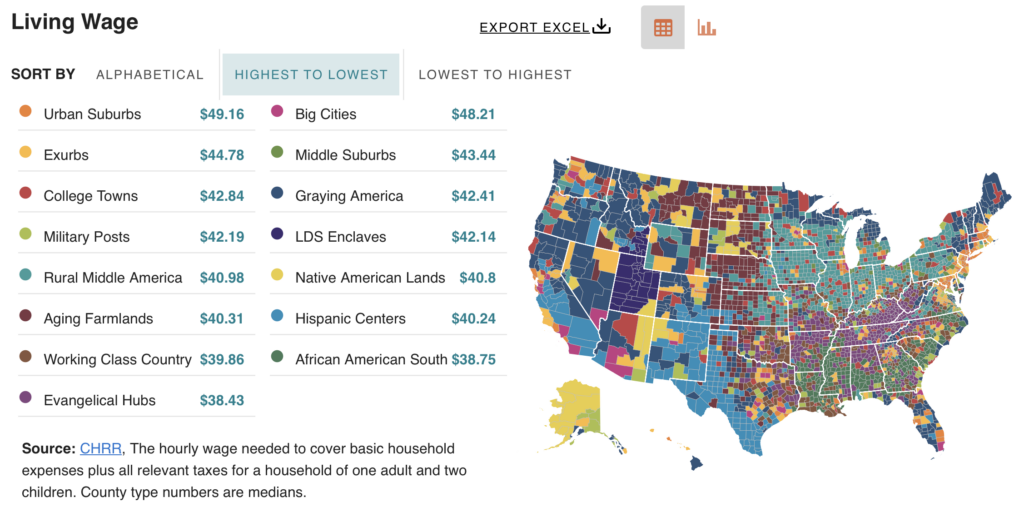
A marker that moves toward a more aligned reality is the living wage, defined as the hourly wage needed to cover basic household expenses plus all relevant taxes for a household of one adult and two children. Living wage also splits by community type; but it’s much narrower between types. (No national figure is listed.) For the affluent Urban Suburbs just outside cities, it was $49.16. Big Cities were slightly below that at $48.21. Much of the Midwest and the West sat in the low 40-dollar range, with communities of color — Hispanic Centers, Native American Lands, and the African American South — as well as Working Class Country in Appalachia toward the lower end of the spectrum. Cost of living comes to less in these areas. In Evangelical Hubs, concentrated in the South, it took the least amount for a living wage, $38.43.
The Infrastructure Investment and Jobs Act, signed into law by President Biden in November 2021, is positioned to narrow the income gap for households and lift the socioeconomic conditions for communities. The law is expected to create hundreds of thousands of good manufacturing and construction jobs that pay decent wages and benefits. More than 18 months in, the administration has announced more than 32,000 projects in more than 4,500 communities in all 50 states, D.C., and U.S. territories, totaling more than $220 billion.