GivingTuesday Data Commons has been running a weekly national survey on generosity in the U.S. these last three years. We track the sharing of time, treasure, talent, and motivation as well as other key factors to understand giving trends. Helping us is an eight-part survey question about one’s worldview that we use to identify people’s place on the U.S. political spectrum, adapted from a Pew Research survey. This coupled with ACP’s county types brought new regional insights about giving — and surfaced clues about the current political landscape.
About the Political Spectrum
Pew outlines nine political types in the U.S., based on a 2021 survey of more than 10,000 Americans. They broadly fit into liberal, conservative, and centrist units:
They’ve repeated this survey every three to four years back to 1987, and the groups change size and labels over time, but there are always between six and nine distinct groups.
The Progressive Left and the Outsider Left believe many of the same things but don’t find the same leaders appealing or representative of themselves.
Stressed Sideliners are dominated by economic hardship and are too busy to bother with politics.
Faith and Flag Conservatives and the Populist Right both combine to form a group that news media typically mean when they talk about the “populist right,” and both overwhelmingly support President Trump.
We’ll dig into the Populist Right here.
Based on our survey of 3,962 people from Q2–Q4 of 2024, you can see that some parts of the country are dominated by one or a few Pew political types, while most others are not. Nowhere does one political worldview have an outright majority.
Table of American Communities on the Political Spectrum
Table description: Prevalence of Pew political types across the American Communities Project types. Numbers represent the percent of respondents for each type per community. For ease of comparison, only the top four Pew types for each community type are shown.
Source: GivingPulse. Note: Stressed Sideliners and Outsider Left don’t appear because they’re not very prevalent in any community type. We’ll discuss them in a future blog post.
Looking at just the Populist Right across ACP types, we can see that Evangelical Hubs form the strongest conservative base (when combined with Faith and Flag Conservatives) but that Hispanic Centers are essentially matched in the percent of people identifying with the Populist Right. Working Class Country and LDS Enclaves are similar.
However, the percentage of populist right support in deeply left-leaning places is far from zero. Nearly 1 in 5 people living in College Towns, Big Cities, and Urban Burbs identify with the Populist Right, even though these are the places they are least prevalent.
What We Know About the Populist Right
They engage in activism, but not quite as much as others: In Q1 of 2025, 29% of right-leaning Pew-types participated in some form of recent activism (within the last seven days), compared to 37% of people in left-leaning Pew-types, and 31% of centrist groups.
About 3/4 said they try to help those most in need, even if that means helping people in their own community less. This is one of several questions we ask to gauge shifts in polarizing or depolarizing beliefs/actions in the country. This group is typical of the right for depolarizing beliefs, with Outsider Left highest at 86% support, and Faith and Flag Conservatives the lowest at 69% support.
About 3/4 of them recently performed a random act of kindness for someone.
Despite their economic optimism, the Populist Right was among the groups most likely to say “donating money to charities provides too much of a financial strain” on them, at 50% of the group, just behind Stressed Sideliners at 56%.
We also ask people how much money they gave and to whom. In Q1 of 2025, the Populist Right increased their giving to registered charities, compared to that seen in Q3 and Q4 of 2024. They also decreased political donations over this time, the most of any Pew group. The Populist Right also gave more to help individuals of any of the nine groups in Q1 of 2025 — though they still tend to give more to registered nonprofits.
Another thing we noticed: When combining the three left-leaning groups and the three right-leaning groups into “liberal” and “conservative,” there is basically no difference between their rates of giving in Q1 of 2025 (see our full report). The story only appears when you start looking at how people with different worldviews (but not voting patterns) behave. It’s why we found asking about voting, party affiliation, or liberal/conservative to be less useful in understanding what affects one’s willingness to contribute in their community.
We find Pew types and ACP counties useful, but they also present us with a contradiction: Broadly speaking, most (~75%) people aspire to help others and build community across every worldview and community type, with little meaningful variation. Yet on a wide swath of other surveys, people think the world is trending in the opposite direction, and that other people in their community don’t share their same do-good aspirations. We find those perceptions do not match reality. To dig into that perception gap, we’re looking at how one’s media landscape correlates with different perceptions. Stay tuned.
Marc Maxmeister helps organize and convert the world’s generosity data into meaningful insights into how giving works, and what organizations can do to improve the lives of people served. He brings context from mixed methods field research in Africa, rigor from his Ph.D. work as a molecular neuroscientist, and engineering from past AI-driven startups and nonprofits.
by Ari Pinkus, Jenna Modica, Sarah Murphy, Jenna Fisher, Jake Pinkus, and Kathleen MajorskyJune 24, 2025
A sense of fragmented reality has churned up intense emotions in public and private spaces across America. In this heated climate, where it seems hard to find humor, who’s going out to see comedy in their community? How are comedians performing in different places?
At the American Communities Project, we sought to understand what live comedy feels and sounds like in America, how comedians are tackling hot-button cultural issues on stage, and how various audiences are responding to their acts.
In our quest, writers around the country chronicled their experiences at comedy shows within or near their home counties, from the west to east coasts. (Click on the anchor links below to jump to specific vignettes.)
A show ticket for one, including service fees, ranged in price at the chosen venues — about $12 in Los Angeles, $17 in St. Louis, $26 in Sarasota, $32 in Sandoval, $39 in Bucks, and $52 in Cook County’s Chicago.
Between the cost, content, and availability, attending comedy shows is a definite niche activity. The 2024 MRI-Simmons consumer survey found that 6% of Americans went to a comedy club/stand-up comedy show in the past 12 months. (The survey was conducted between September 2021 and August 2023.) Just 3% attended less than once a month. Attending shows was most popular in urban-oriented and affluent communities where entertainment options abound, particularly in the Big Cities and Exurbs.
Reaching Audiences and Communities Online and In Person
At the same time, there are ways comedy has become more inclusive. Michelle Robinson, associate professor of American Studies at the University of North Carolina-Chapel Hill, who’s taught the course “The Ethics of Stand-up Comedy,” explained by email: “Since the expansion of platforms that offer opportunities for more comedians to make their work available and even deliver hour-long specials has grown, stand-up comedy writ large includes or addresses more people…. Comedians may be more likely to find their audience(s), either by chance or via ‘the algorithm.’ Popular comedians ‘foster’ or ‘mentor’ one another through the production and direction of specials.
“If the [inclusive] question is really about whether popular humor (or trending stand-up comedy) by and large is conscious of diverse sensibilities and identities, it’s hard to say,” Robinson said.
Comedian and producer Jeremy Essig, who’s experienced the ebbs and flows of the comedy business for the past 25 years, knows these trends well. For five years running, Essig’s company Rhizome Art Limited/Rhizome Comedy in Raleigh, North Carolina, has been producing comedy and distributing specials to Amazon, Apple, Netflix, and other outlets. For 20 years previously, he was a touring comic.
“Comedy is in a boom phase right now,” Essig said in a phone interview. “Clubs are a lot fuller. I feel like it’s a very cyclical thing….”
Essig attributes much of this surge to the pandemic and social media, as people were stuck at home and entertaining themselves on YouTube, TikTok, and Instagram. After the lockdowns ended and in-person entertainment got going again, many wanted to come out and meet the comics they were following online.
The fragmentation of American culture means that “people are playing largely to their own audiences,” Essig said. “You can be a Joe Rogan and be very popular, and or a Joe Rogan derivative, but you can also be someone very left and attract a similar audience. And then, what’s interesting in the middle is people that aren’t as well known.” Some of Essig’s performing comedian peers in the middle ground can see a disgusted face and “people on a hair trigger about smaller things,” he said.
So, is it hard to find comedy that kills everywhere now, compared to, say, 20 years ago, or does it depend on the kind of community where a comedian is working?
Robinson weighed in: “I would compare the situation to network TV before the rise of cable, where comedic ‘gatekeeping’ structured how we understood what good comedy was and trained us (and our bodies) to laugh. This is not to say folks lacked discernment then or now, but cacophony is not bad. ‘Community’ divides can be geographical, generational, virtual (by platform), political, and along so many other lines, and comedians now interface with all sorts of ‘communities.’ Geography probably matters as much as we think…but sometimes the comedy itself changes, because the air is freer.”
What did the writers for the ACP find in their communities? Read on.
Los Angeles County, California (Big City)
By Jenna Modica
It’s a time of great hurt in Los Angeles as immigration raids and protests against them continue. Almost like a split screen, the world’s comedy hub is meeting a need for good humor. About 20 minutes from where the Marines and National Guard troops have been stationed since early June, The Lyric Hyperion is one of the venues soldiering on.
The Lyric Hyperion opening for an evening show in Los Angeles on June 16. Section photos by Jenna Modica.
On the deck of The Lyric Hyperion.
On this mid-June Monday night, the 60-seat theater was feeling especially intimate with the small crowd gathered. Various pictures and plants hung around the space, “Harry Potter” and “Star Wars” soundtracks played on a loop, and the smell of fresh popcorn wafted through the air — $6 for endless popcorn. Alcohol sales were plentiful, too.
The refreshment area at The Lyric Hyperion. Bottomless popcorn for $6 is popular.
A full activity board at the venue.
The 33 attendees reflected some diversity but generally skewed younger. Guests included a group of three white women in their 30s/early-40s, a group of three twentysomething white women, a single early-20s white woman sitting alone, one lesbian couple, three Black men, two females of Indian descent, two males, with the rest mainly white women from their 20s to 50s.
The Hyperion Lyric stage in Los Angeles County.
Audience members settled in for the show.
We were there for the long-form improvised show “Pretty Funny,” starring comedy veterans Jon Gabrus of “High and Mighty” and “101 Places To Party Before You Die,” Ben Rodgers of “Workaholics” and “Star Trek: Lower Decks,” and Dom Dierkes of Derrick Comedy and “Solar Opposites.” In the opening (which started 15 minutes late), the three men made gestures suggesting they were having a threesome. Two identified as gay dads. The bit drew a lot of laughter. One single thirtysomething male attendee with a very loud, distinct laugh rocked back and forth laughing most of the act. When the men acted as if they were kissing and enjoying it, the audience smiled, clapped, and laughed out loud.
The audience gravitated to Gabrus in a tropical shirt. Appearing as the biggest personality of the three, he drew big laughs when he did female voice impressions.
When the comedians asked for an audience member’s favorite song lyric, a 20s Black, curly-haired woman shouted, “Tell me something good.” Responding to the prompt, the men set the scene in 2001, with one man playing an old computer and the other two shouting out descriptions to us in the audience. The group memorably addressed the tragic September 11th terror attacks with a joke on how an old computer would have operated during that time. With pitch-perfect humorous words and moves, the men did not offend but engaged through the whole show.
From left to right, Dom Dierkes, Jon Gabrus, and Ben Rodgers performing the improv show “Pretty Funny” in Los Angeles.
The three veteran comedians continue their act.
Afterward, I asked Kassandra Galindo for her thoughts. Galindo was striking with tan skin, fresh tattoos, dark hair and eyes, and a welcoming smile. She attended alone from the Inland Empire area, east of LA. The 32-year-old social media coordinator used to work at a comedy club, but this was her first improv show. She desired a more intimate setting and is trying new things in L.A. “The crowd work was fun and cool to see them incorporate it in their act. I like how their gay jokes weren’t inappropriate but rather tasteful.”
Galindo laughed a lot in the first half, but not as much in the second half. Being given too much detail and getting lost in the story made her lose energy, she said. She wasn’t a fan of the late start but will return to Lyric Hyperion, having enjoyed the bar, stage, and overall setting. “Since this was my first time, I was nervous to raise my hand to give a lyric or introduce myself. But now I know what to expect and will be the first hand up next time.”
Sandoval County, New Mexico (Exurb)
Sandoval County looking east. Section photos by Sarah Murphy.
By Sarah Murphy
Santa Ana Star Casino Hotel in Bernalillo, New Mexico.
As I drove north along I-25, the cityscape faded into sagebrush while the Sandia Mountains dominated the eastern horizon. My destination this early June Saturday night: Quezada’s Comedy Club & Cantina inside the Santa Ana Star Casino Hotel in Bernalillo, New Mexico, about 25 minutes from downtown Albuquerque. Upon arrival, I navigated past the floor of slot machines to find the comedy club tucked along an interior wall. Quezada’s, which opened in 2023, is one of a small handful of local comedy clubs, nearly all of which have opened in the past seven years.
The entrance to Quezada’s Comedy Club & Cantina is inside the casino in Bernalillo, New Mexico.
Headlining was Leo Gonzalez, TikTok-star-turned-Hulu-actor of “This Fool,” whose stand-up career began just three months ago. The cantina bartender said the sold-out show was rare, but he attributed the impressive turnout to Gonzalez’s popularity among New Mexicans. Big-name comedians tend to overlook Albuquerque for places like Dallas or Phoenix, but recent club headliners including Margaret Cho, Tom Arnold, and Gonzalez may be a sign of change.
Inside the club, theatrical lights adorned the walls of the intimate and lively 300-seat room. Casually dressed friends and couples in their late 30s to 40s enjoyed drinks and snacks with a warm din. I was seated with the Martinez family — Danny, Jessica, and their son Danny Jr., who lives in Albuquerque and invited his parents out from Mora, New Mexico. The couple moved there 20 years ago, though Jessica’s Padres jersey and Danny’s cheering at the mention of East L.A. pointed to their Southern California roots. Jessica said she discovered Gonzalez’s TikTok videos during the pandemic. They’ve been a bright light for her, a nurse practitioner, and she appreciates that his humor is relatable and not too raunchy.
The audience welcomed Martin Rizo’s and Isaac Castro’s opening sets. Given Gonzalez’s reputation for clean humor, a few graphic jokes drew polite groans from the crowd, but pop culture riffs like Destiny’s Cholas and Brokeback Montaño landed solidly. Once Gonzalez took the stage, his endearing charm shined while taking a birthday tequila shot with a fan, posing for a mid-set photo-op, and celebrating two recent graduates in the audience — Jessica included. A line about Gonzalez’s recent breakup drew some playful flirty banter from a woman in the front row. In a twist of comedic irony nearly two-thirds through the set, the revelation that the woman is married earned the audience’s chagrin and the biggest laughs of the night.
Headliner comedian Leo Gonzalez (r.) poses with writer Sarah Murphy after the comedy show. Photo courtesy of Sarah Murphy.
In an interview with Gonzalez afterward, he acknowledged that navigating hot-button issues is tough. Recent protests and ICE deportations in L.A. hit home for him, but he’s not always sure how to address these topics with an audience whose political leanings feel opaque. During his set, Gonzalez tested the waters with the tentative: “Did you guys have a pandemic here?” but revealed that the crowd was still hard for him to read. Given the moderate leaning of Sandoval County and the diverse communities of the surrounding area, that’s understandable. Because he believes good comedy comes from being a good observer and making the crowd feel seen and understood, he doesn’t want to risk missing that mark: “Sometimes I try to be nonpolitical, and just land on being a decent person as the common ground,” he admitted.
Jessica was first in line for a photo-op with Gonzalez. Her highlight of the night? “How he can make people like me laugh,” she gushed.
The crowd’s mid-set cheers of “We love you, Leo!” were testament to their shared sentiment and Gonzalez’s ability to unite a diverse audience, regardless of their politics. More than punchlines, Gonzalez offered genuine connection and gratitude to the crowd who came to see him and feel seen by him: “I’m so glad you’re here,” he said more than once, and you could tell he meant it.
Danny Jr. was all smiles and hoped that Gonzalez’s show was a sign that Albuquerque’s comedy scene is heating up. The crowd here proved there’s a warm, receptive community ready to welcome touring comedians and eager to celebrate the bridge-building power of comedy.
St. Louis County, Missouri (Urban Suburb)
By Jenna Fisher
Some came on dates, others with coworkers. One table of girls erupted in cheers when the high school teacher on stage called them out. “I didn’t recognize you,” he quipped. “You’re on time.”
The crowd roared.
It wasn’t quite a full house this mid-June Friday night at the St. Louis Funny Bone, but the audience of more than 100 came ready to laugh, even if it meant being nudged a little. Ages ranged from teens to people with gray hair. The average attendee was around 50 years old. Audience members were mostly white, middle class, dressed more casually than not, and quick to respond to the entertainers. Some bits got belly laughs. Others landed more softly, with a ripple of chuckles and nods. While there might have been some squirming from the younger crowd, no one booed. No one walked out. Everyone seemed to be looking up and engaged.
“I was nervous,” admitted Brenda Varnum, 54, who drove nearly an hour from New Baden, Illinois, for a date. A licensed home childcare worker offering daycare programs in New Baden, Varnum used to attend more live comedy before Covid. This was her first show post-Covid. “I thought it might get too liberal. But I didn’t feel uncomfortable at all…. I thought it was hilarious. My cheeks are stuck,” she added, reaching up to her face to emphasize how much she’d been smiling.
St. Louis Funny Bone at a mall in St. Louis County, Missouri. Photo by Jenna Fisher.
Tucked into a St. Louis County mall, the club could have been pulled from a comedy movie set: tightly packed two-person tables with four people tucked into them sipping drinks, as waitresses flit between sets. A single stool and microphone sat on stage in front of a brick wall with the club’s neon logo. Around the corner, by the restrooms and the bar, a karaoke room. If there had been a haze of cigarette smoke in the air, it would’ve completed the scene in the low-lit room.
Three comics performed, each with a distinct style. Host Tim Convy opened with casual banter, noting he avoided political material just before delivering a joke that had the crowd holding its breath, then exhaling in laughter as he ended his long mock political advertisement making absurd promises with, “Vote for me for state treasurer.” Joe Stapleton followed, a poker commentator with high energy and rapid delivery and a tendency to deliver his jokes at a near yell. His set jumped from crude humor to abortion to beer. Some jokes landed well, others drew nervous laughter, especially from a table of college men and the table of high school girls.
Headliner Rob Durham took the stage with the ease and practice of someone who has experience in front of tough crowds (read: high school students). And he leaned into his life as a high school teacher. He joked about Gen Z slang, anxiety, and getting called into the principal’s office to the constant cackle of the nodding audience.
Each comic approached cultural flashpoints without dwelling. Durham came closest to pushing deeper, with whip-like commentary on banned books, the idea of arming teachers, and then more seriously stepped onto a proverbial soapbox to talk about all the things teachers don’t get paid to do, like play chess with the student who doesn’t have friends, and stay after school to support the kid who said he doesn’t want to live anymore. As he took a breath to end his vent, the room was silent. Still, the crowd stayed with him. And that’s when he delivered his punchline, “Nah, I don’t do any of that,” that sent belly laughs throughout the crowd. He later confirmed he does, do that stuff, to more laughs.
Sara Phillips de Borja, of Ballwin, Missouri, is a big comedy-goer and has been in rooms where the comedian did not read the room and completely tanked. From her perspective, these guys did great, and she loved how they were able to localize their jokes, poking fun of different suburban neighborhoods. She felt a little uneasy over a brief comment about East St. Louis, a predominantly Black area of downtown that gets a bad rap and can be a dog whistle for racism, but otherwise she really loved Durham’s observational comedy.
On the way out, as the lights came up and the staff swept in to prep for the next show, several pointed to Durham’s school material as a highlight, including Iowa couple Nate and Tawny, in town for their teen’s soccer tournament.
For them, the evening was about release. The two love comedy, specifically Nate Bargatze, and thought the teen stuff killed. “We just came in to let go and laugh,” Tawny said.
“Nothing should be off the table,” Nate added.
The audience seemed to agree.
Cook County, Illinois (Big City)
By Jake Pinkus
At the entrance to Chicago’s Old Town neighborhood. Section photos by Jake Pinkus.
It wasn’t just any June Friday night in Chicago’s Old Town neighborhood. It was the night before the Old Town Art Festival, which started in 1948 and has become one of America’s foremost juried art fairs. While the neighborhood prepared for the big event — featuring 230 artists and 57 garden stops — I walked around streets I frequented years ago. Little had changed. As I stepped onto North Wells Street, I spotted the familiar red awning of The Second City, the flagship comedy venue.
I came here to see the latest Mainstage revue, “This Too Shall Slap.” As I entered, the air buzzed with chatter and the clinking of glasses. Waiters navigated the crowd, taking food and drink orders, adding to the dinner-theater atmosphere.
Inside The Second City, a premier comedy club in Chicago.
The room accommodating about 300 seats was full, and the audience was diverse. A few tables away sat a married couple in their late 50s from Naperville, Illinois, part of Chicago’s western suburbs. They came for a date night. “We love comedy!” Susan shared. “This is our fifth time coming to Second City. We’ve tried other comedy clubs in the area, but nothing ever compares.” Her husband, Greg, nodded in agreement. “We’ve gone to Zanies right around the corner, but didn’t like the vibe.”
Nearby, a gay bachelor party group of 15 filled a large table, their laughs mixing with hoots and cheers. Across the aisle, six friends were celebrating a college birthday party.
On stage, the diverse six-person ensemble — Leila Gorstein, Adonis Holmes, Hannah Ingle, Bill Letz, Jordan Stafford, and Adisa “Di” Williams — displayed obvious chemistry and skill, with seamless transitions between characters and sketches.
“Musical Chairs,” set in an anger management class, began as a simple game before spiraling into hilarious chaos. Physical comedy was only part of its appeal; the sketch explored psychological issues like the pressure to conform, the release of bottled-up emotions, and the need for validation within a group. The audience, including the bachelor party and couple from Naperville, roared.
In “Claudine’s Kitchen,” a parody of trending cooking shows, Claudine maintained a sugary sweet demeanor for the camera, only for her true unhinged personality to emerge during the commercial breaks. The sketch captured how performative public personas are and the fragile sanity underneath. It hit the mark for the audience.
The “Dictator Nation” musical number showcased the most direct nod to political power. But it satirized the concepts of authoritarianism, groupthink, and control, and did not mock current global leaders or specific governmental structures. The audience was laughing and clapping along through the act.
Ensemble member Stafford delivered a standout performance as an elderly character struggling to reach his sister on her birthday, repeatedly dialing the wrong number. The bizarre and awkward conversations with strangers on the other end of the line were both tender and funny, playing up the modern disconnects and the unexpected human connections that can arise from technological mishaps.
In a world that often feels overwhelming and insane, “This Too Shall Slap” reminded me that sometimes the most profound way to understand reality is to laugh at its absurdity.
As for Susan and Greg, the married couple from Naperville, they’re already planning their sixth trip back to Second City.
Outside The Second City comedy venue in Chicago’s Old Town neighborhood.
Sarasota County, Florida (Graying America)
McCurdy’s Comedy Theatre, featuring a variety of comedians, is an institution in Sarasota, Florida. Section photos by Kathleen Majorsky.
By Kathleen Majorsky
McCurdy’s Comedy Theatre is an institution in Sarasota, Florida. Established in 1988, it moved to the heart of downtown Sarasota in 2014. This small venue draws locals and visitors for comedians’ laughs, bar food, and cocktails most nights, including Sundays.
High season is over in Sarasota. Most snowbirds have flown back north to escape the heat, humidity, and hurricane season that lasts from June through November. But on this first of June, plenty of Sarasota’s seniors were in tow, including at least 20 couples over 55 enjoying cocktails and time with friends before the performance.
Drew Warren, the MC in his late 50s, warmed up the crowd with a few regional jokes — and some generational ribbing. At one point, Warren picked out an 18-year-old from the crowd and joked that he probably isn’t on Facebook anymore. After the guy confirmed he’s not, Warren said something like, ahh, yes, Facebook is where the old people hang.
Geno the Garbage Man, a Black comedian and actual garbage man in the Sarasota/Bradenton area took the stage dressed in his highlighter yellow vest that he wears on the job. Pointing to one of the only Black audience members who was sitting up front, he exclaimed, “I’ve been here three nights in a row, and you’re the first Black person I’ve seen!” In humorous style, he shared very relatable tips for anyone who takes out the trash at home.
Wyatt Cote, the 34-year-old headlining comedian, joked about taking care of his aging father. Cote’s recent air travel got the savage treatment for its sky-high costs. He recounted paying $42 for his seat on Spirit Airlines — and $55 to check his bag. So, the next time, he bought two seats: one for his bag and one for him, then used the extra money to buy a $13 bottle of water.
At a show in Little Rock, Arkansas, Cote had a different numbers problem and regaled us with the story. Referencing his low salary with the Little Rock audience, Cote was like, yeah, people make 10/3 times more than me as a comedian. The audience there did not laugh or seem to understand the fraction, he said. Afterward, Cote said an audience member approached him with the point that she got the joke, adding she understood it because she has a college degree. Cote’s response: Uh, 10/3 is fifth-grade math.
At times, Cote’s style was a bit raunchy, leaving the older crowd to laugh hesitantly.
But not everyone was put off by Cote’s humor. Ashley Linton, 36, an office manager at the local Kia dealership and a Sarasota resident who attended the show with her boyfriend, said, “I’m open to all of it. Whatever resonates. I feel like people get uptight. I like the old school comedy, being able to joke about everything. And not being afraid to joke about things.” This was the second time the couple saw Cote perform at McCurdy’s in the last 12 months.
Lindon waxed nostalgic. “We’ve been watching a lot of ‘Seinfeld’ lately. It was the early ’90s, so it was, of course, a lot of stuff that you can’t say now. It’s old-school comedy.”
She hopes “old-school” comedy is making a comeback. “Now we’ve gotten to a point where we can’t joke about stuff. How do we revert? In the ’90s, you could joke, but now it’s like you can’t say anything about anything. Now we are getting back to, let’s have fun again.”
Fun again. We could all use a little more fun…again.
Fun bathroom decor at McCurdy’s in Sarasota, Florida.
Bucks County, Pennsylvania (Exurb)
Coworking space FZ Works hosts a Comedy Night once a month on Main Street in Yardley, Pennsylvania. Section photos by Ari Pinkus.
Comedy Night at FZ Works, aka Ceiling on Main.
By Ari Pinkus
Once a month for nearly two years running, a stylish coworking space one floor up on Yardley’s Main Street, morphs into a comedy showcase with a BYOB bar. On some nights, it’s overflowing. On the cool Thursday night of Memorial Day week, the room was not as full, with 30 attendees that included a mix of couples and singles in casual dress, some coming for the first time, all from Bucks County. Room vibes: warm and neighborly.
Guests wait for the show to begin in Yardley, Pennsylvania. FZ Works owner and Comedy Night launcher Charles Barrett stands in a cap behind the bar.Regular host comedian Tim Conniff opens up Comedy Night in Yardley, Pennsylvania.
Perennial host comic Tim Conniff kicked things off: “These are the Yardley people who don’t have shore homes.” The money joke got an easy laugh in this relaxed setting. The Jersey Shore, a summer getaway tradition for many, is about 90 minutes away from this idyllic Exurb of Philadelphia along the Delaware River. (Yardley is about 10 minutes downriver from Gen. George Washington’s Christmas night crossing in 1776.) Conniff pointed to the vacant front row, ribbing that he now understands how his priest feels on Sunday mornings. Some clapped when he asked who the fellow Catholics were in the room. Scanning the white faces, Conniff remarked, “I got to be honest with you, though, not the most diverse crowd I’ve ever seen.”
His generational teasing engaged the audience. When asking who in the room identified as Boomers, Gen X, Millennials, and Gen Z, it was clear Gen X was well-represented. He noted the differences that marked the cohorts. Young people know their pronouns. Older generations used AOL email. People cheered when Conniff called out the Hotmail domain. He played up how Gen Z came on the scene: “This is the generation best known for eating Tide Pods, right?” Only a couple of Millennials were in the audience, including me. Conniff’s quip: “Is your Xbox broken?” Then, he brought up a birthday party on Philadelphia’s Main Line with 50 attendees: “28 Millennials and 22 free-range Millennial offspring.” “Ahhhs” sounded all around.
Taking the stage next was comedy-magician Norman Klar, the first comedian to perform at the National Constitution Center in Philadelphia. Early in his act, he jested: “I just had a birthday. I turned 63…about 10 years ago.” After earning a hardy laugh, Klar moved on to his happily married status, which other longtime couples related to. He and his wife of 35 years watch “Jeopardy!” together. “She gets every answer right.” Meanwhile, the only one he knows is: “What am I watching now?” The two vacation in Cape May, New Jersey, her preferred destination over his nearby Wildwood. “We compromise,” he kidded, then brought up the inflationary prices on the promenade. Pizza costs $12.50, a slice. When the audience chuckled, he stressed, “That’s a good deal there.” Boisterous laughing ensued. The crowd roared when he made a racy joke that involved bringing home roses for his wife after nearly forgetting her birthday!
Klar mentioned his hands shaking, then quipped, “I have to be careful when I eat.” Nonetheless, he nimbly played with a giant deck of cards and kept the rapt audience involved in a series of card tricks, offering participants cards to choose, then guessing their selections. He impressed by picking the right cards out of the deck or improvising a clever cover.
Comedy-magician Norman Klar performs card trick.
Klar enlists an audience member to help him execute the trick.
As Klar squeezed in an animal act, he said these creatures are found in South Africa, “where they’re killing all those people,” seeming to slyly reference the recent confrontation in the White House about what was really happening in South Africa. It was the closest to politics we came.
Headliner and local comedian David Graham in Yardley, Pennsylvania.
Headliner and local comic David Graham said the audience looked like “a Hallmark movie crowd.” After watching several of these films, Graham felt he could write one himself. “It’s the same story every time. The corporate lawyer comes to town. She’s going to buy the candle shop from this guy…. They always walk through the mistletoe and her heart melts,” he said. Notably, Hallmark Channel Christmas movies are more popular than average in America’s 196 Exurbs like Bucks County, according to the 2024 MRI-Simmons consumer survey.
Graham went on about how controlling a Fitbit can be, besting a bad Jersey driver on I-95, and joining his wife on weekend girls’ trips to Vegas to people-watch. About his wife of many years he playfully joked, “We still get each other; we don’t understand each other.” Some winding stories Graham shared about his connections and couple dynamics were on the raunchier side — but got a lot of laughs in the room. Graham closed out the show to hoots, claps, even whistles.
After wrapping, friends and regular comedy-goers Denise Kilian and Carrie Foraker said they had a good time. They liked Klar’s performance the most, especially the interactivity. Foraker encouraged her friend to come along this time after a tough week. The generational jokes landed well because “they’re true,” said Kilian from nearby Levittown who owns an outdoor living supply business with her husband in Princeton, New Jersey. She said she may see another show here. Her friend, Foraker of Langhorne, Pennsylvania, enjoys a range of humor. “I’m pretty open-minded. Left, right, that’s why we live in the United States of America, right?”
Ari Pinkus is senior editor/writer/researcher and project manager at the American Communities Project.
Jenna Modica is a production assistant and freelance writer in Los Angeles with experience across indie films and large-scale production.
Sarah Murphy is a recent Albuquerque, New Mexico, transplant who enjoys writing about the intersection of people, place, and community.
Jenna Fisher is a veteran journalist, educator, and doctoral student in journalism with more than 15 years of experience reporting for outlets including The Christian Science Monitor, The New York Times, and Swimmer Magazine. Her research and teaching focus on media and news literacy, preparing people to engage critically and constructively with today’s complex media landscape.
Jake Pinkus is a freelance digital producer and founder of Pinkus Partners in the Chicago suburbs.
Kathleen Majorsky is a professional freelance writer with more than 15 years of experience in email marketing, journalism, and newsletter creation.
As the American Communities Project has explored divisions in the nation these last few years, immigration has stood out as an especially complex issue. People see it differently depending upon whether it is framed as local issue or a national one.
As a local issue, immigration is just one of many problems their communities face, and it ranks below several other concerns. But as a national issue, immigration is a serious threat to the nation that needs to be addressed. Furthermore, survey data show that people in every community type see the issue as a much bigger problem for the nation than they do for their communities.
Some of that dissonance seems to be about the difference between firsthand and secondhand experience with the issue. And this week’s unrest in Los Angeles offers another example of why immigration is so divisive and intractable on the American political scene.
National v. Local Feelings
The 2024 ACP survey on American fragmentation asked respondents about a series of issues, more than 20, everything from unemployment to abortion to taxes — and, of course, immigration. The survey then asked people to pick the three that were the most important “in their community” and “in the country as a whole.”
In 2024, the top five community issues led with inflation, as might be expected, which was far and away the biggest concern, followed by taxes, homelessness, healthcare, and then immigration at only 17%.
But when respondents were asked about the biggest national issues, the list changed dramatically.
Inflation was still the No. 1 issue, again, as expected, but the number of voters citing it fell slightly. Immigration placed second among all respondents, at 31% — 14 percentage points higher than the number citing it as a local issue.
That’s a noteworthy finding. It suggests that immigration is not (or was not) a pressing issue on the ground where people live. In their lived experience, it didn’t rate as a big concern. But when the question moved to a national context, immigration was seen as a much bigger problem — and that was true in every community type.
Among the Community Types
The data show big increases in people saying immigration is a top concern “in the nation as a whole” in every type, double-digit jumps in all of them except the Hispanic Centers, where a larger share of the population (28%) said immigration was a top concern locally. (We only included 13 of the 15 types on this survey question due to time constraints.)
But three types stood out for showing the biggest jump for immigration as a top national concern: Graying America, Middle Suburbs, and Rural Middle America. They all saw increases of 20 percentage points or more, and they are similar in three important ways.
First, none are very racially or ethnically diverse. Second, they all voted for Donald Trump by double-digits in 2024. And third, they do not tend to have large foreign-born populations. In fact, the “foreign-born” figure for all those community types is 7% or less. The national average is 14%.
Those data suggest that immigration is not an issue with big everyday impacts on the ground in those places — or, at least, that the people who live in those places are not likely to run into immigrants too often in their daily lives.
So, what’s shaping the attitudes on immigration as a national issue in those communities — and really in all the types? It seems likely that news coverage and social media posts are drivers.
Inflation, crime, healthcare, and the general economy are issues most of us relate to directly through markers including grocery receipts, local police reports, the cost of doctor visits, and bank account statements.
Secondhand Knowledge
But most of us do not have firsthand knowledge of the situation at the border (something Ray Suarez wrote about for this site recently), nor have we seen a migrant “caravan” with our own two eyes. And, of course, most of us are U.S. citizens. In the ACP survey last year, only 38% of Americans said they had a close friend or relative who was an immigrant from another country. In some community types, the figure was much lower.
Our views on immigration are much more likely to be shaped by news reports and social media posts. Adding to the challenge, our research has shown people are becoming less likely to seek out news. They believe important news “finds them” and don’t generally spend a lot of time trying to suss out what’s accurate in the news they receive.
Those attitudes are all part of the larger story this week concerning the immigration protests in Los Angeles.
There’s no doubt that some of the protests have turned ugly and violent — and they are not over yet. But how widespread are they? And what is the real extent of the damage? Some media accounts suggest that while the images were intense, the areas affected were fairly small. Meanwhile, President Trump has called in the Marines to protect the city.
How one views the protests and immigration as a national issue is likely to be closely tied to what accounts and stories one reads, sees, and hears in the media. Most people don’t have a lot of in-person inputs on immigration in their daily lives. That leaves a lot of room for different understandings of what is an intensely divisive issue.
The nation’s attitudes toward higher education have grown complicated in recent years. Increasingly, many Americans have become skeptical of the importance of a bachelor’s degree, particularly Americans who lean Republican in their politics.
And the Trump administration has largely elevated that skepticism, cutting or revoking already-issued federal grants in a variety of areas, including medical research to the tune of more than $160 billion. At the same time, the administration is threatening deeper cuts and criticizing diversity, equity, and inclusion programs at institutions.
But the nation’s college and universities are more than just educational hubs for the next generation, they are economic drivers in small towns and big urban centers around the country. And an analysis from the American Communities Project and the Economic Innovation Group, a bipartisan public policy organization, finds two points are generally true:
Communities with a college or a university tend to have higher per capita GDPs than neighboring communities.
Communities with big, “tier 1” research universities that receive big government grants, generally do even better with their per capita GDP than similar communities.
The data suggest that the spin-off commerce created by the schools has an outsized impact on their communities, big and small, all over the country. And cutting funds to the nation’s institutions of higher education is likely to have larger impacts that will be felt on and off campuses in the months and years ahead.
What Is a College Town?
Colleges and universities don’t exist as islands; communities grow up around them to serve them. Some of these communities are considered College Towns in the ACP — places where the college or university, or sometimes more than one, defines the locale.
There is a range of College Towns in the ACP rubric. Some are populous counties where one big university dominates, such as Boulder County, Colorado, home of the University of Colorado. Some are smaller counties where a smaller school has a disproportionate impact, such as Buncombe County, North Carolina, home of UNC Ashville. And some house several smaller campuses, such as Dauphin County, Pennsylvania, home of Harrisburg University, Penn State-Harrisburg and a satellite campus for Temple.
But overall, the data shows a clear story. The College Towns in the American Communities Project have a higher per capita GDP than the counties around them. And the effects are even larger for “tier 1” research schools, the 187 institutions that are classified as having “very high research spending and doctorate production” in the Carnegie Classification of Institutions of Higher Education.
In College Towns without “tier 1” schools (communities with smaller schools or collections of small schools), the per capita GDP was more than $7,000 higher than it was in surrounding non-College Town counties.
And in College Towns that are home to a big research schools, the impacts are much bigger. The per capita GDP in those counties is $16,000 higher than the surrounding non-College Town counties
Regardless, the takeaways from the data are hard to ignore: College Towns tend to be economic drivers for their broader regions. Some of this business serves students — restaurants, bars, stores — but part of it is the impact of the institutions themselves. Colleges and universities hire a lot more than professors. There are student support staff, maintenance staff, HR staff, and other university workers.
When the federal government cuts money to those institutions, all those employees take a hit. Less scholarship money and grants may also lead to fewer students, which means local businesses suffer.
“Tier 1” Research Schools
And, of course, there are colleges and universities that exist outside the ACP’s College Towns category. There are colleges in Big Cities, big dense Urban Suburbs, and urban fringe Exurbs.
To understand the impact of the nation’s big research universities (the schools facing bigger cuts from the Trump administration), the ACP and EIG looked at per capita GDP in communities with and without “tier 1” research schools across the ACP types.
Again, the data are largely clear.
Those high-research schools are in nine of the ACP’s 15 types, and in most cases communities with such an institution do much better than their non-college counterparts.
The “tier 1” difference in per capita GDP in the Exurbs is +$17,000.
In the Big Cities, the difference is +$29,000.
The difference in the African American South is close to +$40,000.
The two outliers here are Middle Suburbs and Hispanic Centers, which both have a negative “tier 1” difference (-$6,000 and -$33,000, respectively). However, those numbers are drawn from very small samples, three total schools in those two types.
To be clear, in a lot of these communities, the universities are smaller parts of a much bigger story. The fact that these communities were not labeled College Towns is an indication that the schools are not their dominant trait.
Still, the fact that those with big research schools tend to do much better suggests that having a big research school in your backyard pays dividends or at least is part of having a vibrant economic community.
Going Forward
These data may not change how a lot of people feel about the state of higher education in America. The great battles over “woke-ism” and whether college is “worth it” will continue. Like many other issues in the nation right now, much is being driven by cultural divides — what people on different sides of the political spectrum think they are supposed to believe.
And, it should be noted, these latest political headwinds for colleges and universities are coming at a time when many smaller, mid-tier schools are struggling with enrollment declines as a demographic cliff looms for the U.S. college-age population. Those drops may be lessening the potency of mid-tier colleges as economic drivers.
But the numbers here indicate that colleges and universities and College Towns still play a significant economic role in the nation beyond their part in educating the next generation. They are economic drivers in local economies scattered across the country, and cuts to them will have likely have unforeseen impacts that will be felt all over.
The current White House has made many bold promises, but near the top of the list is the pledge to reverse the decline in the nation’s manufacturing sector and usher in a new “golden age” in it.
When you look at the data, however, that task looks to be remarkably tall to the point of being almost impossible. The American Communities Project looked at U.S. Census data since 2010 and found that manufacturing jobs have actually increased in the United States overall and in nine of the 15 community types. Urban and suburban places have seen most of the gains.
The declines have come “per capita.” That is, manufacturing jobs have become a smaller percentage of the workforce in nearly every community type in that time. But labor force experts believe much of that loss is likely attributable to automation.
Manufacturing in the ACP
Data from the U.S. Census American Community Survey finds there were about 15.6 million jobs in the manufacturing sector in 2010 and about 15.9 million in 2023, the latest data available for all counties in the United States. The biggest increase came in the Exurbs in the ACP, which saw an increase of about 144,000 manufacturing jobs in that time.
Close behind were the Urban Suburbs, which added about 141,000 jobs in the sector in the same time frame. Then came the College Towns, which added some 62,000 manufacturing jobs.
There are some big caveats to those numbers. First, all those places saw manufacturing decline as a percentage of total employment in this time period. Second, remember that in 2010 the United States was just emerging from the Great Recession, so some of the increases may be due to relatively low figures in the 2010 data.
Furthermore, the Middle Suburbs, the blue-collar communities largely around the Great Lakes that have become crucial in elections in states such as Michigan, Wisconsin, and Pennsylvania, have seen a much smaller increase of only about 31,000 manufacturing jobs in that time, not enough to keep up with population growth.
Still an increase in jobs is an increase in jobs and with that in mind, it’s hard to ignore the larger point in the data: the power of urbanicity.
There is a lot going on behind those declines. First, the working-age population in many of those communities is growing slowly or even declining. But beyond that, some of those declines may be due to the broader long-term changes in manufacturing, including a move toward automation that requires larger capital expenditures on big machines that do the work humans used to do.
Over the last 40-plus years, there has been a steep drop in manufacturing employment. In 1979, more than 19 million people had jobs in manufacturing, according to the Bureau of Labor Statistics, which offers a slightly different measure of manufacturing jobs. By 2024, that figure was about 13 million people.
And remember that drop happened as the population of the United States grew by more than 100 million — from about 225 million to more than 330 million.
Add those numbers up and it looks like a massive decline for manufacturing. But a funny thing happens when you look at the data differently. When examining manufacturing output as a percentage of real GDP, that is GDP adjusted for inflation, the numbers look fairly flat, over a very long period.
Ivan Illan, chief investment officer for the firm AWAIM, notes that since the 1940s, manufacturing has contributed about the same percentage to U.S. GDP, somewhere around 12%. Economists at the St. Louis Federal Reserve wrote in 2015 that the percentage had bounced between 11.3% and 13.6% in that time. (The number was a little lower in 2024, about 10%, but that was largely due to the impact of inflation.)
How’s that relatively flat number possible? Manufacturing has become more efficient, and it has become cheaper to produce products made in the United States “likely because of automation.”
Challenges Ahead
To be clear, the message here is not, “Well then, everything is rosy.” The losses in manufacturing employment are real, they disproportionately hit the more rural communities in the ACP, and that momentum isn’t likely going to stop.
For years now, much of the discussion around manufacturing losses has focused on the loss of “small manufacturing.” Those are the kinds of firms that were once big job providers everywhere, but especially in small rural communities. The ACP has visited those places and seen communities dealing with the losses. Big capital investments can be hard in small communities.
Taken together, the data suggests bringing back a “golden age” of manufacturing — or at least manufacturing employment — is going to be especially difficult in rural America and, frankly, difficult in the United States overall.
Ultimately, there may not be a lot of manufacturing jobs to bring back because many of our ideas about manufacturing — men standing along an assembly line doing repetitive tasks — are increasingly outdated. The world has changed. Turning back the clock on history may make for good politics, but it’s a less workable strategy in reality.
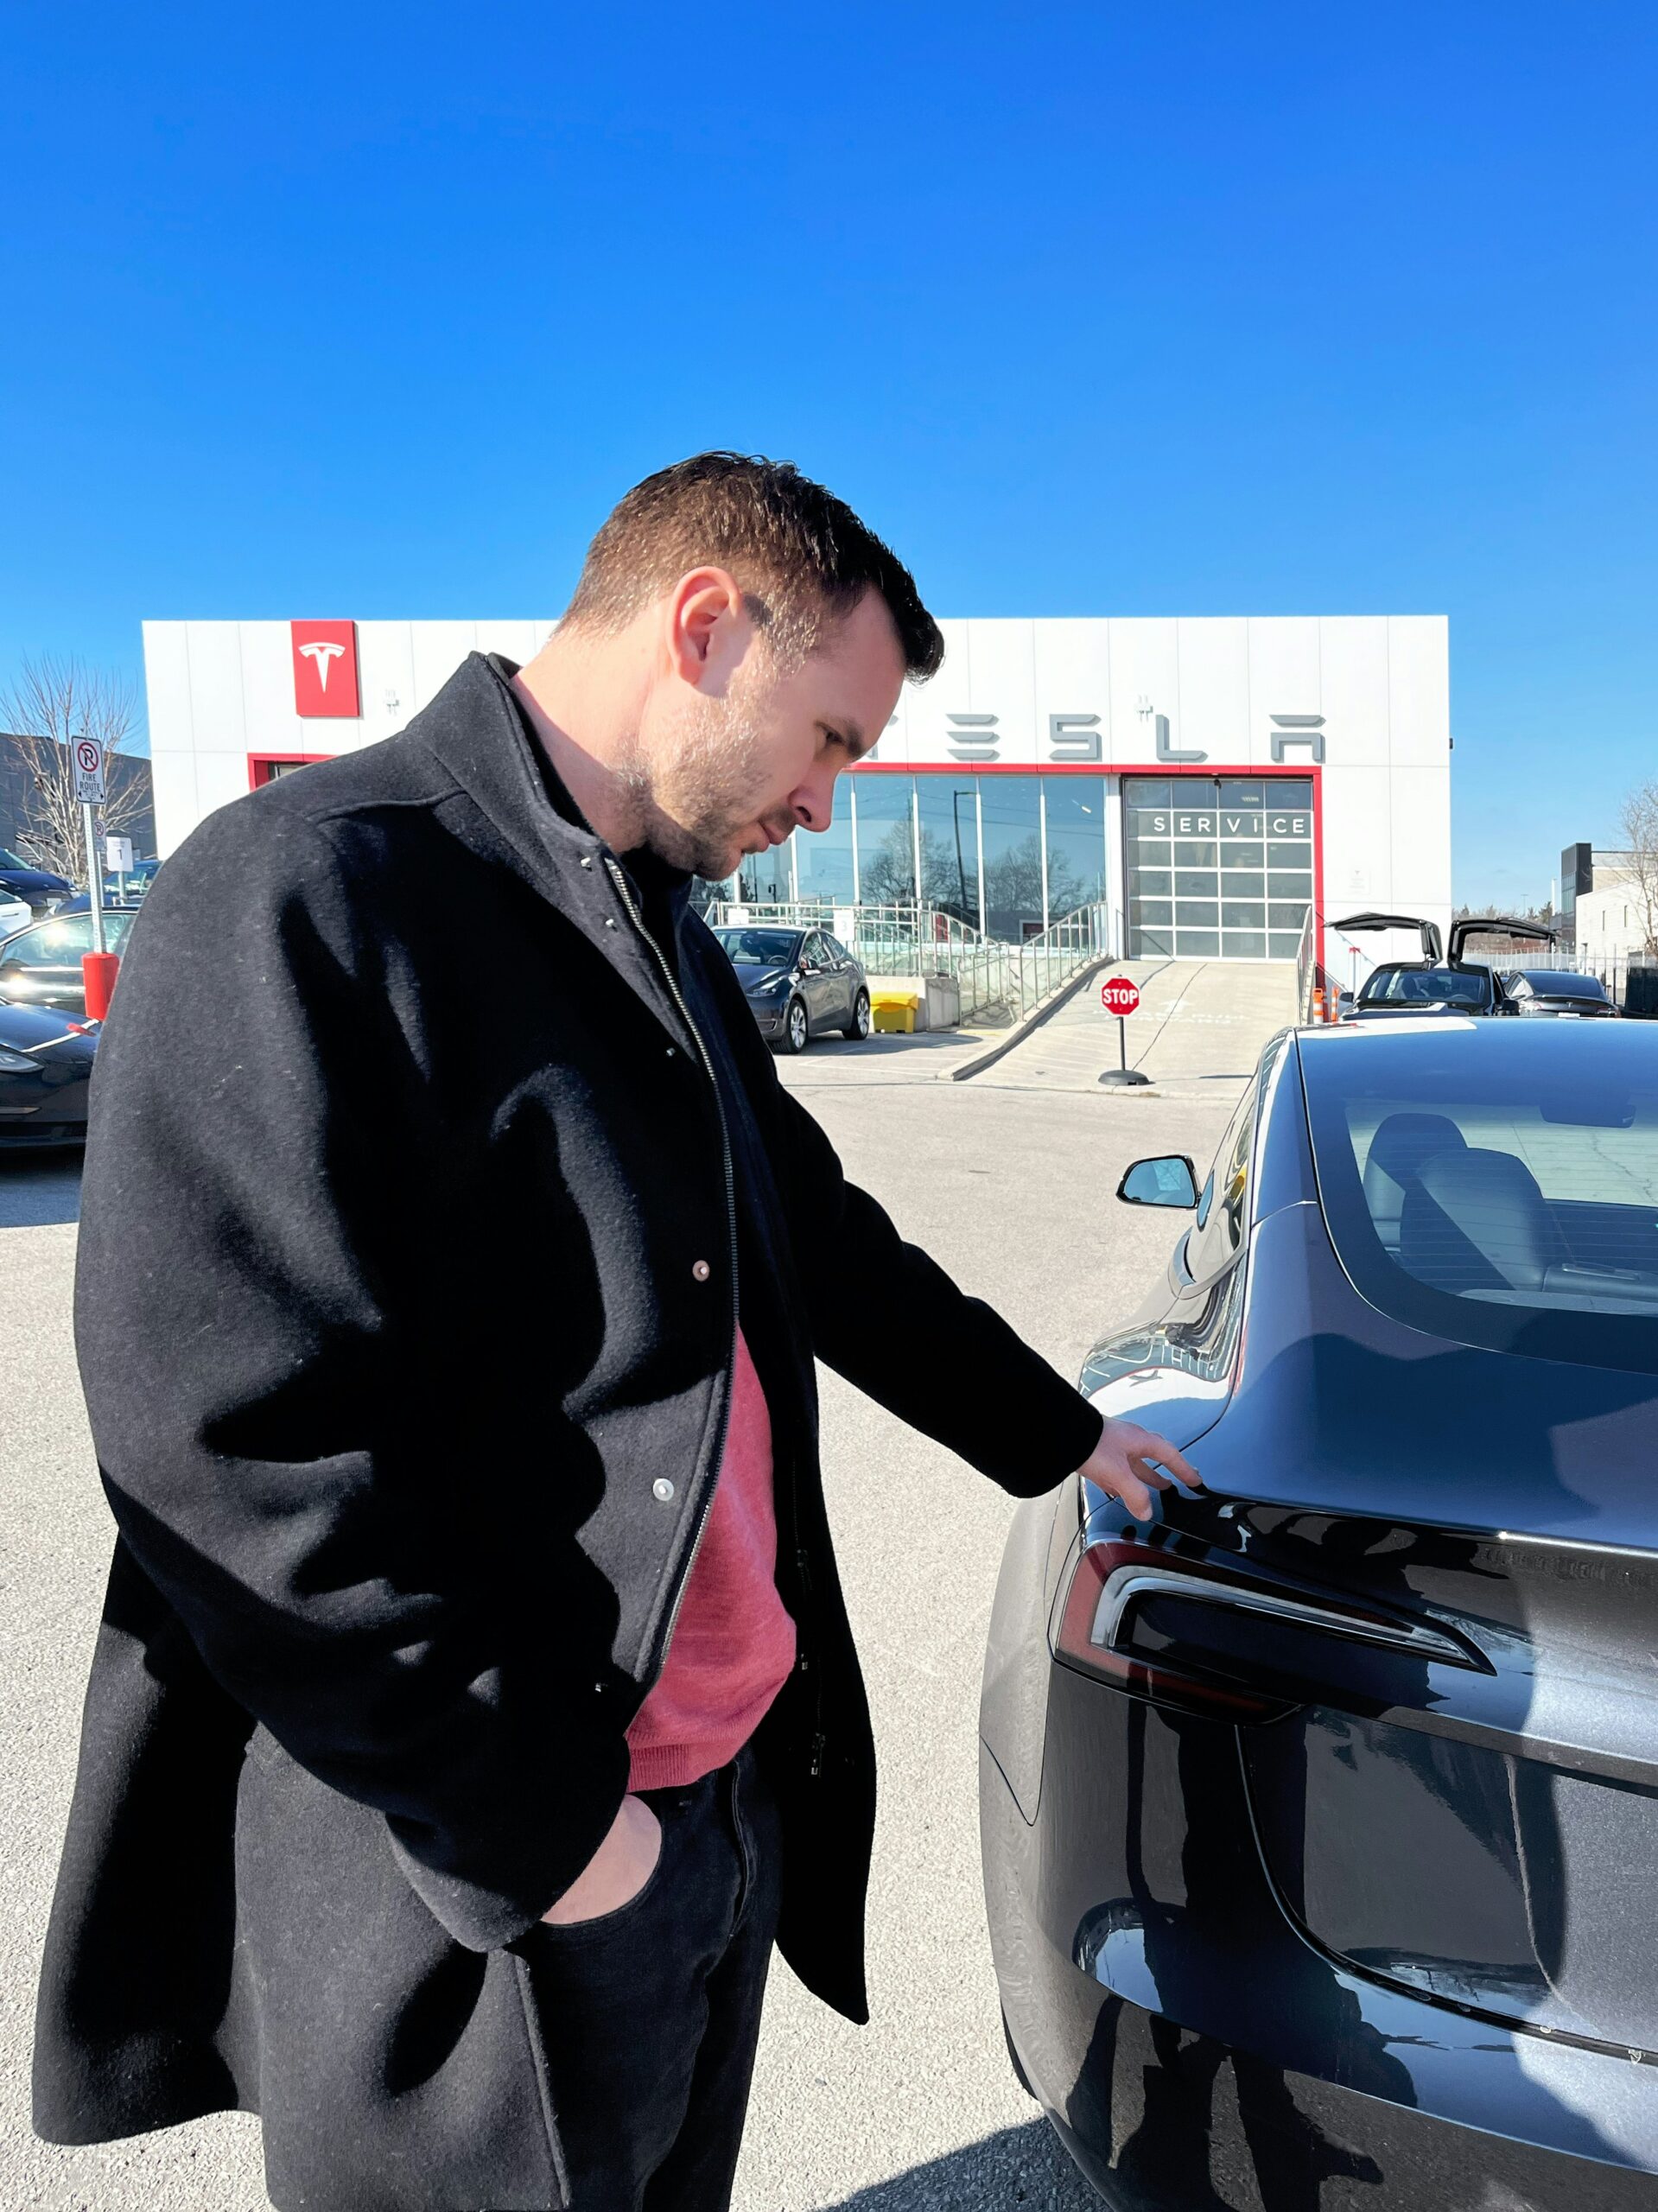
The line between consumerism and politics has become increasingly blurry in recent years — and that can create problems for business owners who hold strong political beliefs at odds with their customers. Just ask Elon Musk.
Before he was dominating the headlines as the head of the Department of Government Efficiency (DOGE), Musk was a businessman and owner of well-known companies such as the social media platform X (formerly Twitter) and the aerospace company Space Exploration Technologies. But before aiding the Trump White House, Musk was probably best known as the owner of the electric car company Tesla, which has also been making headlines of late … for the wrong reasons.
Tesla’s income dropped by a startling 71% in the first quarter of 2025, and one big reason is thought to be Musk’s role with team Trump. In response, Musk announced he will spend less time at the White House and more time trying to get Tesla back on track. But it may not be that simple.
In many ways, the data suggest that the two sides of Musk — the businessman and the political force — are in conflict.
Recent polling data from Gallup makes it pretty clear that the electric car consumer base and the Trump voter base look very different. The Gallup numbers found that people who own or would consider buying an electric vehicle are more likely to be Democrats than Republicans (71% versus 31%). They are also more likely to have a college degree than not (61% versus 46%), and more likely to make more than $100,000 a year than they are to make less than $50,000 (56% versus 47%). All are data points at odds with Trump’s blue-collar base.
Tesla Dealers in the ACP
And viewed through the American Communities Project’s 15 types, the problem is even more clear. The geographic tribalism that has come to define the nation presents special challenges for Tesla. (This set of data comes from an analysis the ACP did for Business Insider.)
Of the roughly 275 Tesla dealerships in the United States, more than three-quarters (213) are based in the Big Cities, Urban Suburbs, College Towns, and African American South, according to data from ScrapeHero. Of the 15 community types in the ACP, those were the only four that did not vote for Donald Trump in the 2024 election.
And the two community types with the most Tesla dealerships by far are the Big Cities and Urban Suburbs. There are almost 200 Tesla dealerships in those community types alone, and Democrat Kamala Harris won them both by double digits last November — 27 percentage points and 13 percentage points, respectively.
That’s not a huge surprise, of course. Electric cars remain expensive, and their makers are still trying to grow market share. It makes sense that Musk would want to locate the dealerships in very populous areas where households have higher incomes.
To be clear, the politics of the Big Cities and Urban Suburbs are not uniform. Republicans live in those places, too. Even in Washington, D.C., the bluest of Big City communities, some 6% of voters (about 21,000 people) cast ballots for Trump in 2024. That’s not insignificant.
And, of course, people can travel to shop for a car. The dealership can be a few counties away if the buyer is motivated. But the data show the challenge of doing business in a country where consumption has become part of the political divide.
The demographics behind the ACP show that Musk would have been better off locating more Tesla dealerships in Exurbs. They seem to fit the electric vehicle consumer profile better than other right-leaning communities. Trump won the Exurbs by 14 percentage points, and those places tend to have higher median household incomes and more college degrees than other Trump-friendly communities.
Consumerism in the ACP
The impact of the Trump/Musk bromance on Tesla is not exactly a surprising development. It’s simply the latest example of politics impacting consumer behavior. Before Tesla there was Bud Light. There was the dust-up over Disney. Even looking at someone’s blue jeans can be revealing, we explored in The Wall Street Journal.
But Tesla’s situation is more problematic in some ways. One can sell beer or jeans anywhere. It’s a question of shelf space. And TV and movies can find their audiences where they live over any number of devices and platforms. A car dealership is the definition of a brick-and-mortar experience. Customers need to come in, have a seat, take a test drive. Shopping is done in person.
If you’re a car company and your outlets are in the wrong place, the fix is more complicated — especially if you are a newer car company without an extensive dealer footprint.
Of course, the current Tesla situation is unlikely to be the last time that consumer choices bump into politics. Much of the ACP’s work focuses on how different communities are developing different cultures within the United States, and consumerism is clearly a big part of those cultural divides.
Increasingly, shoppers are bringing their politics with them to the store — and to the online marketplace. The ACP has a vast collection of consumer data from MRI-Simmons, the consumer research firm, which we will continue to explore in the next year.
For the 55th annual Earth Day on April 22, EARTHDAY.org outlines an ambitious goal: triple the amount of clean electricity by 2030. Meanwhile, President Trump signed an executive order on April 8 to block climate change policies at the state level. As Reuters reported: “The order directed the U.S. attorney general to identify state laws that address climate change, ESG initiatives, environmental justice and carbon emissions, and to take action to block them.”
Amid the cross purposes, the American Communities Project sought to delve deeper into American attitudes on climate change and the environment by examining a series of questions from the latest MRI-Simmons consumer survey taken from September 2021 to August 2023 and broken down into our 15 community types in fall 2024.
The results show that Americans see the environment and climate change as very important concerns to address. Across communities, residents agree that climate change is a serious threat and overwhelmingly believe the government should pay more attention to environmental issues. By and large they don’t believe people who are worried about the environment are overreacting. And a significant majority in all community types say when it comes to preserving the environment, helping to preserve nature is very important.
On business aspects, there is less convergent thinking. For example, residents are about split on whether any product that pollutes the environment should be banned, while more than a third say a company’s environmental record is important in their purchasing decisions.
Broadly Seen as a Threat
Principally, a significant majority of Americans said they somewhat or completely agree that climate change is a serious threat. Among the community types, the lowest percentages were in the rural Evangelical Hubs and Working Class Country communities at 61% and 63%, respectively. These figures were seen as slightly below average for their rural populations in the South and Appalachia. All other community types were in the mid-60s to mid-70s.
More Government Attention Wanted
Overall, 76% of Americans said they somewhat or completely agree that the government should pay more attention to environmental issues. There was not much deviation among the ACP’s 15 community types, and all 15 fell in the average range for their populations. In Big Cities and Urban Suburbs, the highs were 80% and 79% respectively. In Evangelical Hubs, Working Class Country, and Rural Middle America, community types that are often wary of government intervention, the percentages reached the low 70s.
These new findings track with what Jennifer Marlon of the Yale Program on Climate Change Communication and the Yale School of the Environment told us four years ago after analyzing surveys from the Climate Change in the American Mind project: “Perhaps surprisingly, however, majorities of Americans in every state think citizens and corporations should do more to address global warming. And majorities in all but three states (Wyoming, North Dakota, and West Virginia) think Congress should do more to address global warming as well.”
Environmental Worries Are Not an Overreaction
On the flip side, overreaction to environmental worries is not a shared concern. Just 27% of Americans said they somewhat or completely agree that people who are worried about the environment are overreacting. Agreeing reached the low 30s in Evangelical Hubs and Working Class Country — considered above average for their populations. The African American South and Native American Lands, rural communities struggling with entrenched socioeconomic and demographic divides, were also above average in the 30s.
Majority Agree on Importance of Preserving Nature
At the national level, 64% said helping to preserve nature is very important, and just 11 points separated the 15 community types. Again, Evangelical Hubs and Working Class Country were at the low end with 57% each, while Big Cities were at the high end at 68%. Notably, in both Evangelical Hubs and Working Class Country communities, the percentages with adequate access to locations for physical activity were also at the low end at 48% and 53%, respectively.
Divide on Banning Products that Pollute
Nationally, 54% said they somewhat or completely agree that any product that pollutes the environment should be banned. A split is evident within and between community types, running from 48% in the LDS Enclaves to 58% in the Big Cities.
Just 40% nationally said they somewhat or completely agree that “a company's environmental record is important to me in my purchasing decisions.” This was most voiced by residents in the Big Cities and least in the Evangelical Hubs. Notably, just eight points separated the 15 community types. All places stood above 33%, and none deviated from average range given their populations.
Valuing the Environment
As Americans commemorate Earth Day this week, MRI-Simmons data validate climate change as a serious threat and the environment as a key societal value but show the limits of these concerns on individual purchase-making.
Another day, another rollercoaster for the stock market when the averages of the major indices go up and down. But while media organizations have focused intently on the fate of the Dow (and the Nasdaq and the S&P), the underlying question has been how many Americans have a vested interest?
The answer: It depends on where you’re looking, but probably less than you might think. Or that’s the answer according to consumer survey data from MRI-Simmons and the American Communities Project.
A little more than a quarter of Americans say they have money in a mutual fund, 24% say they have a 401(k) account, 5% say they have a 403(b), and 14% say they own stock. But the numbers vary dramatically in the ACP’s 15 community types and some of the responses raise new questions of understanding.
For instance, most mutual funds contain stocks as do most 401(k) accounts, so the people who own those things likely own stocks in some form. It’s possible, maybe even likely, that most people do not know the exact holdings of their retirement accounts.
Still, the numbers here offer a guide to understanding who in America may be watching the markets with some hesitation in early 2025.
Mutual Funds
Overall, 27% of Americans say they are invested in a mutual fund. But the figures are as low at 19% in the African American South and Evangelical Hubs and as high as 31% in the Urban Suburbs and Exurbs.
Mutual funds are not exclusively stock vehicles, of course. They are portfolios of investments that can holds stocks as well as bonds and other investments. But most of them usually contain at least some stocks.
And the community type numbers here follow a similar pattern that we see on other forms for investments. People in the Urban Suburbs and Exurbs are those most likely to be invested in a mutual fund. Those communities also have the highest percentage of people bachelor’s degrees and the highest median household incomes.
The Middle Suburbs are the next highest among the types and that likely has something to do with the historical employment in those blue-collar communities mostly based in the Industrial Midwest. The employers in those places were often larger manufacturing companies that gave their workers, many of whom were in unions, good benefits. The ACP sees similar trends around health insurance in these places — they are usually a little above the national average for coverage even though their incomes and educational attainment levels are not especially high.
Stocks
The number for stock ownership, 14%, is likely lower than most people would expect, especially considering the continuous coverage of the stock market gyrations in recent days. Even in the Urban Suburbs, where the stock ownership number is highest in these data, the figure only sits at 17%. And in five of the 15 community types, the percentage for stock ownership is in the single digits.
But the assumption is that these data refer to people being aware of owning a single stock — such as owning shares of, say, Apple. And despite stories about day traders or people who are constantly on their phones putting in buy and sell orders, these data suggest that behavior is limited to a small number of people.
Again, the community types leading the way here are the Urban Suburbs and Exurbs.
Retirement Plans: 401(k) and 403(b)
Retirement accounts, where many Americans invest to safeguard their long-term future, have been hit hard since the cascading tariff announcements. As the ACP zeros in on options available to workers at for-profit businesses, 401(k)s, and tax-exempt organizations, 403(b)s, it’s evident that more affluent communities have generally been more exposed to the market instability.
Drilling down beyond the 24% of Americans who said they have a 401(k), the LDS Enclaves — Mormon-dominated communities in the interior West where there is a heavy presence of technology firms — came in highest among the 15 types at 28%, considered above average. Unsurprisingly, affluent Exurbs and Urban Suburbs rounded out the top three at 27% and 26%, respectively. The two suburban communities’ index scores were on the upper end of average for their populations. Lower-income, rural communities of varying diversity were at the bottom of the pack: Native American Lands at 19%; African American South, Hispanic Centers, and Working Class Country at 21%; and Evangelical Hubs at 20%. Larger for-profit companies that offer such plans are scarce in these parts.
Meanwhile, just 5% nationally said they owned any 403(b) accounts, which are frequently offered to nonprofit and government employees, including those who work in public schools. Slightly higher than the national rate were Urban Suburbs, Exurbs, and LDS Enclaves at 6%. But so were Middle Suburbs in the Rust Belt, where globalization at the turn of the century led to much business stagnation and greater employment in tax-exempt organizations. The percentages with 403(b) accounts in the Middle Suburbs, Urban Suburbs, and Exurbs were all considered above average for their populations, while the percentages in Working Class Country, Native American Lands, African American South, Evangelical Hubs, and Hispanic Centers were all much below average.
The Point
If there is a big takeaway in all these numbers, it may be that the media’s focus on covering the daily rises and falls on Wall Street misses the larger story of what is going in Main Street, at least for now.
As the great tariff fight begins, the market indices may just be proxies for the psychological state of the people who play the markets. After all, right now the Dow and the S&P and Nasdaq are not really reacting to tariffs — they are reacting to the idea of tariffs. They bounce up and down with the hopes and fears of the investor class.
The better time to keep an eye on Wall Street is probably in the months ahead. If the tariff fight lingers without a real conclusion for months, the markets will become more than a space for speculative thinking about what could happen to the U.S. economy, they will be space to see how people are responding to what actually happens.
At that point, the moves in the market won’t just be affecting people who are invested, they will be broader signs about the state of the economy as a whole.
As Christians, Jews, Muslims, Hindus, and Buddhists celebrate the ageless rituals of Easter, Passover, Ramadan, Holi, and Vesak this sacred season, new research shows a cleaving between how Americans regard religion in their private lives versus the public sphere. Pew Research Center’s Religious Landscape Study of some 36,000 U.S. adults shows 62% of Americans identify as Christian; 7% identify with other religions, including Jewish (2%), Muslim, Buddhist, and Hindu (about 1% each); 29% are unaffiliated with a religion. While religious-secular diversity can be a fraught subject in America, individual faith remains a vital force around the country — and what faith means to individuals can vary greatly.
The American Communities Project’s analysis of MRI-Simmons consumer research collected from households between September 2021 and August 2023, and segmented into our 15 community types last fall, shows that Americans’ personal religious beliefs and daily practices are central to their lives. This is true no matter where they call home.
However, Americans are much less connected to organized religion, as seen in the relatively low numbers of service attendance. At the national level, a little more than a third of residents said they somewhat or completely agree that they attend religious services regularly, and even in the most religious kinds of communities, there was no majority agreement.
What’s more, as the new Trump administration establishes a White House Faith Office and moves forward on “defending religious liberty,” there are real divides on the role religion should play in the broader society. Nationally, Americans are split down the middle on whether religion should be the pillar of our society and whether the government should support prayer in school. Divides within and across the 15 community types are evident on these questions as well. The strongest support for religion’s prominence in public life is found in rural southern, midwestern, and Appalachian communities: the African American South, Evangelical Hubs, and Working Class Country. Their collective population is about 34 million.
Individual Beliefs and Practices
A clear majority of Americans, 58%, said holding to religious faith and belief is very important (as opposed to the two other given options: average importance at 12%, and not important at 29%). This significant majority view spreads across the 15 community types, ranging between 55% and 70% depending on the place. The African American South, Evangelical Hubs concentrated in the South and Midwest, and Working Class Country in Appalachia came in at the highest rates. There was no straight urban-rural divide on this statement. Aging Farmlands and Big Cities were both at 57%. Mormon-dominated LDS Enclaves and affluent Urban Suburbs were both at 55%. All four were considered in the average range.
Similarly, 58% nationally said they somewhat or completely agree that prayer is part of their daily life (though how they define “prayer” is not specified). The pattern here was a near mirror image of the results on religious faith and belief. Pointedly, in the ACP/Ipsos 2024 survey, a majority of African American South residents said their faith gives them hope for the future no matter what is happening around them. It was the only community type to reach above 50% on this statement about hope.
Little Embrace of Organized Religion
When it comes to organized religion, however, the numbers look different. Nationally, 36% reported that they somewhat or completely agree that they attend religious services regularly. Only three community types were considered above average, reaching the low to mid-40s: the African American South, Evangelical Hubs, and Working Class Country. Rural-urban and religious-secular divides were not always evident. For example, 35% of residents in both Big Cities and LDS Enclaves said they somewhat or completely agree that they attend services regularly.
Religion in Society
And the question of the role religion should play in American society really divides the country, according to these MRI-Simmons findings. Overall, 49% said they somewhat or completely agree that religion should be the pillar of our society. Clear majorities agreed in the African American South (62%), Evangelical Hubs (59%), and Working Class Country (59%). Military Posts, known for their conservative leanings, were also considered above average at 54%. The 11 other community types — encompassing a diverse mix of rural, suburban, and urban landscapes and lifestyles — were split down the middle or nearly so.
Similarly, Americans divided down the middle on the statement: “The government should support prayer in school.” Nationally, 50% of Americans said they somewhat or completely agree with the statement. Again, clear majorities in the African American South, Evangelical Hubs, and Working Class Country said they somewhat or completely agree. It was much more divided in other rural and urban-oriented communities: Rural Middle America, Native American Lands, Hispanic Centers, College Towns, Aging Farmlands, Graying America, Exurbs, LDS Enclaves, and Middle Suburbs. Notably, in some cases, more and less religiously diverse communities expressed similar views.
There are many well-known divides that define America in 2025 — red/blue, urban/rural, college/non-college — but the split along gender lines has become a dominant theme in the nation’s political and cultural discourse. National data show men and women view a range of issues, from health care to the economy, differently. But, as we recently noted, the gender gap doesn’t look the same everywhere.
To better understand how men and women see the United States more broadly, the American Communities Project analyzed male and female responses around hope for the future of the country in all 15 community types from our 2024 survey with Ipsos.
Two clear points jump out of the data.
First, on the whole, women seem to have a less hopeful view than men about the direction of the nation, both short- and long-term. That shows up in most of the community types and very different kinds of places, from the Aging Farmlands to the College Towns.
Second, the gender divides look very different in the community types. In some places, men and women seem to be largely in agreement about the near-term and long-term hopes for the country. In others, there were wide differences, and there are some where men are more dour.
The conclusion in the data seems to be the gender gap can vary greatly depending on where you live and your different cultural, social, and economic experiences. The charts below show the gender differences by community type on people’s hopefulness about the nation’s short-term and long-term future. Negative numbers mean people were less hopeful than hopeful.
Where Women Are Less Hopeful
For the most part, women in the American Communities Project/Ipsos 2024 survey were less hopeful than men about the nation’s short-term future (that was true in 11 of the 15 types) and long-term future (where it was true for 12 of the 15 types).
That finding was true in rural communities, such as Graying America, as well as communities with larger and younger populations, such as the Exurbs.
Some differences between men and women were larger than others (more on that below), but the relative consistency suggests that something bigger is surfacing in the data.
One could point to recent developments in the country on abortion, since the Dobbs decision that overturned Roe v. Wade and removed the constitutional right to an abortion. But some community types where women are less hopeful, such as the LDS Enclaves, are not especially driven by a pro-abortion rights stance.
Also, not all the community types where women are less hopeful than men are deeply pessimistic. For instance, in the Aging Farmlands, women are far less hopeful about the “next few years” than men are, but they are still very narrowly positive overall.
In general, the data suggest that women are, at the very least, more cautious than men about expressing hope for the future.
Where Men Are Less Hopeful
However, the point about women is not true everywhere. There are a few communities where men are less hopeful than women about the future of the nation — short-term and long-term — and some clearer trends emerge in the data.
In two community types, the African American South and Working Class Country, men expressed more negative views than women. While the two types are quite different in racial and ethnic composition, they have socioeconomic and cultural traits in common. Both are full of rural and remote communities, have relatively low levels of educational attainment, and are on the lower end of the median-household-income scale.
They are also places where jobs can be hard to find, which may be especially true for men. The small manufacturing jobs that were once a part of life here have dried up.
The numbers for Working Class Country truly stand out. That’s the only community type where men were a net negative on hope about the nation in the short-term and long-term. In both time frames, 53% of the men in Working Class Country said they were “not hopeful” about the future of the United States.
In Rural Middle America and the Military Posts, men said they were not hopeful about the nation in the short-term, but more hopeful in the long-term. As this survey was conducted in 2024, that may have had something to do with politics. Both community types went heavily for Donald Trump in the presidential election, and it could be their “short-term” view of the United States was about then-President Joe Biden.
The Sharpest Divides
In the charts above, a few community types stand out for conveying big differences in how men and women feel about the future of the United States — short-term and long-term.
Consider the College Towns. When it comes to the long-term future of the United States, women were decidedly negative — 55% were not hopeful about it. But 56% of the men said they felt positive about the nation’s long-term future.
The Military Posts, also home to many young people, saw a similar split. Among women in those communities, 56% said they were not hopeful about the nation’s long-term future, while only 43% said they were hopeful. Among men in the Military Posts, the numbers were much closer: 51% said they were hopeful, while 49% said they were not hopeful.
The LDS Enclaves also showed huge differences on gender. Short-term and long-term, 61% of women said they were not hopeful about the future of the United States. Meanwhile, men said they were hopeful about the nation’s short-term and long-term prospects.
What Is the “Why?”
These data raise as many questions as they answer. In the weeks ahead, the American Communities Project will visit different kinds of communities to better understand what’s driving these differences.
As we often note, survey data are good at laying out the size and scope of the challenges people feel in different communities, but they do not go very far in explaining why people hold the attitudes they do.
We’ll be exploring that question when we hit the road.
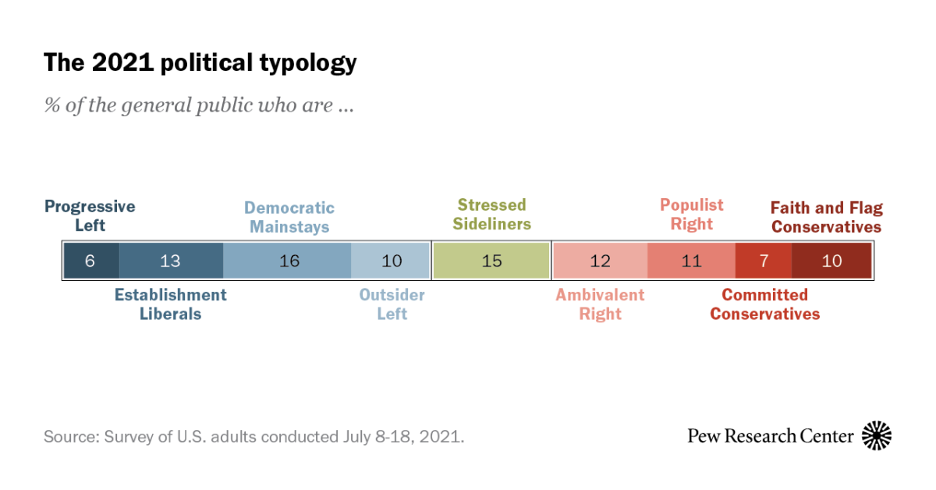
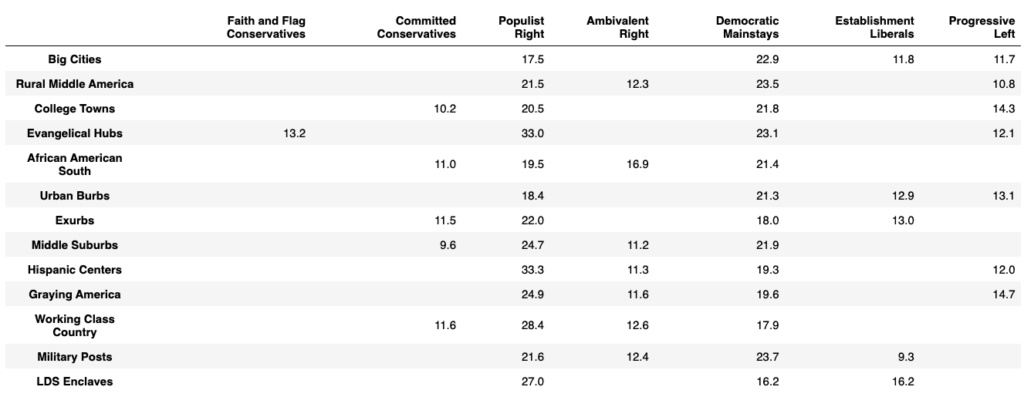 Source: GivingPulse. Note: Stressed Sideliners and Outsider Left don’t appear because they’re not very prevalent in any community type. We’ll discuss them in a future blog post.
 Marc Maxmeister helps organize and convert the world’s generosity data into meaningful insights into how giving works, and what organizations can do to improve the lives of people served. He brings context from mixed methods field research in Africa, rigor from his Ph.D. work as a molecular neuroscientist, and engineering from past AI-driven startups and nonprofits.
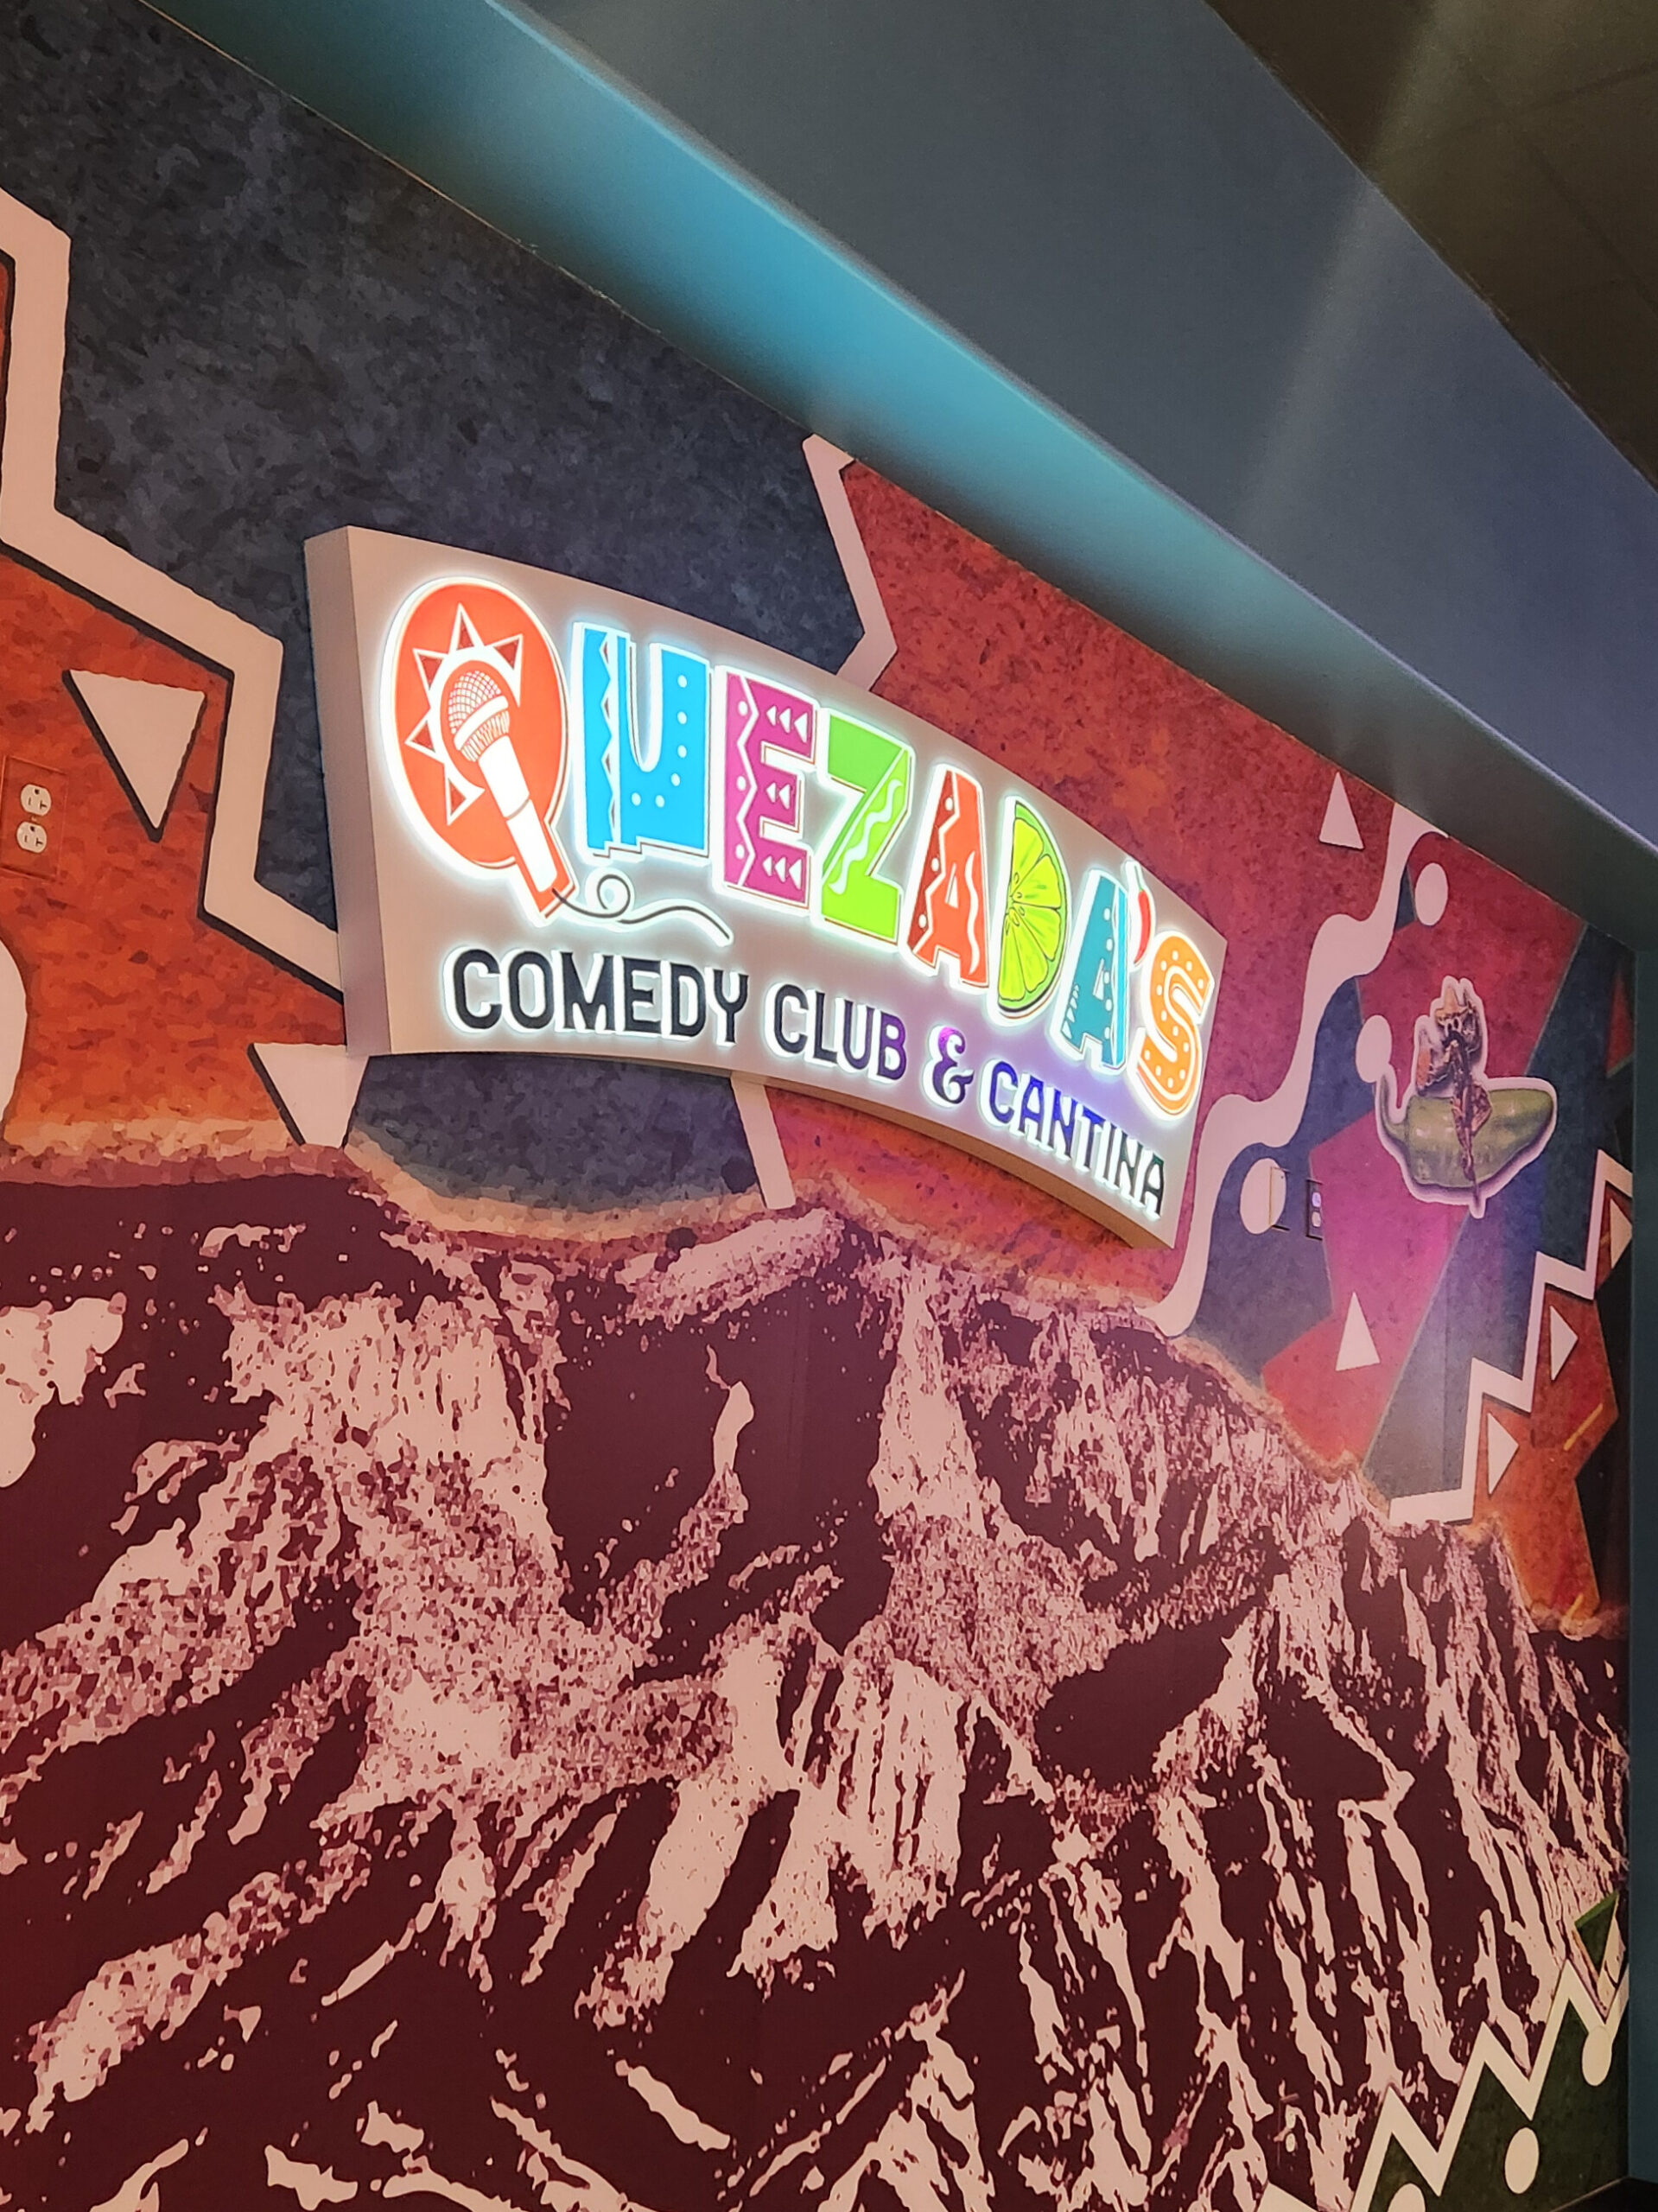
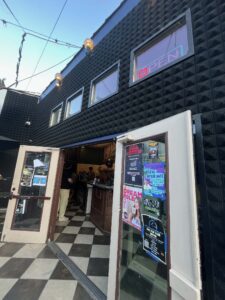
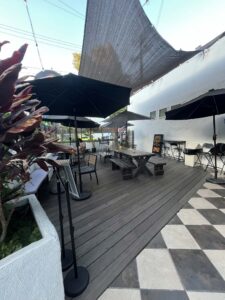
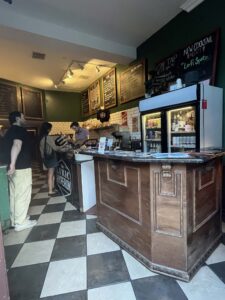
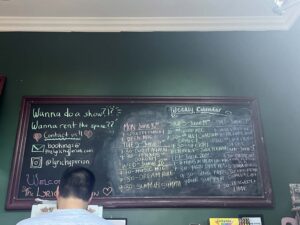
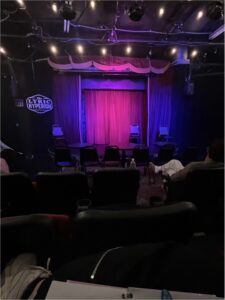
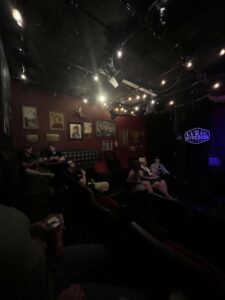
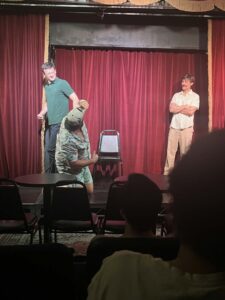
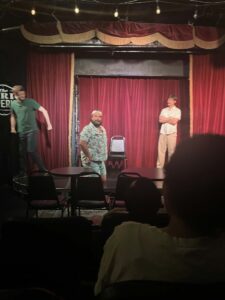
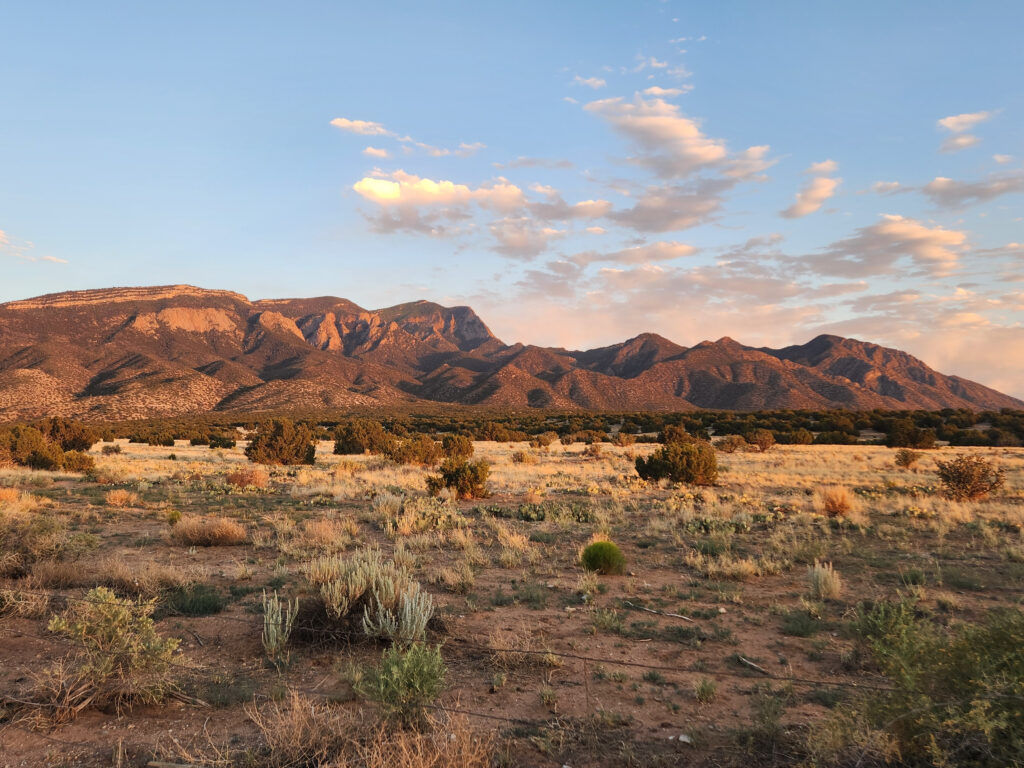
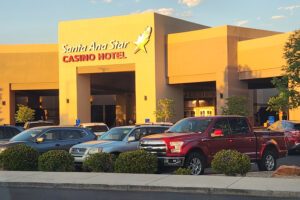
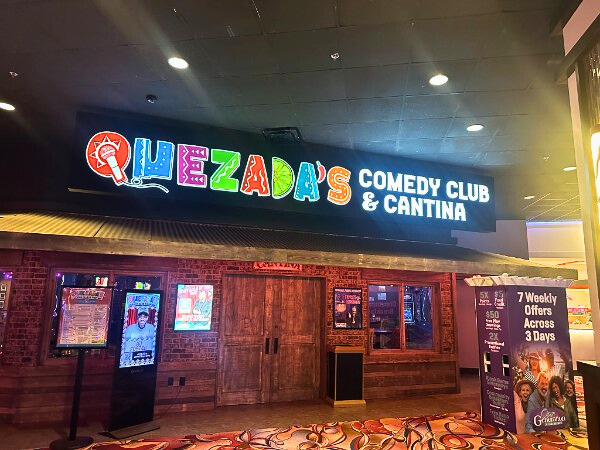
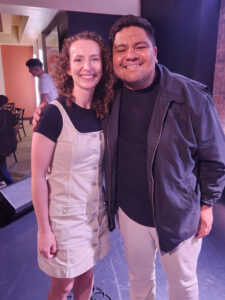
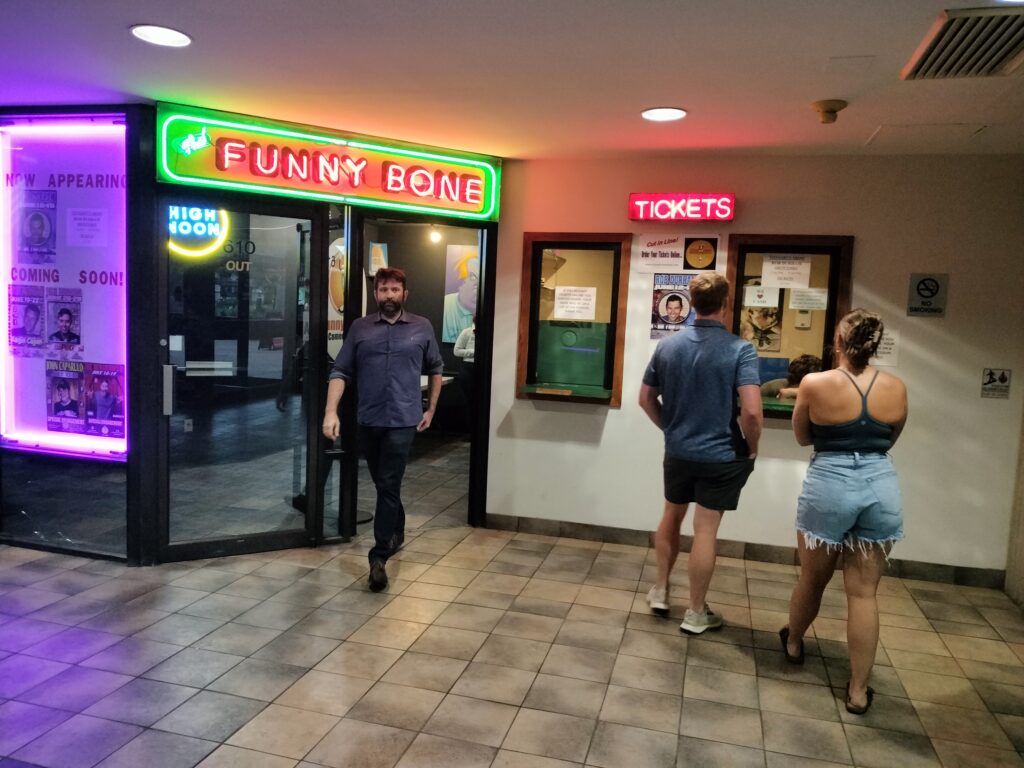
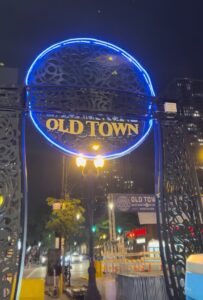
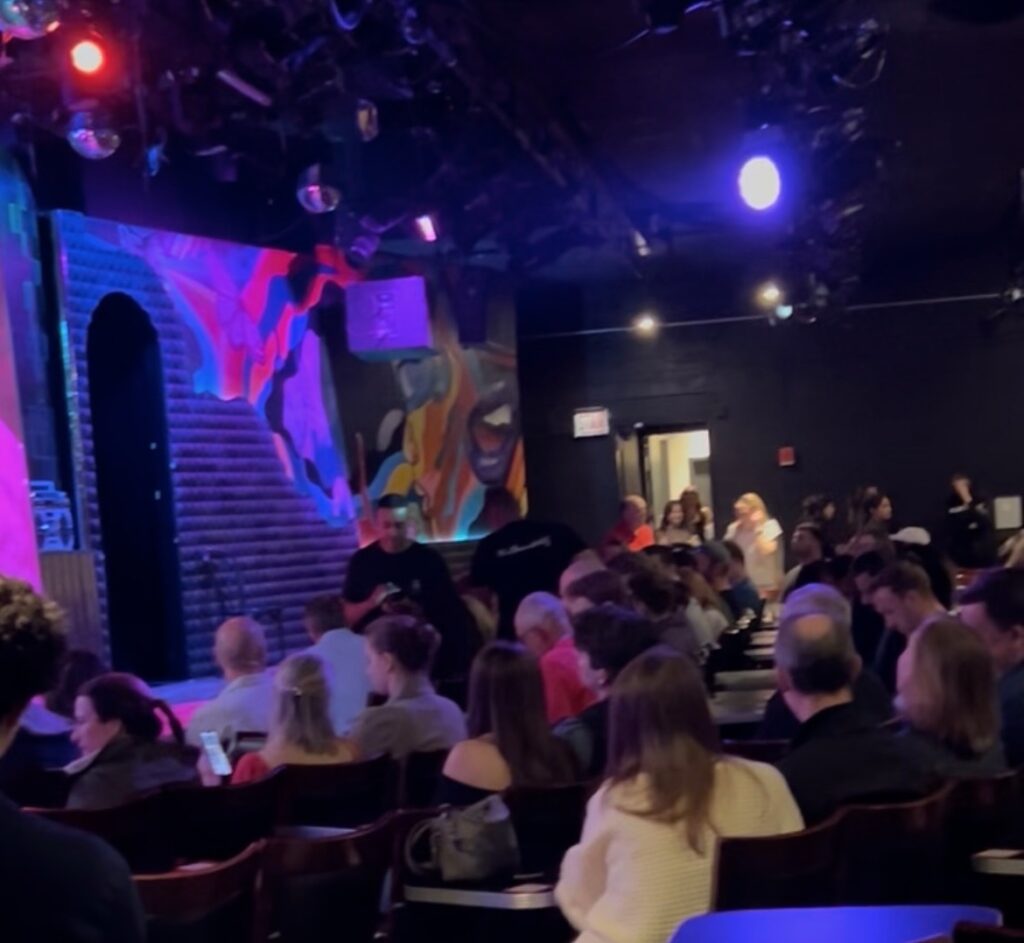
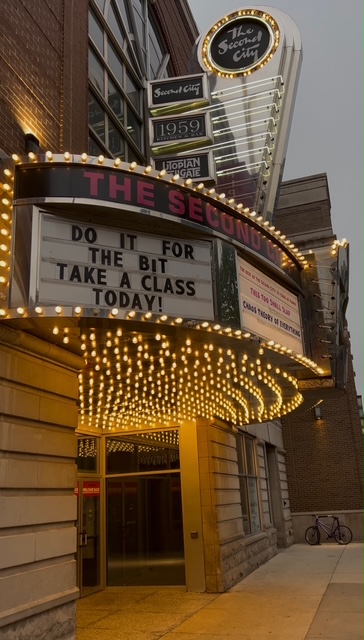
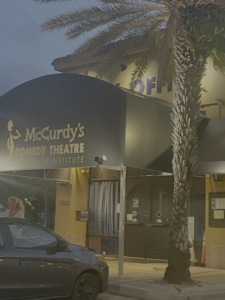
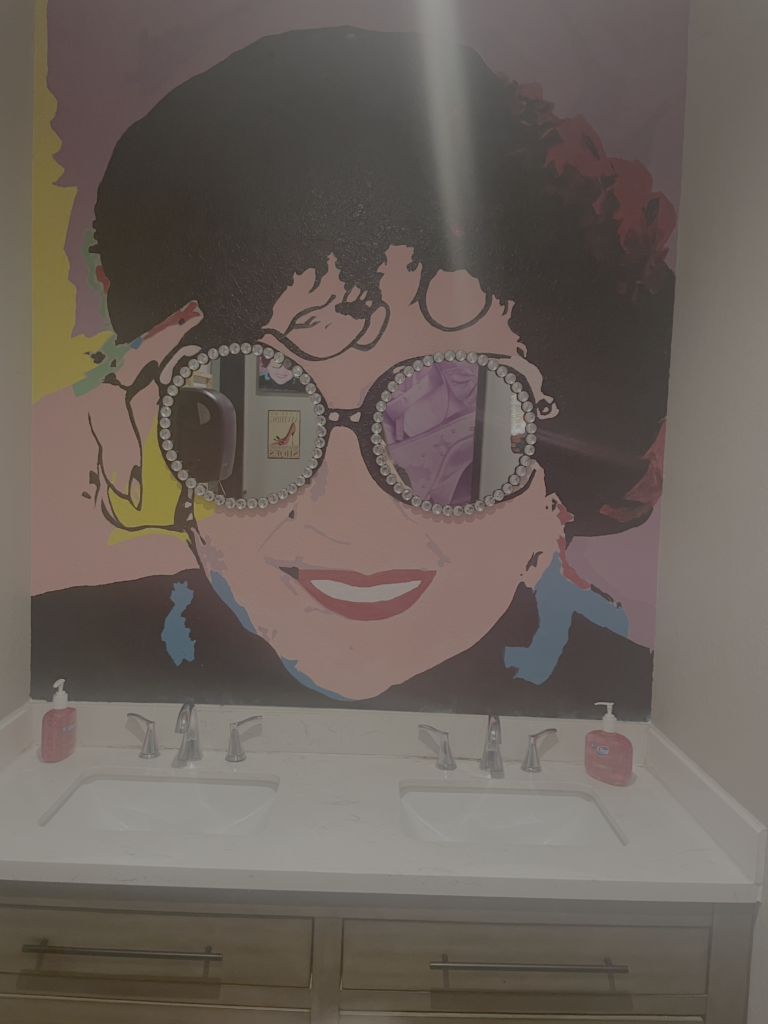
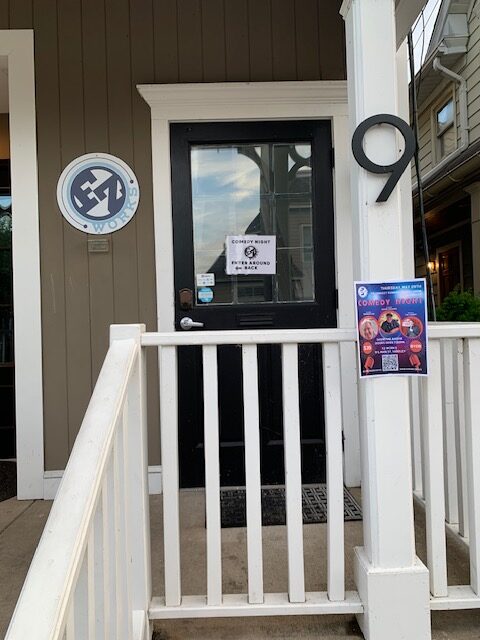
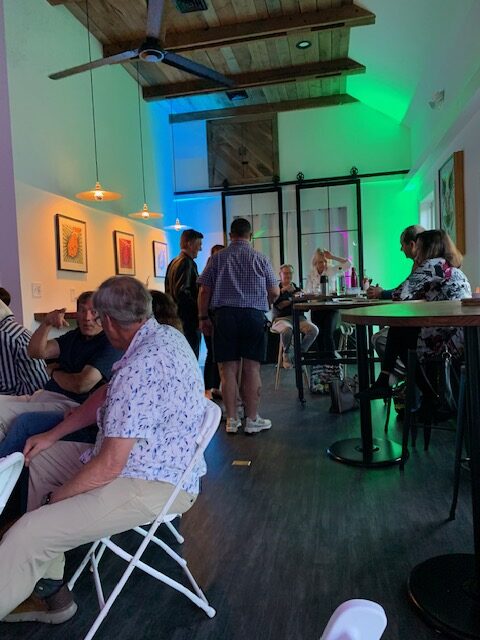
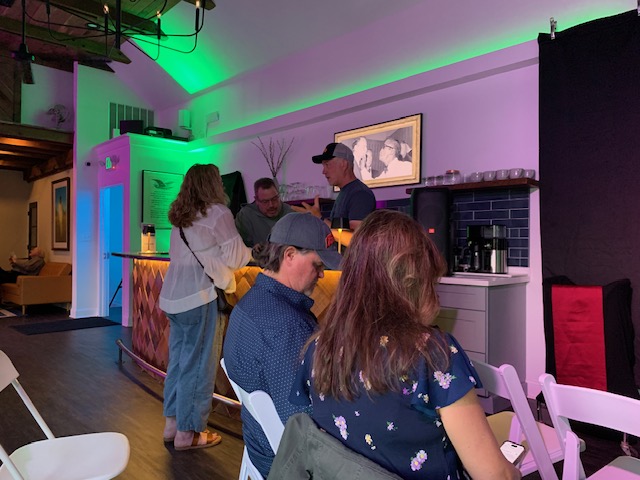
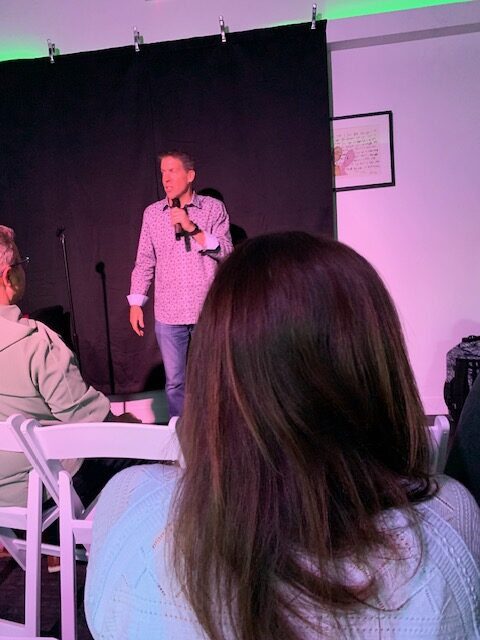
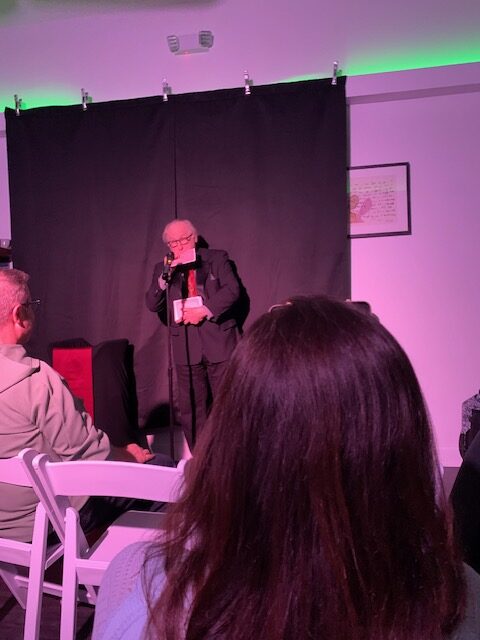
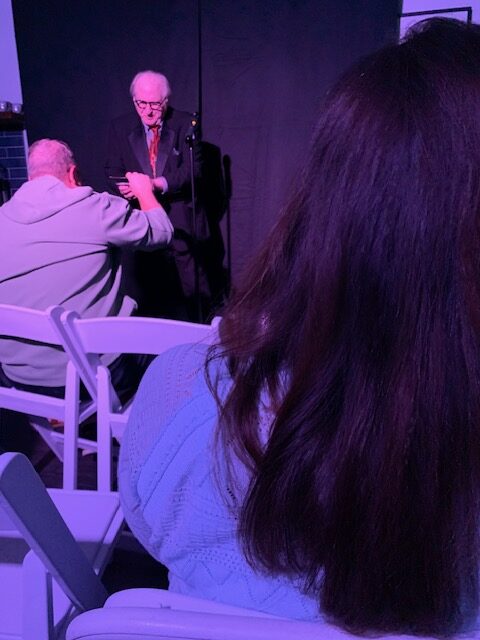
 Ari Pinkus is senior editor/writer/researcher and project manager at the American Communities Project.
  Jenna Modica is a production assistant and freelance writer in Los Angeles with experience across indie films and large-scale production.
 Sarah Murphy is a recent Albuquerque, New Mexico, transplant who enjoys writing about the intersection of people, place, and community.

 Kathleen Majorsky is a professional freelance writer with more than 15 years of experience in email marketing, journalism, and newsletter creation.