A perception schism exists over the degree to which “crime or gun violence” is a major national problem, according to the newest ACP/Ipsos survey of 5,000 people conducted in the late summer.
Lately, media coverage of crime in America has been relentless, from mass shootings to politically targeted assassinations. A notion of out-of-control crime has been the Trump administration’s reason for deploying National Guard troops to Los Angeles and Washington, D.C., this past summer and its effort to expand deployments to other cities this fall.
However, crime/gun violence is not seen as a significant national problem among residents living in most areas of the U.S. The one exception is the African American South, where real crime numbers have been higher than many places. Just above one-quarter of residents (27%) rated crime/gun violence as a top-tier national issue in the ACP/Ipsos survey. The concerns and challenges seem different here.
Meanwhile, in urban-oriented communities, including Big Cities, Urban Suburbs, and College Towns, the percentages of residents who said crime/gun violence was a top national problem sat in the upper teens. The 11 other suburban and rural community types came in at 16% or less.
Nationwide, 16% said crime/gun violence was one of the top three problems facing the country, placing it sixth in the list of top concerns. Comparatively, 41% of respondents cited inflation, 27% said political extremism, 26% reported immigration, 23% said government or business corruption, and 18% said healthcare.
Crime as an Important Local Issue in Specific Places
At the local level, residents seemed attuned to what’s been happening on the ground where they live. Consider two community types, the African American South and Big Cities. In the rural African American South, 35% of residents considered crime or gun violence a top-three issue of concern facing their local community. (Crime/gun violence came in second behind inflation for the most concerning issue community-wide.) In Big Cities, 23% of residents said crime or gun violence was a top-three issue of concern in their local community. (In these places, the issue came in third behind inflation and homelessness/housing insecurity.)
Local concerns about crime were higher than national concerns in just three community types: the African American South, Big Cities, and Military Posts, as shown in the chart below.
In tracking the heinous crime of mass shootings, defined as four or more people shot or killed, not including the shooter, there were 381 shootings in 2025 through December 1, according to the Gun Violence Archive. Diverse Big Cities, home to more than 81 million people or 25% of the national population, and African American South communities, home to 13.1 million or 4% of the population, were hardest hit.
The American Communities Project’s analysis of the Gun Violence Archive data showed that African American South communities accounted for 16% of the nationwide number. In prominent African American South counties, eight mass shootings were recorded in Shelby County, Tennessee, containing Memphis; four in Orleans Parish, Louisiana, containing New Orleans; and three in Mobile County, Alabama.
Big Cities accounted for 45% of the nation’s mass shootings through December 1. Some Big City counties stood out. Eight mass shootings were recorded in Philadelphia County, Pennsylvania; 12 in Los Angeles County, California; and 24 in Cook County, Illinois, containing Chicago. These numbers were down from 2023. Notably, major cities, including these, have reported decreases in violent crime.
Change in Public Attitudes and Raw Numbers Since 2023
Since the ACP/Ipsos survey series began in the summer of 2023, crime/gun violence has dropped as a national concern. In 2023, 30% of respondents rated it as a top concern. According to the Gun Violence Archive, in 2023, there were 36,562 willful, malicious, or accidental injuries from gun violence nationwide, and 19,135 deaths considered willful, malicious, or accidental. That year, mass shootings nationwide hit 659, according to the GVA.
In 2024, 22% of ACP/Ipsos respondents ranked crime/gun violence as a top concern. On a nationwide level that year, there were 31,646 willful, malicious, or accidental injuries from gun violence, and 16,725 deaths considered willful, malicious, or accidental, according to the Gun Violence Archive. There were 503 mass shootings.
Declining Local Concern
Crime/gun violence has also dropped as a top local concern among residents across communities these past few years. The African American South was the exception.
In 2023, crime/gun violence was the No. 2 most important issue facing in different rural, urban, and suburban communities: the African American South, Big Cities, Urban Suburbs, and Middle Suburbs.
Big Cities accounted for 40% of mass shootings, Urban Suburbs accounted for 15%, the African American South accounted for 15%, College Towns accounted for 8%, and all other suburban and rural types were below those percentages, based on the ACP’s analysis in November 2023.
In 2024, residents’ attitudes about crime at the community level looked markedly better. Notably, in mid-2022, the Bipartisan Safer Communities Act was implemented, considered the most substantial gun violence prevention law in nearly 30 years.
In 2024, crime/gun violence remained the No. 2 most important local issue in the African American South.
In Big Cities, it was the No. 3 most important issue.
All other community types placed crime/gun violence as less of a local issue of importance.
by Ari Pinkus, Cece Fadopé, Theo Scheer, Sarah Murphy, Allison Brennan, Alex Bass, and Jenna ModicaNovember 24, 2025
This year has been searing for U.S. colleges and universities — from grappling with federal funding cuts to rancor over diversity programs to the ultimate value of college amid an affordability crisis and the rise of AI.
Still, most people said a college degree is somewhat or very important for a good life, according to the American Communities Project/Ipsos American Fragmentation survey of some 5,000 Americans conducted in August 2025. There is some variance at the community level, with a high mark of 87% in the diverse and densely populated Big Cities, full of white-collar professionals.
In the very rural communities, residents see the value differently: 53% in Native American Lands and 31% in Aging Farmlands said, “Earning a bachelor’s degree is important to a person’s ability to have a good life.”
On other issues affecting colleges and universities, there is more of a split, according to the ACP/Ipsos survey. For the 90% of Americans familiar with generative AI platforms, such as ChatGPT, Claude, Copilot, and Gemini, 47% said they use these at least every two weeks. Less hope surfaces when considering AI’s potential future impacts on daily life, livelihoods, and children. Meanwhile, diversity programs are not widely popular. Just 40% said, “The U.S. should do more to level the playing field for historically underrepresented groups.” In Big Cities, 56% said so; it’s the only community type above 50%. (Explore views on AI and other major issues from the ACP’s latest survey.)
To understand what’s behind the numbers, the ACP enlisted writers from coast to coast to interview fans at college football tailgates about the value of college, their views on diversity programs, their thoughts about the Trump administration’s involvement in higher education operations, and their biggest hopes and fears for artificial intelligence. These interviews deepened the ACP’s survey results. Attendees detailed college’s holistic worth and high cost but divided over diversity programs as well as President Trump’s intervention. They shared excitement over AI’s efficiency, empowering quality, and scientific advances alongside worries about privacy, trust, job loss, and critical-thinking atrophy.
In such unsettlement, the tailgates consistently played out with a sense of joy in community. “Sports” as “a place of social connection, community, and entertainment” was also highlighted in a recent survey of some 3,100 adults, sponsored by the Robert Wood Johnson Foundation. (Click on the anchor links below for ACP vignettes at college football tailgates this fall.)
Villanova University in Delaware and Montgomery counties, PA (Urban Suburbs)
On Villanova University’s campus straddling Delaware and Montgomery counties in Pennsylvania, families tailgate under a sea of aligned tents measuring 10′ x 10′.
Villanova University welcomes families to campus for its first Tailgate on the Green of the fall football season. Section photos by Ari Pinkus.
By Ari Pinkus
An array of food under a family’s tailgate tent at Villanova University before the big game against William & Mary on September 27.
Villanova University’s first Tailgate on the Green this season — aka Family Weekend — was a bright bubble of blue and white all over, students and their families packed under a couple hundred 10’x10’ neatly aligned tents brimming with sandwiches, tomato pies, and baked goods. This field of school spirit saw children playing cornhole on the grass, longtime friends reuniting, student band members drumming, and even the cops on patrol engaging. These multigenerational, mostly white fans were gearing up to cheer on Villanova’s Wildcats against William & Mary’s Tribe. On this football Saturday, September 27, the foliage was falling, welcoming fall to the 260-acre campus along the historic Main Line, just 12 miles from Philadelphia.
The tailgate on Mendel Field; nearby landmark statue of Gregor Johann Mendel, the father of genetics and Abbot of the Augustinian Monastery; and plaque of Mendel Medal recipients recognizing “scientific accomplishment and religious conviction” all convey the vitality of science and religion on campus and beyond. Founded in 1842 by the Order of Saint Augustine, Villanova University sees its Augustinian roots continuing to branch out. The recently installed Pope Leo XIV graduated from Villanova with a degree in mathematics in 1977. He became a friar in the Order of Saint Augustine later that year. That Pope Leo is an alumnus elicits deep pride here.
A cutout of Pope Leo XIV stands outside a tailgate tent at Villanova University during Family Weekend before the football game against William & Mary on September 27.
A poster of Pope Leo XIV hangs on one of the campus buildings at Villanova University in Villanova, Pennsylvania.
According to Main Liners who grew up in the 1970s, Villanova was known for being full of suitcase commuters and supporting pluralism. Its current physical plant and $1.4 billion endowment tell a story of investment and growth. It’s leveraged its business program and law school and developed its men’s basketball team to blue-blood status. The Wildcats have won three NCAA championships, most recently in 2018.
At Tailgate on the Green, Villanova students’ parents and grandparents radiated pride and credited their college educations with enhancing their knowledge, opportunity, and agency, even as they shared concerns about changes roiling the field.
Families tailgate under a tent on campus before Villanova University’s Wildcats play William & Mary’s Tribe on September 27.
Value of College in Life
Nancy Earley attended the tailgate with her husband, Frank, to support their daughter, a freshman here. Coming from Westchester County, New York, Nancy expressed surprise over how beautiful and well-organized the setting was. College, she said, means so much to her because of her parents’ struggles. “I always grew up knowing I would want to go to college, so I don’t really know an alternative path, but I’m first generation,” she said. “So, my parents had it instilled from very early on that I was going, because I think they lived the other side of trying to grow without having an education, trying to start at the bottom, really, no paperwork to that door. So, it was really them motivating me to go.”
For Frank, the social ties he forged in college remain strong. “I talk to my friends from college every day. I played football so that was a bond. We do business together.” Both were quick to say they use their college educations every day, Nancy as an elementary school teacher who graduated from Marist University, and Frank as a lawyer who earned his bachelor’s from the University of Rochester.
Sachin Shah, who graduated from Villanova’s combined BS/MD program in 1995, has a very different background. Born in India, he immigrated to the U.S. as an infant, growing up primarily in New Jersey. For Dr. Shah, college expanded his interests and understanding. “When getting an advanced degree, like an MD, of course I had to go to college. I had to get all the prerequisites done and get the bachelor’s degree. It was a fun time, not only with the science classes I took, but I was able to take other philosophy, religion, liberal arts classes that I enjoyed tremendously. … I did an MBA as well, so it was sort of different than my medical training, but that also was very enjoyable. See a different part of life, different field in the world.” Socially, he had a blast, he said. “I think probably medical school and ultimately residency is where I formed my closest friends, just because it’s such a common life, common goals, common interests.”
Residency is where Shah met his wife. The couple drove about two hours from their Connecticut home to tailgate with their son and a bunch of friends. “In terms of tailgating, it’s my first time back since I graduated because my son is now a freshman here.”
Sitting on a bench next to the field was David Hornyak, a 76-year-old retired businessman who flew in from Pittsburgh to tailgate with his granddaughter, a student here. “This is the first tailgate party that I’ve seen,” he said.
College has enriched Hornyak’s life, but he questions the value of a liberal arts focus. He majored in accounting and graduated from Duquesne University in 1971. “Never spent one day in accounting. I had my own business after that. So, I guess it helped me out, in retrospect, but really not in the field that I started out.”
Hornyak relishes the lifelong friends he made in college. “I just got off the phone with one. Duquesne is a relatively small college, and we still get together occasionally.”
The U.S. President in Higher Ed Institutions
President Trump’s involvement in the operations of colleges and universities drew a mix of views. Nancy Earley said, “I think it has no place in universities,” adding that she doesn’t want “any type of government oversight in what you’re teaching. Curriculum should be set based on history and values in common, not dictated by one person or group.”
Her husband, Frank, underscored the point. “It’s the opposite of the Republican Party, small government, independence, right?”
Shah conveyed a layered perspective. “I don’t agree with all of what [President Trump’s] pushing. Trying to dictate what [Harvard] teaches, what they don’t teach, I don’t think that’s appropriate, certainly. But I think there absolutely needed to be a reckoning. … Depending on the school, you’re talking single digits of the quote, unquote conservative or right-leaning viewpoint. I think that’s a big detriment,” he said.
Diversity Programs
On another hot-button topic, diversity programs at colleges, Shah opened up: “I struggle with them. I absolutely understand the benefits of a diverse viewpoint, but I think to have quotas, to say you’re picking one group or one student over another just because of their background, or just because you think they’re underprivileged or underrepresented, I have a big problem with that. I believe in meritocracy, and unfortunately, more and more in the medical field, I’m not seeing the quality that I used to, and I admit that it might be just bias, an age bias, you know, it’s much tougher when I did it. But I do think in the medical field, it’s going to catch up to us in a negative way.”
In Shah’s mind, diversity programs can cut against their intent. “It’s unfair for the minority group, because then I think the first thing people think of is, oh, the only reason you’re in that position is because of X or Y, not because you deserved it, not because you achieved your goals, and were an excellent candidate.”
Frank Earley is OK with the idea of these programs in general, but he admits they haven’t affected him or changed his workplace. “Diversity programs are important as long as they’re done right. I have good friends who are diversity officers at huge corporations and professional athletic leagues, and they’re important… You have to give people a chance.”
Hopes and Fears Around AI
What will artificial intelligence bring to education, workplaces, and society as the future unfolds? For his part, Frank Earley is most excited about AI’s efficiency. “It’s amazing; it’s instantaneous. I use it every day. I don’t always know it’s right, but I know it’s in a range. And it’s a great starting point. … I do research, and I give it to the young lawyers to make sure I was right.”
But concerns quickly surface, too. “The biggest fear for us is how you keep learning the right way. So as a lawyer, writing is 90% of what you do, and now you don’t have to do it. It does it for you,” he said. “How do you actually get the baseline training to where you can be that next level? That’s something we talk about.”
Longer-term, Frank wonders how AI will affect his children’s futures. Their daughter aspires to be a doctor while their son is studying physics engineering. “Am I worried about it taking over the world? I’m not smart enough to know that answer, but I do have concerns about what’s going to happen with young people getting jobs,” Frank said. “And are you going to need those entry-level people anymore?”
His wife, Nancy, said her elementary students are using AI now. “They’re young, so we’re teaching them that you have to vet anything that comes by you. Where does it come from? Who cultivated it? Where are they pulling from? But everybody has to get better, or [AI] has no value.”
For Shah, AI is a boon — and soon a necessity. “I’m more hopeful than fearful. I see how it helps our field already, and I think the people that embrace it and understand how to use it are the ones that are going to be employed and whatnot.”
Shah noted that while it won’t be a smooth adoption, AI will bring mass progress. “I think, unfortunately, there’s definitely going to be upheaval and disruption, but at the end of it, I think it’s going to be tremendous in terms of new medical discoveries, new engineering, biotech, economic policy.”
Efficiency is top of mind for Shah, too. “I think it’ll save a lot of time and really help us achieve our goals much faster than maybe right now.” He uses AI peripherally in his work now — and looks forward to its advances.
Meanwhile, David Hornyak doesn’t see AI affecting his life. “Well, that’s probably a question to ask [my children and grandchildren]. It’s probably scary in some ways and very helpful. Probably in the field of medicine, it’s going to be a big help, but we’ll see.”
Families congregate under tents at Villanova University’s Tailgate on the Green event on campus in suburban Philadelphia.
Villanova University fans celebrate fall football season.
Howard University in Washington, DC (Big City)
Howard University celebrates its 101st homecoming on campus in Washington, DC. Section photos by Cece Fadopé.
The marching band at Howard University’s Yardfest before the homecoming game in Washington, DC.
By Cece Fadopé
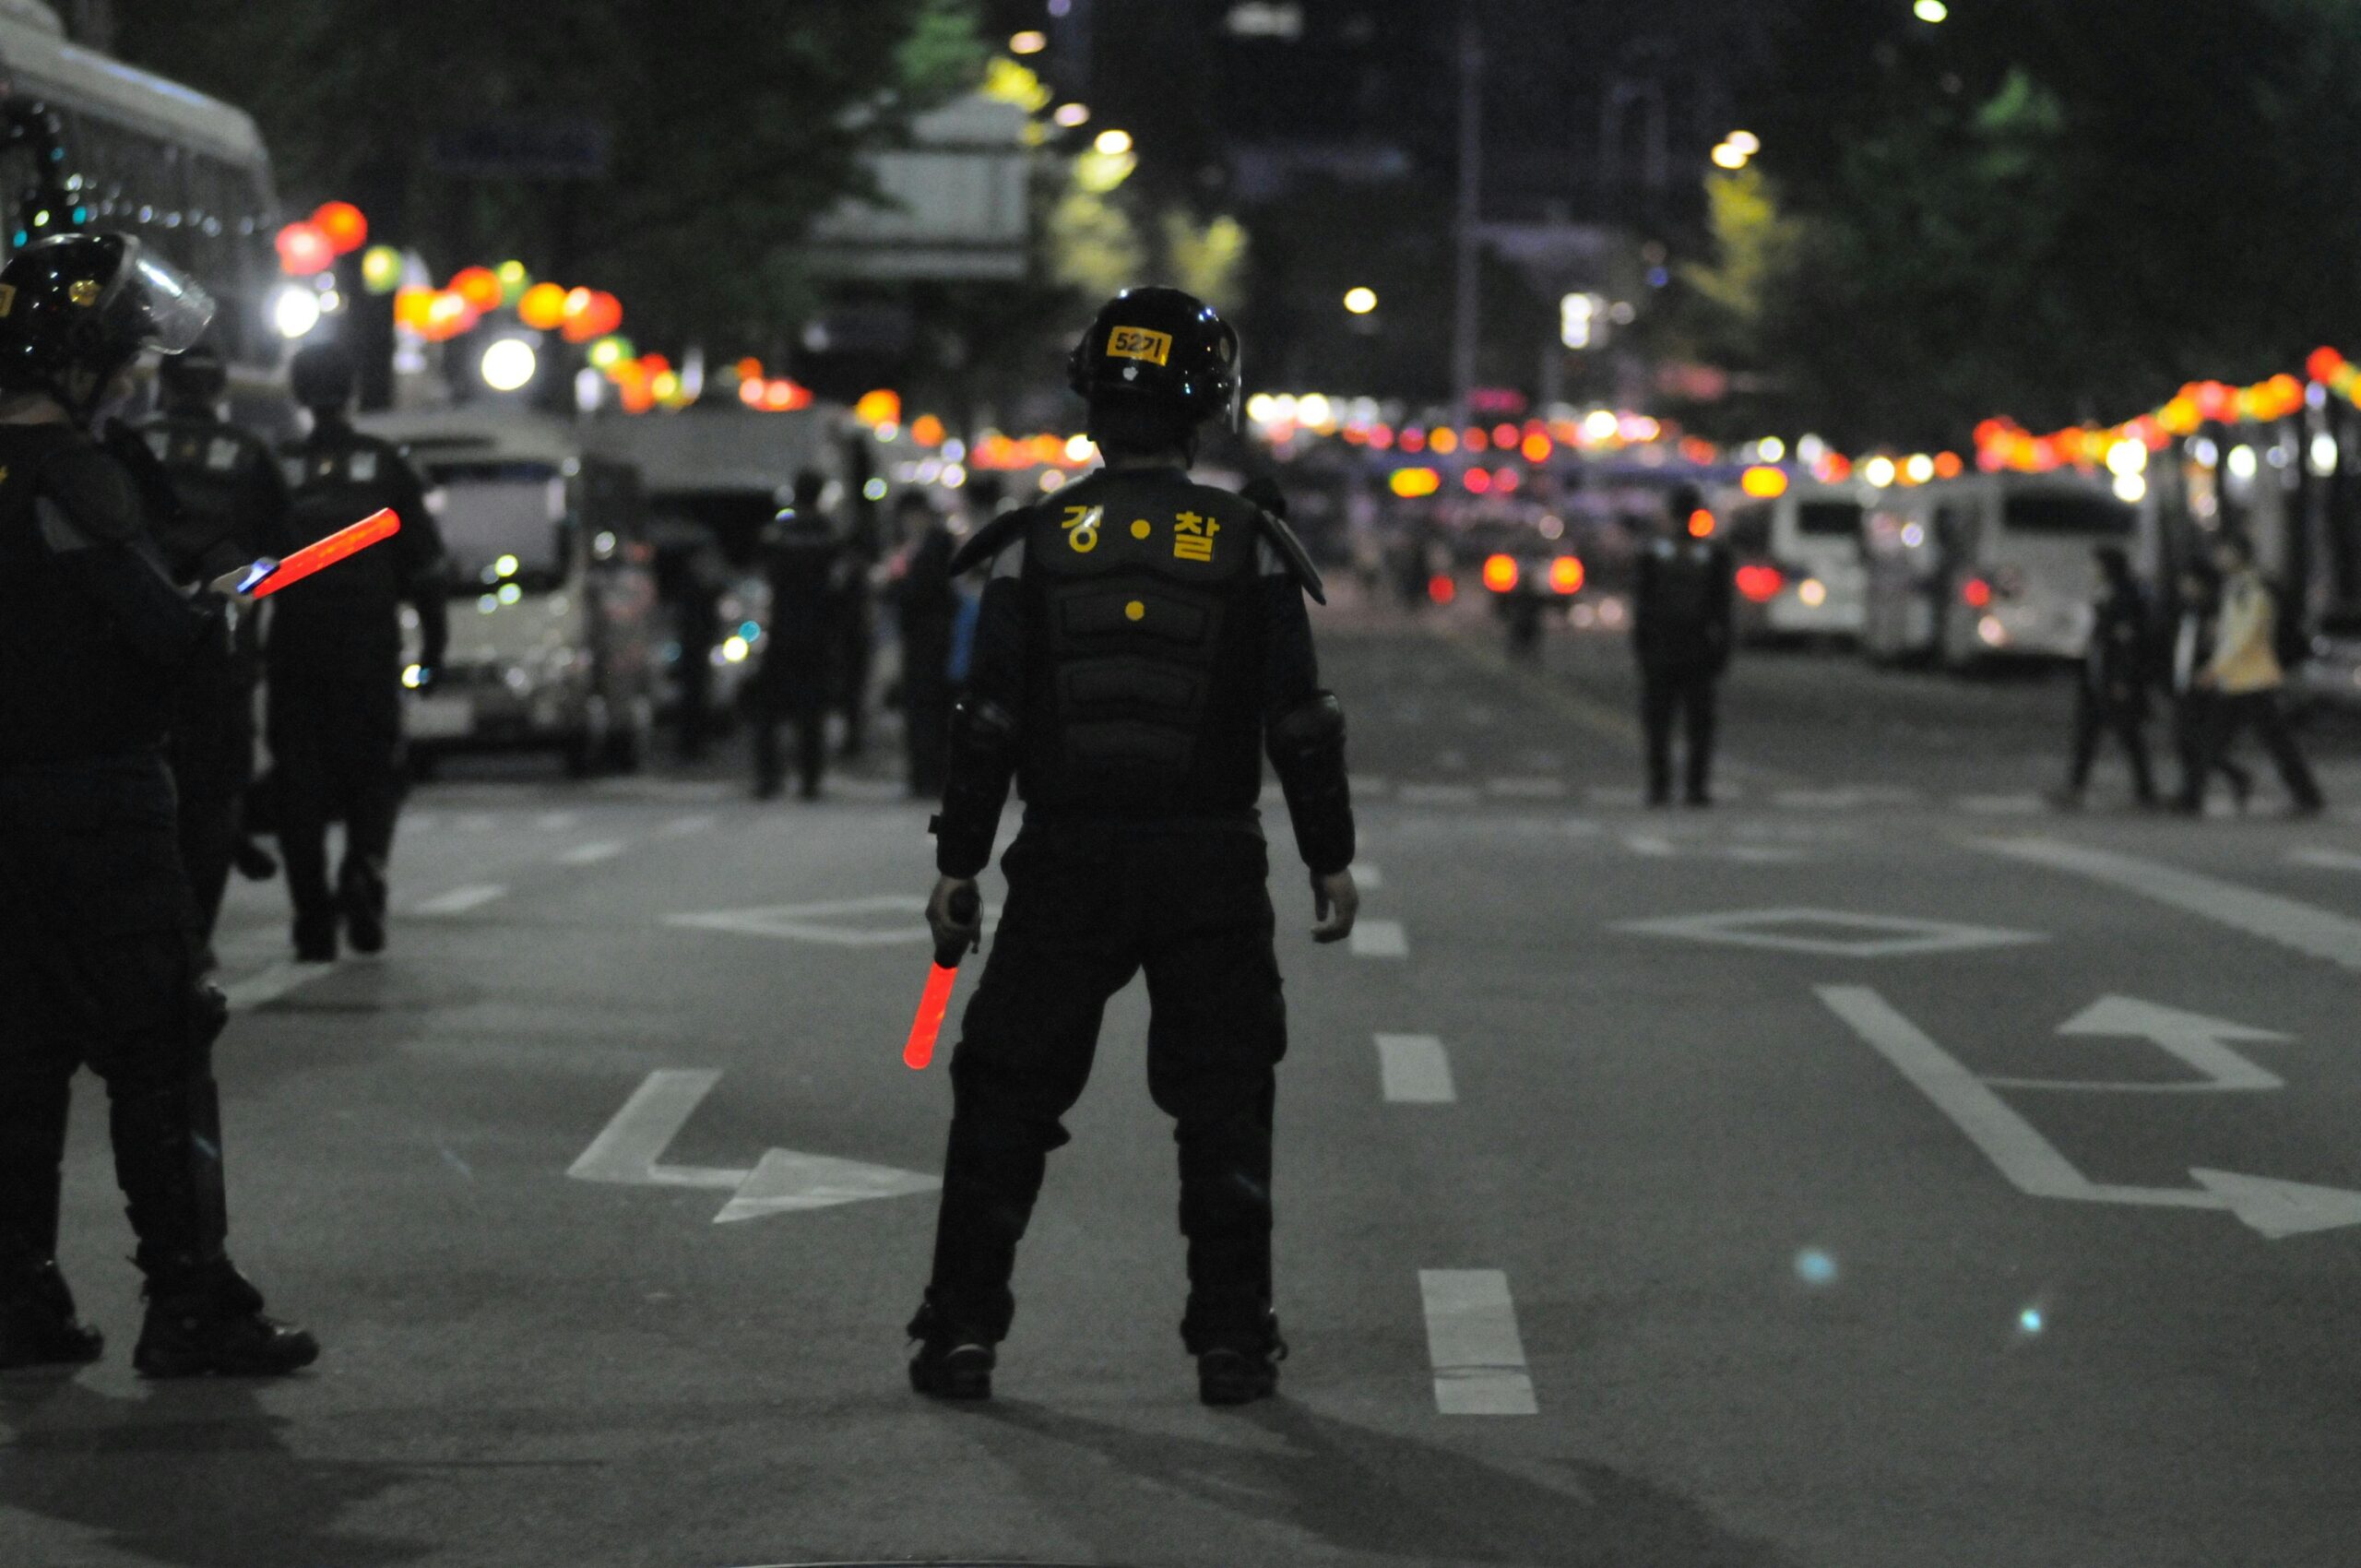
The football game between Howard University and Morgan State University — two well-respected HBCUs — attracted alumni, parents, and friends from near and far on October 25. Ultimately, it was a day for Howard University to shine as fans celebrated its 101st homecoming event, known as “Yardfest” or “Family & Fun Day.” On the way to campus, police and security officers were on every block. Neighbors lined the street, checking out vendors selling their wares — food, jewelry, cultural clothing, and artifacts, effectively closing Georgia Avenue NW, the main road artery of the Shaw Howard University community in Washington, DC.
Cheerleaders at Howard University’s homecoming celebration, Yardfest.
Fans enjoying time with friends at Yardfest.
Never mind the chilly air; many revelers pranced around in revealing costumes. Loud cheers resounded through the Yard — the Marching Band was strutting away after playing, followed by a parade of Greek-letter groups and more cheers from the homecoming cheerleaders. But YB Norris stood away from the festivities, in a corner by the Armour J. Blackburn Student Center building, preoccupied with his phone. He doesn’t tailgate but enjoys watching football.
YB (née Justin) Norris, 24, is an artist from Philadelphia. He came to the Yardfest and game with friends. YB is the moniker for his clothing line and art. He followed the entrepreneur’s path because he could not afford college. He grew up in a single-parent household with his mom, and his parents were unable to help him. Of course, college is valuable, he said. “You learn life skills, social and communication skills too, that I’ve had to learn the hard way, through life, just going through it.” He met good people through “Spark Sessions and community gatherings while playing music,” he said. Norris received marketing training and other skills support from the DELCO Youth Organization in Delaware County in Pennsylvania.
Norris believes diversity, equity, and inclusion (DEI) is necessary until “there’s a level playing field.” According to him, it is “uncanny how DEI is presented and how the policies work. Look, formerly enslaved Black people built much of this country, a large portion of it.” He continued, “We run our own programs and businesses, we created our own culture, music, fashion, sports, but then people are put in [identity] boxes; it’s just uncanny.”
Asked whether he’s troubled by the spread of artificial intelligence, Norris said he’s become used to it as a gamer and “leverages it as a blueprint for his art and fashion business.” He started learning about AI from video game systems. For him, the only drawback to AI is that “it can warp reality, and we must not let it take our creativity away.”
Fans at Howard University’s Yardfest before the football game against rival HBCU Morgan State University.
Vendors at Howard University’s Yardfest in Washington, DC.
Meanwhile, Muriel Hatcher, 69, was walking briskly toward where the DJ was playing a favorite tune the revelers sang along to. She also does not tailgate. A Howard alumna from the class of 1978, she attended because homecoming is a special event. Originally from New York City, she resides in Dallas, Texas, where she works as an auditor.
Hatcher has always been happy with her choice of college and subsequent career opportunities. Attending an HBCU, especially Howard University that was founded in 1867 with the motto Veritas et Utilitas, Truth and Service, taught her how to master white America. “It is my responsibility to stay on top of my mindset and attitude about life,” said Hatcher.
In her view, diversity programs are needed but would not be necessary with better policies and practices. “Open clear admissions policy that provides opportunity for everyone” would do more for diverse advancement than any DEI programs. “We won’t need diversity programs if we help our people and open doors for our young people,” said Hatcher.
Hatcher answered a question about the Trump administration’s interference in academia with a question: “What’s the point of being alarmed by what the President is doing or attacking him? You already know he’ll come back to you double, and he has the power.”
Hatcher expressed her ideas about moving forward. “What we need now is strategy and a plan, and in my opinion, that is to vote.” In this regard, African Americans need to be more effective. “Our poor turnout in the last election gave the results we have now. People need to understand the importance of the vote and to be effective about voting at all levels of government.”
Hatcher holds a deep respect for culture as well as for country and disapproves of how “AI is creating mistrust among people. Our people must take it seriously, learn about it, and monitor it carefully, so that means our community must keep up and keep moving at the pace of change,” she said.
In perhaps another sign of the times, a few people approached at the tailgate were wary of sharing their views about these hot-topic concerns.
Gearing up for the football game between Howard University and Morgan State University at Howard University in Washington, DC, on October 25.
Michigan State University in Ingham County, MI (College Town)
The line to MSU’s Spartan Stadium before the homecoming game with the UCLA Bruins on October 11 in East Lansing, Michigan. Section photos by Theo Scheer.
By Theo Scheer
It was a lively scene in East Lansing, Michigan, on October 11, as hundreds gathered on Michigan State University’s campus for the Spartans’ homecoming football game against the UCLA Bruins.
Chants of “go green” and “go white” erupted from tailgaters at random, reverberating through the brisk morning air. A man in a green morph suit weaved through the line to the Spartan Stadium on a bicycle fitted with a massive MSU flag, high-fiving fans.
Tailgaters lined up along a sidewalk near the Spartan Stadium in East Lansing, Michigan.
A group drums on green buckets outside the Spartan Stadium.
Many tailgaters came to East Lansing from across the state, and for some — judging by the rare flash of UCLA blue and gold — across the country. Though their backgrounds and political persuasions varied widely, tailgaters were more eager to talk about what brought them together: friendship, their education, and, of course, football.
Merrill Shelter, 50, outside the Spartan Stadium said he was “born into” tailgating and now tailgates with his teenage son.
Merrill Shelter, a carpenter from Lansing, said he was “born into” tailgating. He was raised in Fenton, a small town in Genesee County, a Middle Suburb. His parents started taking him to games when he was five years old. Now, at 50, his teenage son tailgates with him.
Shelter dropped out of MSU in 1994, after his mother told him to pick a major or she’d stop paying for his education. He regrets not enrolling in MSU’s renowned turfgrass program, which he said would have helped him during a stint working in golf course management.
Having been raised to value diversity, Shelter supports college diversity programs and called Trump — who has sought to get rid of them — a “b****.” He doesn’t feel represented by politicians in general, viewing them as power-hungry and “corrupt.”
Others were not so forthcoming about their political views. As old friends and dormmates reunited in the left-leaning college town that morning, for some, politics seemed to be a prickly subject. In fact, many declined an interview as soon as it became clear they’d be asked about current events.
“I’m not going there,” said John Armstrong, a 64-year-old who works in sales, when asked his views on President Trump’s interference in higher education.
Armstrong, who described himself as fiscally conservative and somewhat socially liberal, was tailgating with his fraternity brother, John McKay, a 66-year-old retired sales team manager and self-described libertarian. They’ve been tailgating in East Lansing since the late ’70s, and went to MSU together in the ’80s, where they made lifelong friendships.
Going to college “changed my life,” McKay said. It “tied everything together, gave me a purpose.”
Though they wouldn’t talk about Trump, both agreed that the government should stay out of their lives, and that American presidents generally “have no business” in university operations.
Government involvement is not an abstract issue at Michigan State as MSU’s president made clear in a financial update to the university community on October 22 via email: “As of Oct. 1, 74 federally funded projects at MSU were terminated by the federal government, with a multiyear impact estimated at $104 million. Most were funded by the National Science Foundation, the U.S. Agency for International Development, the National Endowment for the Humanities, the National Institutes of Health and the U.S. Department of Agriculture” and noted “83 positions across the university were lost due to federal funding cuts.”
Two Friends on Higher Ed Issues and AI
Desmond Miller, 32, outside the Spartan Stadium came to tailgate with an MSU friend, who now works for the university’s College of Communications Arts and Sciences.
Down the street from Armstrong and McKay was Desmond Miller, the policy director for the Michigan Senate Democrats.
The 32-year-old graduated from MSU in 2015 and lives in Flint, which is in Genesee County. He believes college diversity programs are places “where you learn to have respect for people’s differences.” Miller said he doesn’t like Trump’s approach to higher education, saying he appreciates when presidents give colleges more funding and federal support.
Miller was tailgating with Matthew Jones, a friend from MSU who now works for MSU’s College of Communications Arts and Sciences as its associate director of development. Jones is 35 and lives in Williamsburg, which is in the Rural Middle America county of Grand Traverse.
Asked about his hopes and fears around artificial intelligence, Jones said he appreciates its efficiency, but there “needs to be a human element involved” to ensure its accuracy. Miller agreed, saying humans need to catch up to the rapidly advancing technology.
The Michigan State Spartans play the UCLA Bruins on October 11.
The University of New Mexico in Bernalillo (Big City), Los Alamos (Exurb), McKinley (Native American Land), Taos (Hispanic Center), and Valencia counties, NM (Hispanic Center)
White tents near Louie Lane host alumni meet-ups at The University of New Mexico in Bernalillo County. Section photos by Sarah Murphy.
By Sarah Murphy
Author’s note:I did not include specific titles, company names, and last names for Dominic and Orlando, as they’re federal workers, and I wanted to protect their privacy.
Sign near Lobo Club tailgating tent welcomes alumni for homecoming weekend.
Students, alumni, and fans of all ages and backgrounds set up tents in the lots near Louie Lane, The University of New Mexico’s new tailgating hub in Bernalillo County, tuning their radios to the pregame show ahead of the night’s centennial homecoming game. In a state with no major league sports teams, UNM tailgates draw fans from across New Mexico, so it wasn’t surprising that the tailgaters I spoke with weren’t UNM alumni but had still shown up in red shirts to cheer on the Lobos.
Jack McFarland and his wife, Karen, are longtime Gallup, New Mexico, residents and frequent tailgaters who were joined by two friends. The group nominated Jack to speak about education, given his background as a former principal and current school district leader. Jack earned his degrees in marketing and education from both state and private universities in New Mexico. While his education was essential for his career, “I think there are different ways to go about being successful,” Jack said, mentioning how pathway programs prepare students in his district with technical, career-ready skills alongside standard academic courses.
The McFarlands also saw how diversity programs can address socioeconomic opportunity gaps. Working in a school district where the majority of students come from communities that are historically underrepresented in higher education, Jack indicated that diversity programs aren’t an abstract debate so much as giving every student an opportunity to succeed. “I think everybody deserves a chance,” Jack said, as Karen nodded in agreement.
Lobo Club tailgating tent with crowds of alumni and UNM flags.
Across the parking lot, Vince, Marcie, Orlando, and Dominic — all members of the Navajo Nation — were enjoying one of their first UNM tailgates. Dominic, 40, and Orlando both earned degrees in Arizona and now work in healthcare near Crownpoint, New Mexico. Dominic and Orlando’s degrees were essential to their jobs, and career advancement will require more. But Dominic, hesitant to begin a new program himself, tells kids to “get in and get out” of college quickly — a caution against taking scholarships for granted amid uncertain federal policies.
Still, the group touted the value of education. Dominic sees college as a chance for students to “build career leverage” and “an understanding of what [they] can offer” to a job. He noted the value of access to university health insurance, which many in communities near Crownpoint don’t have. Marcie and Orlando also spoke of the value of diversity programs in making students “feel comfortable,” especially if they’re new to a community, though Marcie pointed out that these programs may be seen differently depending on where you live.
Coincidentally, both groups of tailgaters hailed from McKinley County, New Mexico, a Native American Land county in the American Communities Project. They had similar perspectives on the federal government’s involvement in higher education, reflecting on long-standing challenges tied to their local communities. Jack and Orlando each mentioned that schools in northwest New Mexico rely on Filipino teachers with J-1 visas to fill critical teaching gaps. Jack sees present-day challenges facing teachers, including shortages, as lingering effects of policies like No Child Left Behind. In both conversations, there seemed to be a sense of worry about how new federal policies might impact local classrooms, where students need steady teachers and reliable scholarships now to prepare for college.
Fans await entry to University Stadium North Entrance near Louie Lane.
Families enjoy games and food vendors in tailgating hub Louie Lane.
Sentiments around AI were ambivalent. “It scares me not knowing what it’s capable of,” Karen admitted, and others shared her concerns about how AI is evolving faster than our understanding. Dominic and Marcie expressed apprehension about AI’s trustworthiness and potential privacy risks. Despite hesitations, both groups agreed that AI is becoming a critical tool for the U.S. and for students to learn and use responsibly. “We need to use it before we lose it,” Dominic said, referring to the need for the U.S. to keep pace with AI advances and remain globally competitive. His comment echoed Jack’s view that AI is becoming an essential skill for the future: “If you don’t know AI, you won’t be successful.”
View of University Stadium ticketing booth outside Louie Lane.
Outside University Stadium North Entrance.
Montana State University in Gallatin County, MT (College Town)
Montana State University in Bozeman, Montana. Photo by Dante Chinni.
By Allison Brennan
November 8th was an abnormally warm fall day in Bozeman, Montana — sunny, brisk, no snow in sight — as the Montana State Bobcat football team prepared to play the Weber State Wildcats. Outside the stadium, people of all backgrounds journeying from across Montana convened to drink beer, play cornhole, and catch up with family and friends. I was there to talk with Montanans and transplants alike about some not-so-celebratory issues: the value and state of higher education in America and the prospects of AI on the horizon.
Change, a constant theme in the West, has borne down on Bozeman in Gallatin County, where the Paramount show “Yellowstone” partly takes place and the pandemic exodus from major cities brought in many newcomers. In more rural parts of the state, this area is pejoratively known as “Boze-angeles” for seeming unlike the “real Montana.” Politically, it deviates from most of the state. Gallatin County, the home of Montana State University, voted for Democrat Kamala Harris by 4 points in 2024. President Trump won the state by 20 points.
Bozeman’s sheer growth has rocked the locals. In the past five years alone, Bozeman’s population jumped 19% to almost 60,000. A cornerstone of the community, Montana State is also a beneficiary of its growth. Like the rest of the Treasure State, the university is not as diverse as other schools of its size in the U.S. — its undergraduate population is 83% white.
Still, I met tailgaters of diverse backgrounds, most of whom said that whatever diversity the university can bring in counts as a positive for rural residents here; who said college has value but is too expensive; and who expressed mixed views about the prospects and the threats of artificial intelligence, often in the same breath.
Tailgating at Montana State in Bozeman, Montana, before the Montana State Bobcats played the Weber State Wildcats on November 8. Photo by Allison Brennan.
Assessing College’s Worth
Sherrie Kitto, a 50-year-old mortgage lender, was tailgating with her husband. A mother of five, she said the value of college varied with her kids. Some went to college; some didn’t. She affirmed college’s importance, particularly for the generation of children in middle and high school during the pandemic’s isolation. “I think the value of college is learning to work together, to meet peers, to work as teams, to fine-tune your writing skills and your listening skills and your speaking skills,” she said, adding that the credential itself matters less than the experience. “I don’t know if my degree has helped me get where I am, but I’m proud that I went, and I do think I have a leg up on a lot of people who didn’t.”
Joan Fuller, 59, a health-system imaging director originally from Ohio, brought up the cost of higher education. “College is too ***damn expensive,” she said. “Kids can’t go to school. It’s bull****.” Fuller had paid $96,000 in student loans for her son: “How does a kid pay that on his own? You’re never out of debt.” She contrasted that with her own college era: “One quarter was $400; $1,200 for a year. You could work part-time and pay for college.”
But Fuller still believes college matters. One of her sons thrived in college; one didn’t go and works in a steel mill earning stable wages.
Sipping martinis and canned wine with Fuller was Jenny Runkle, 60, a nurse practitioner originally from Summit County, Colorado. Her path was nonlinear: “I barely graduated high school and immediately became a ski bum,” she said. “At 40, I decided to go to nursing school. At 50, I got my NP degree online.” She said today she owes “$100,000 that I haven’t had to pay yet.” Yet she doesn’t regret going: “Look what I get to do — I get to ease people’s suffering.”
Football fans mingling at a tailgate at Montana State University in Bozeman, Montana, on November 8. Photo by Allison Brennan.
Affordability concerns crossed generations.
Tyler Vaughn, 22, a diesel mechanic from California’s Central Valley, said, “College is a great opportunity for anyone who wants a field that requires it.” However, he wishes he had had the companionship that some of his friends gained from going to college, he added.
But Sam Johnson, a twentysomething blue-collar worker from Butte, Montana, said he feels optimistic about his future in the trades. “The next generation of millionaires will be electricians, plumbers, and anybody working blue-collar jobs.”
Christy Hauk, a 52-year-old mental-health therapist from New Jersey, said college has enormous value and pointed to its lasting imprint on her life. “I went to West Virginia [University] in 1992 not knowing a soul,” she said. “But it was the best four years of my life. My college girls and I are still extremely close.” Hauk grew up in a racially diverse environment, and when she moved to Montana, the stark contrast hit her. “Where I grew up, there was so much diversity. When I moved to Montana, I was like, ‘Where is everybody?’”
On Diversity, Equity, and Inclusion (DEI) programs
Most attendees interviewed said they favor DEI in university programs, including admissions.
Evan McBride, a 36-year-old college graduate now employed at a compost company, shared a ringing endorsement of the policy, particularly in Montana. “Learning about people who are different from yourself and who come from different backgrounds and different cultures — those are, like, some of the great pleasures in life. Just gaining new knowledge. I mean, I grew up in Montana. We’re a little sheltered here, so we didn’t and we don’t get a lot of diversity. So, when I get the opportunity to meet someone from a different background, and they grew up in a different lifestyle, I like to take advantage of that.” McBride, a native of Helena, went on, “I don’t want to just hang out with people that are exactly like me. That would get boring….”
Cash Kelly, 25, a finance professional from Butte, echoed this sentiment. “I’m a fan of DEI. [Diverse students] didn’t have a leg up in the past, and now to punish them again… it’s a problem.”
But Douglas Johnson, a 53-year-old San Diego native and former Marine who now lives in Montana, had a different and blunt take: “It’s garbage. Don’t ever do it. Equal is equal.”
Getting Candid on AI
One common theme emerged in attendees’ nuanced perspectives of AI: Nobody feels fully in control of what’s next.
“I think, like, workflow stuff — for small businesses, it’s super helpful,” said Kelly, the finance professional. “Just seeing it firsthand, it’s good for small businesses.” Others agreed, especially when AI makes daily tasks faster or more accessible. “I use it for treatment plans,” said Runkle, the nurse practitioner. “When it helps me, I love it.”
But not everyone was as optimistic.
“These things look so real — AI can steal from everybody,” said Hauk, the mental-health therapist. “There are amazing things AI can do in medicine… but there’s no oversight. It can go south fast.”
Patrick Bauerle, a 51-year-old father of five who works in a Darigold milk processing plant, put it bluntly: “I hope it doesn’t turn out as bad as it seems like it’s probably going to.”
And Johnson, the Marine, worries about AI as a tool for political control. “If artificial intelligence is created by people who influence the country in a positive way, it could be good. If not, it could be very, very bad.”
Brigham Young University in Utah County, UT (LDS Enclave)
Pictured is Y-mountain taken from Brigham Young University campus a few hours before the game. It is a tradition at BYU for freshmen to “hike the Y,” which is surprisingly steep and challenging for only a ~0.5 mile ascent to the “Y”. Section photos by Alex Bass.
By Alex Bass
LaVell Edwards Stadium with the Timpanogos Mountain as a backdrop. Before the game, BYU hosts a series of stations outside the stadium with food, yard games, music, and swag free for any passersby. Most of the tailgating takes place on the right side of the stadium from the photographer’s point of view (not visible from this picture).
On a mid-October weekend, Provo, Utah, was bustling with foot traffic and tangible energy in the air. Arguably the most covered and heated game of the year was about to take place, the Holy War rivalry game: BYU vs. Utah. The start of the game neared as the sun faded, casting warm light on the towering Wasatch mountain front painted with the red, orange, and yellow colors of fall. It created a beautiful backdrop to BYU’s LaVell Edwards Stadium. A sea of blue fans and occasional red streaks flooded the streets pouring into the stadium. The tailgate scene outside provided a look into the minds of Americans coming together for sport who are separated by ideas around equity, education, and direction for the nation’s future.
The non-student fans offered mixed feelings on the value of a degree. Chris, a Salt Lake City resident holding an advanced degree, said his degree was “worth it,” but acknowledged the value of the trades, conceding that college is not for everyone. (Watch the interview on YouTube.)
Rennie, a native Hawaiian drilling engineer, said he is a “firm believer in the trades,” but acknowledged the essential nature of college for certain professions.
Marla, a grandmother visiting from Oregon, values college for goal-setting and lifelong learning, but questions the affordability — especially outside of BYU, a church-subsidized private college founded in 1875 by Brigham Young, the second president of The Church of Jesus Christ Latter-day Saints. The sting of affordability is acute in “graduate programs,” such as medicine and dentistry that some of her grandchildren currently attend.
All three found value in higher education, but the common threads of affordability and the trades suggest skepticism of college value for the cost of a degree.
The most division among interviewees surfaced in discussion around equity and education. Chris felt like diversity, equity, and inclusion (DEI) programs were important for “equal representation” and to ensure minority voices are heard. Marla agreed with the idea of equal opportunity with this reservation: “I have a problem with diversity when it excludes some people… it backfires and does the opposite of what it’s supposed to do.” Rennie fell on the other side of the spectrum, framing the issue as merit-based — “the best person gets in… you just gotta be the best.” He was displeased with DEI overall.
The same tension carried over to the role of government. Chris and Marla agreed that higher education should remain independent. Chris highlighted a need for a “distinction” between academia and government. Marla emphasized the importance of a school having power to choose their own curriculum, especially with religion courses. Rennie disagreed, saying that higher education has leaned “way too hard” to one side justifying external corrective action toward a neutral focus based on the country’s founding principles.
Finally, all interviewees expressed hope for artificial intelligence as a powerful resource yet feared potential and invasive uses. Rennie highlighted a fear of AI having access and being trained on personal data which felt “invasive.” Marla expressed concerns specifically in hindering users’ ability to think. Ultimately, they see its utility yet fear overreach violating privacy and curbing critical thought.
University of California–Los Angeles in Los Angeles County, CA (Big City)
UCLA welcomes fans to its football tailgate on October 4. Section photos by Jenna Modica.
Fans at the UCLA tailgate in Los Angeles.
By Jenna Modica
On a surprisingly chilly 64-degree October day in LA, football fans and families lined the Rose Bowl lot eager to see the UCLA Bruins play the Penn State Nittany Lions. That day, the cost of parking was $44, higher than the normal rate of $36, because Penn State is a premier opponent. The grassy fields were chock full of blue and white tents — blue for UCLA, white for Penn State. In sight, too, were sponsor booths, like Fox, a tequila company, and Insider Accident Lawyers. Following Insider’s Instagram gave fans a chance to win a cute plastic reusable tote bag!
Security guards at the UCLA football tailgate in Los Angeles.
While the crowd waited for the football players to arrive, security lined the blue carpet. Many security guards greeted fans with a handshake, name introduction, and a welcome to the Rose Bowl. Both teams browsed the UCLA merch shop’s many tables. Among the packs of UCLA fans of all ages, ethnicities, and races, Penn State was well represented in a sea of white.
Before the big game at UCLA on October 4, Zakee Wheatley Sr. tailgates to support his son Zakee Wheatley, No. 6 on the Penn State Nittany Lions’ football team.
Mingling almost by themselves, a group wondered aloud, “Where is Penn State? Oh! Pennsylvania? Geez, so it took five hours to get here? I’ve never been to the East Coast.” The sea of white shirts caught my attention, too, and I struck up a conversation with Zakee Wheatley Sr., whose son, Zakee Wheatley, is a senior and a safety on Penn State’s team. Wheatley Sr., who hails from Maryland and now tailgates at every Penn State football game, came here with his wife and some friends. He oozed excitement about his son’s recruitment as he affirmed the importance of going to college. Diversity programs should have a greater presence at colleges and universities, he said, to give more people opportunities to succeed.
Like many colleges this past year, UCLA has been in the crosshairs of the Trump administration. In August, UCLA said the administration suspended more than $500 million in federal grant funding “over allegations of civil rights violations related to antisemitism and affirmative action.” A federal judge has since ordered restoring $500 million in federal funding. As Wheatley Sr. saw it, President Trump “should be focused on bigger things” than the operations of colleges and universities. “Put my name next to that.”
Ron Takasugi’s food table at the UCLA tailgate in Los Angeles.
Later, I met Ron Takasugi, 69, a retired LA resident who’s attending every UCLA home football game this season. He’s been a season ticket holder for the past 36 years. That Saturday, family and friends filled his tent and contributed to a potluck breakfast with a Mexican flair. In a regular ritual, a head chef chooses the food theme for each game, he said.
Takasugi, whose tent was full of UCLA alumni, effusively spoke of how his UCLA experience helped him get started in his accounting career.
Listen as Ron Takasugi describes how a UCLA degree gave him a leg up in the hiring process — more than once.
UCLA sports have helped Takasugi connect in business throughout his career. “I’ve talked to friends of mine who are USC grads, Trojans, and from a business perspective, it’s very easy for me to walk into a room dealing with a UCLA person but also with SC because you have this common rivalry already, and this carries over to the business side, but it’s a friendly rivalry. That’s what UCLA does. It opens doors for you. So many connections.”
Takasugi celebrated UCLA’s vibrant diversity and the way the university continues to welcome students of different backgrounds in the newest class. He doubted whether the Trump administration understands “the lay of the land” when getting involved in the operations of colleges like UCLA. “I got to believe in general, college environments are more liberal than what the current administration likes, and that’s why [Trump] naturally is trying to squelch things. But the education process has been this way for many years, and there are many Republicans and many Democrats that all attend, whether an Ivy League school, any of the private schools here, and … UCLA, Michigan, Virginia, Texas … all the big public schools.”
Fans and security at the UCLA tailgate in Los Angeles.
Fans show off their UCLA Bruins’ pride.
On the issue of artificial intelligence, his views are not fully formed. “My son works for Google. So, I get the AI scoop. I’m sure AI is affecting my life today; I just don’t know it. And I’m not smart enough to know everything that goes on with AI. I drive a Tesla, and there must be AI in that thing because it self-drives.”
What Takasugi knows is AI is good for doing research. “We used to have these rooms with giant libraries; now you pull out your phone or your desktop. Find this case on ChatGPT,” he said.
UCLA tailgate stand in Los Angeles before the UCLA Bruins-Penn State Nittany Lions football matchup.
Ari Pinkus is senior editor/writer/researcher and project manager at the American Communities Project.
Cece Fadopé is a public information specialist in Washington, DC. She was previously a producer for Pacifica Radio WPFW, NPR News, VOA Africa Service, a media manager for Internews, and a fellow of the International Center for Journalists.
Theo Scheer is a freelance reporter at Michigan State University, where he studies journalism, anthropology, and the digital humanities. He was previously a senior reporter for the student newspaper, The State News, and an intern at The Chronicle of Higher Education.
Sarah Murphy is a recent Albuquerque, New Mexico, transplant who enjoys writing about the intersection of people, place, and community.
Allison Brennan is an Emmy-nominated freelance journalist and producer based in Livingston, Montana. Co-founder of 64 and Sunny Studios, Brennan worked for CNN and CBS News for a decade before she went out on her own. She now works with independent journalists and creators on their new endeavors and walks her four dogs along the Yellowstone River in her free time.
Alex Bass is a data scientist and founder of Mormon Metrics, an influential blog that analyzes Mormon demographics and culture. Leveraging his political polling and data background, he consults for corporate and political clients and helps them turn messy data into actionable insights.
Jenna Modica is a production assistant and freelance writer in Los Angeles with experience across indie films and large-scale production.
Editor’s note: The American Communities Project partnered with the Associated Press on the release of the survey. Click to visit the AP’s story on the findings.
Much has changed in the United States in the past year… and much hasn’t.
The new leadership in the White House has not only altered the partisan tilt of Washington but also challenged fundamental norms across the country down to the local level. There have been massive shifts in immigration enforcement and big moves in education funding. Tariffs and political tensions have risen. Tens of thousands of government workers have been let go.
And the American people have noticed the tumult, according to this year’s survey on the fragmentation in society from the American Communities Project. Across the 15 community types that the ACP studies, there are big differences in how people see the direction of the country today compared with 2024.
Yet for all the froth at the top of the American cultural/political scene, there is a more static set of concerns underneath. Worries about rising prices have not abated. Most Americans across the board still see a “rigged” economy. And there is a deep distrust for both political parties and the media.
Those two seemingly contradictory experiences — a country trying to handle dramatic change, while struggling with deeper unmoving problems — are behind many of the results in this year’s survey of 5,400 Americans, conducted by Ipsos and funded by the Robert Wood Johnson Foundation.
If one were to summarize the findings of the 2025 survey, it would be that the divisions in the country are more obvious than ever, particularly around social issues. But the American people, and the many communities they call home, seem united around the idea that the economy is at best uncertain and at worst sliding downhill.
Some Key Takeaways
This year found dramatic shifts in the community types about hope for the future of the country. Most of the community types that voted for Donald Trump saw big jumps in hopefulness, while types that did not vote for him saw smaller declines. Hispanic Centers, which voted for Trump, also saw declines.
People saw big changes at the community level in some places, most for the worse. Inflation looked worse everywhere. Tariffs less so but the changes still felt negative. Immigration was more mixed, with fewer changes and not all for the worse.
Inflation dominated as a top issue nationally and locally across the board for the third consecutive year. Homelessness is still resonating as a top issue at the local level. Government and business corruption took a big jump as a national issue from 2024 to 2025; gun violence and crime stayed relatively low.
In a deeply divided country, AI has emerged as an area of agreement. In no community did a majority see its potential future impact as positive on any issue — from daily life to livelihoods to children. And strong majorities in every type want more government regulation of AI.
This American Communities Project/Ipsos poll was conducted August 18–September 1, 2025, using Ipsos’ probability-based KnowledgePanel® and from August 18–September 4, 2025, using an RDD telephone sample. The poll was conducted among a sample of 5,489 Americans aged 18 or older, with 4,889 surveys completed online and 600 interviews conducted via telephone. For the online portion, the survey was conducted using the probability-based Ipsos KnowledgePanel® and fielded in both English and Spanish. The RDD Telephone portion was conducted in English in the Native American Lands and Aging Farmlands. The Native American Lands and Aging Farmlands were excluded from some questions because the RDD mode of questioning made the survey too long. The data were weighted to U.S. Census targets in each area segment and at the national level. A fuller methodology can be explored here: ACP Methodology Statement November 2025
A note about how to read these data
The ACP’s community types were created by collecting and analyzing 36 different data points across all the 3,100-plus counties in the United States. The result is 15 different kinds of community spread across the United States. Some are regionally clustered, and others are scattered. You can see all the types mapped and explained below.
(Click type names to see more on each.)
African American South: Places with large African American populations. Lower incomes and higher unemployment. Home to more than 13 million people.
Exurbs: Wealthy communities usually on the edge of metro areas, Largely white with lower crime rates. Home to more than 31 million people.
Military Posts: Located around military installations. Younger, middle-income, diverse communities. Home to more than 9 million people.
Aging Farmlands: Sparsely populated and overwhelmingly white. Low unemployment, agricultural economy. Home to more than 1.1 million people.
Graying America: Places with large senior communities. Generally rural and less diverse, middle-income. Home to more than 16 million people.
Native American Lands: Places with large Native American populations. Young communities with lower incomes. Home to more than 900,000 people.
Big Cities: Counties holding the nation's largest cities. Dense and diverse. Home to more than 81 million people.
Hispanic Centers: Large Hispanic populations in mostly rural communities. Younger with lower incomes. Home to more than 17 million people.
Rural Middle America: Largely rural and white communities. Middle income and average educational attainment. Home to more than 24 million people.
College Towns: Urban and rural communities that are home to campuses and college students. Home to more than 24 million people.
LDS Enclaves: Places dominated by Latter-day Saints adherents. Younger and middle-income. Home to more than 3.5 million people.
Urban Suburbs: Educated and densely populated communities around major metros. Racially and economically diverse. Home to more than 70 million people.
Evangelical Hubs: Places with above-average numbers for evangelical adherents. Largely Southern with fewer college grads. Home to more than 9.8 million people.
Middle Suburbs: Middle-income, blue-collar communities mostly around metro areas. Home to more than 12 million people.
Working Class Country: Rural, blue-collar communities. Low incomes and college graduation rates. Home to more than 10.5 million people.
Changes in Hopes for the Future
In the 2024 ACP survey, we noted sharp differences between how people felt about their personal future and the future of their community (generally positive) and the future of the country (considerably less positive). That trend appears in this year’s survey as well, but with one big additional finding in 2025. There are large swings in feelings about the future of the country in different communities.
Generally, in 2025, community types that voted for President Donald Trump in 2024 are feeling much more positively about the future of the United States in the short- and long-term. Meanwhile, places that voted for Democrat Kamala Harris are feeling somewhat less positively.
One exception to that standard red/blue understanding of politics is the Hispanic Centers. The presidential vote in these counties flipped in 2024. They voted for Joe Biden narrowly in 2020, by 2 percentage points, but voted for Trump by 10 points in 2024. And yet, in 2025, they feel less positively about the future of the United States in the short- and long-term than they did last year. (We’ll detail that change below.)
Blue and Red Differences
First, consider the feelings about the future of the United States in the “next few years.”
Only four community types in the ACP voted for Harris in 2024, including the two most populous. All four saw declines in being hopeful for the future. The other Trump-voting community types largely moved to being more hopeful about the nation’s short-term future.
What’s behind the differences in the changes in Democratic-leaning communities and Republican-leaning places? It could be that four years of Joe Biden’s presidency had already left Democrats disheartened by 2024. Or it could be that Democratic-leaning communities are naturally less optimistic about the nation’s future because of other concerns, such as climate change.
Whatever the reason, that red/blue split appeared again when the question turned to the long-term future of the United States.
Some of the year-over-year moves are smaller. Consider the positive shift in Evangelical Hubs and the negative shift in Big Cities. Some of the moves are larger, such as the increased positive feelings in Working Class Country and Graying America. But all those differences may be about Donald Trump’s limited time in office, which some communities may see as bad news and others may see as good news. Regardless, the overall red/blue pattern largely holds.
These 178 counties are of special note because of the massive shift in their presidential vote. In 2020, Joe Biden won them by about 2 percentage points. In 2024, Donald Trump carried them by 10 points. That’s a flip and 12-point shift in four years.
And yet, in this poll they are a true outlier. In 2025, residents in Hispanic Centers said they feel less hopeful about the future of the United States in the short-term (by 4 percentage points) and the long-term (by 8 percentage points) than they did in 2024, even though they voted for Trump.
What’s going on in the data? These numbers suggest there may be some buyer’s remorse in those communities and immigration may be playing a role.
President Trump’s short time in office in this second term has been marked by massive changes on a variety of fronts — tariffs, government layoffs, budget cuts. But it will take time for the general population to feel the impacts of some of those policy moves. They are slow-moving by their nature. The administration’s efforts around immigration, however, have been different. The impacts have been much more immediate and have generated a lot of headlines and dramatic video. Those efforts have also largely targeted the nation’s Hispanic/Latino population. Taken together, it’s reasonable to think those changes could be a big part of the drop in hopefulness in Hispanic Centers.
Beyond this survey, there have been other signs of a broader partisan shift among Hispanic voters. In the 2025 New Jersey governor’s race, Democrat Mikie Sherrill flipped Cumberland County, the state’s only Hispanic Center county, on her way to winning her race. Cumberland, which is 36% Hispanic, voted for Trump by about 4 percentage points in 2024, then voted for Sherrill by about 4 points in 2025. Exit polls showed Hispanic voters backed the Democratic candidates for governor in New Jersey and Virginia with 68% and 67% of the vote, respectively.
The ACP will be diving into the Hispanic Centers more in the coming year to further explore the changes here. There could be drivers beyond immigration. For instance, these communities also tend to have lower incomes and are more susceptible to the problems that come with inflation. But changes around immigration enforcement seem likely to be a big issue here.
Changes in Issues at the Community Level
The last year has brought big shifts on a variety of issues. To better understand what those changes look like in the ACP’s 15 community types, the survey asked respondents if they had noticed changes in their communities in seven key areas: inflation, tariffs, immigration, K-12 education, infectious disease outbreaks, higher education, and vaccine availability. And if they had noticed changes, the survey asked if they were “mostly positive,” “mostly negative,” or a mix of both.
Three issues stood out: inflation, tariffs, and immigration. Nationally, at least 50% of respondents said they had noticed changes on these issues. But which communities noticed changes and their attitudes toward the moves varied by community type.
Inflation
Of all the topics we measured, inflation was striking for being a common area of agreement. In every one of the ACP’s 15 community types, overwhelming majorities said inflation or rising prices had changed as an issue in the last year. And in all the types, solid majorities said the changes had been negative.
The range of respondents noticing a change on inflation went from a low of 76% in Working Class Country to a high of 90% in LDS Enclaves. In 13 of the 15 community types, 70% or more respondents said the changes were negative.
The ACP looks at a lot of data through the lens of its 15 types, and it is rare to find large areas of agreement among them. Inflation as a major problem has been a consistent point of agreement over the three years of this survey. But the responses on this question in particular stand out because even with a new president at the helm in a deeply divided country, people in all the community types believe inflation is a problem and it’s not getting better. The data suggest that the issue of inflation and/or rising prices is big enough to cut through the partisan divides in the country.
Of course, who people in each of these communities blame for inflation is a very different question that would likely generate different answers. And knowing what we know about incomes in the 15 community types, they are likely experiencing inflation differently. Still, finding common ground on a big topic is a rarity. In 2025, inflation looks like a broadly potent issue in politics.
Immigration
On the opposite end of the spectrum, immigration stands out as an issue that generates much less agreement. Nationally, 51% of those surveyed said they’d noticed changes in immigration in their communities, but at the individual community level there were wide discrepancies. Even among those who noticed changes, many communities did not see the changes as negative.
Hispanic Centers and Big Cities, two community types with large immigrant populations, led the way on this question, with 65% in each saying they had noticed changes. They were also the communities with the largest numbers saying the changes they noticed were negative.
But there were also seven community types where less than 50% of respondents said they noticed changes around immigration in their communities. And among those seven, there were four community types in which less than 40% of respondents said the changes were negative — Evangelical Hubs, Native American Lands, Rural Middle America, and Working Class Country. Those types have some of the smallest Hispanic populations in the ACP.
The data show how divisive immigration remains in the United States, and news consumption habits likely have something to do with that divisiveness. Depending on where one consumes news, the Trump administration’s changes in immigration enforcement may be portrayed as big, scary government overreach or as law enforcement at work.
A few points of note. Hispanic Centers again seem to be an outlier here. They voted for Trump but are still among the most unhappy with changes in immigration. And other Trump-voting communities had concerns. The thoroughly conservative LDS Enclaves, which are mostly based in Utah and also have larger Hispanic populations, saw negative changes in immigration. In Aging Farmlands, fewer people noticed changes in immigration in their communities, but the ones who did were more likely to see negative changes.
Tariffs
The beginning of Trump’s second term has been marked by a lot of talk about and activity around tariffs. They’ve been added, then removed, then added again, and they target most of the globe. But measuring the community impact of tariffs is not easy. It can be done by looking at rising prices on the shelves at Walmart or by looking at the struggles of local businesses.
Still, 57% of respondents nationally said they noticed the impacts in their communities and, perhaps more noteworthy, the people who noticed overwhelmingly saw the impacts as negative. (Note: Aging Farmlands and Native American Lands were not asked this question due to cost and time constraints.)
The numbers on tariffs are among the most interesting because they break through some traditional red/blue divides. Of the six community types standing above the 57% national average that noticed a change on tariffs, three voted for Democrat Kamala Harris in 2024 (Big Cities, Urban Suburbs, and College Towns) and three voted for Trump (LDS Enclaves, Military Posts, and Hispanic Centers). To be clear, the 15 community types come from different places economically and have different needs. Where tariffs are concerned, some may rely more heavily on imports than others as consumers, while others lean on manufacturing and may be getting squeezed on production costs. But the red/blue split among the communities noticing tariff impacts suggests, again, that economic concerns rise above the nation’s deep partisan dynamics.
While it may be hard to nail down the specific impacts of a policy as broad as tariffs, the percentage of people in each type who see the changes around tariffs as negative is high across the board, from 60% in Working Class Country to a massive 84% in College Towns.
Again, that kind of agreement is not common in the 15 community types that the ACP studies. For all the big changes the Trump administration has made since the January inauguration, changes around the economy seem to carry the biggest and farthest-reaching impacts on how people perceive the White House and its agenda.
Most Important Issues Facing Your Community, Now and Then
Affordability has indeed been a unifying issue for Americans. As was true for the 2023 and 2024 surveys, inflation or increasing costs was No. 1 when residents were asked to identify the “most important issues facing your local community.” Nationwide, 50% of residents said inflation or increasing costs. For LDS Enclaves, the figure reached 64%, the highest among the 15 types. Rural Middle America, Exurbs, and Urban Suburbs hovered in the mid-50s. In the African American South, 40% of residents said inflation was one of the most important issues facing their local community. Higher costs continue being felt across income strata.
But after the top spot, variance emerged in the second and third most important community issues. In the African American South, 35% of residents said crime or gun violence, just below the figure for inflation. In Big Cities, Hispanic Centers, and College Towns, homelessness/housing insecurity was the second most salient community issue at 31%, 28%, and 27%, respectively. All have higher youth and young adult populations.
But one of the big stories in the data is how those second and third most important issues have and have not evolved over the past three years.
In the African American South, for instance, crime/gun violence has held as the second most important issue in all three years of surveys by ACP/Ipsos. It seems these Southern communities are facing different challenges than other places.
For College Towns and Hispanic Centers, 2025 was the third consecutive year that homelessness/housing insecurity was the No. 2 community issue, suggesting more of a chronic challenge in those places. Big Cities also see homelessness as a more consistent problem. It was the No. 2 issue in 2025 and 2024. Crime was the No. 2 issue in 2023, as the country was still emerging from the Covid-19 pandemic.
In lower-income, rural, mostly white areas, drug use remained top of mind. Residents in Evangelical Hubs and Working Class Country said opioid or drug addiction was the No. 2 community issue. In both community types, this issue also ranked No. 2 in 2024 and 2023.
For Graying America, the No. 2 issue has shifted each year. Healthcare was No. 2 in 2025. Taxes were No. 2 in 2024, and opioid or drug addiction was No. 2 in 2023.
Most Important Issues Facing the Nation
For Americans, increasing costs also continue to be the top national problem in 2025. Residents were asked to choose up to three of the most important issues facing the nation from the following (which were the same options in the local community):
abortion
climate change
contagious disease (Covid-19, RSV, etc.)
crime or gun violence
economic inequality
education
election security or fraud
foreign conflicts or terrorism
government or business corruption
government budget and debt
healthcare
homelessness/housing insecurity
immigration
inflation or increasing costs
natural disasters or severe weather
opioid or drug addiction
political extremism or polarization
race and racism
taxes
unemployment
Across communities, people said inflation or increasing costs is the No. 1 issue facing the nation. (This was true in 2023 and 2024 as well.) For most communities, the percentage was in the low-to mid-40s. For Big Cities, it was slightly lower at 37%.
Government or business corruption has jumped as a national issue of concern from 2024 to 2025. This year, 23% of Americans cited it as a top-three issue. Last year, just 14% did. Leading the shift were dense, multicultural populations that did not vote for President Trump. Big Cities leaped 14%, while Urban Suburbs jumped 13% and the African American South 12%. However, corruption also rose as an issue in places that did vote for Trump, including Hispanic Centers, LDS Enclaves, and Military Posts.
Concerns about America’s social fabric and political culture continue across communities. Political extremism or polarization ranked as the second most important national issue at 27%. Last year, the percentage was 26%, but the ranking was third behind immigration. In 2023, 26% cited the issue. The issue’s salience echoes recent national polling.
Drilling down to the community level, LDS Enclaves, Mormon-dominated, rural-oriented places in the interior West, stood out from the pack. Here 39% of residents said political extremism or polarization was one of the most important issues facing the nation. In 2023, 30% said so. This year, political extremism was also reported as a top-tier concern in both the Urban Suburbs and Big Cities. College Towns, where protests and speech have been fraught, came in just behind.
Less surprisingly given the intense political focus and media coverage these past several years and the continuing ICE raids today, immigration was considered the No. 3 most important national issue. Overall, 26% of residents said immigration was a top-three issue facing the nation. Some communities with the greatest concerns were those with fewer immigrants: Evangelical Hubs at 33%, Graying America at 32%, Rural Middle America at 31%, and Middle Suburbs at 30%. At the same time, 30% of residents in Hispanic Centers, where an average of 53% self-identify as Hispanic, said immigration was one of the most important issues facing the nation.
Many Concerns About AI
So much of the ACP’s work centers on the differences in the 15 community types, but there are some issues that cut across all of them. Attitudes about artificial intelligence fit into this category.
The latest ACP/Ipsos survey shows how AI has been integrated into American life, less than three years after the arrival of ChatGPT. Among the 90% of Americans familiar with generative AI platforms, such as ChatGPT, Gemini, Copilot, and Claude, nearly half, 47%, said at least every two weeks they use these platforms. In Urban Suburbs and Big Cities, more than 50% of residents said they use them. In many communities, significant numbers reported using generative AI daily and weekly.
In very rural places, using generative AI tools every two weeks is less commonplace — just 19% in Native American Lands and 22% in Aging Farmlands reported such behavior. Note that the two rural communities were given yes or no options by telephone, and residents interviewed may not be as tech savvy as those in the 13 community types participating in an online panel.
Nonetheless, concerns about AI seem to unify the diverse community types in several aspects. On day-to-day life outside of work, only 37% felt positively about AI’s potential future impact. Feeling slightly more positively than average were Big Cities and Urban Suburbs at 41%, and Exurbs and LDS Enclaves at 42%. These communities contain some of the heaviest regular users today.
Positivity went down from there. Just 23% of residents nationwide rated AI’s potential future impact on children generally as positive. The African American South and Native American Lands, which have endured health and socioeconomic inequalities for generations, conveyed a slightly more hopeful view of AI’s potential future impact on children.
Similarly, anxiety about one’s own livelihood was clear. Just 26% felt positively about AI’s potential future impact on “your ability to earn a living.” Older communities, including Graying America and Evangelical Hubs, felt less positively than the average.
As respondents considered AI’s potential future impact on the U.S. generally, less than one-third, 31%, said they felt positively. The community types typically hovered around this average. And the rural-urban divide wasn’t evident. For instance, two rural communities, the LDS Enclaves and Rural Middle America, were at the high and low ends of the spectrum at 35% and 26%, respectively.
With the wide-ranging concerns articulated, 62% said “AI needs more government regulation.” On this statement, there was again little variance across the 15 types. For Aging Farmlands’ residents, who were asked the question by phone and generally want less government intervention, 55% said AI needs more regulation. In Military Posts and College Towns, 58% and 59% of residents, many of whom are young people of diverse backgrounds, agreed with this sentiment. In this time of cultural divisions, it’s noteworthy that clear majorities across geographies favor more regulation of AI.
Lots Of Work Ahead
The findings reported here represent only a small sample of the recorded responses in this survey. The ACP will write about more of the results in the weeks ahead.
Beyond that, we will be traveling to communities that represent the different types to understand the “whys” behind a lot of these numbers. Surveys can be excellent tools for obtaining a basic understanding of what people think, but they are usually not as good at explaining the thought processes behind those views.
The beginning of 2025 brought a lot of change to the country across a wide range of issues. There is little reason to believe that the pace of change will slow at the end of this year or in 2026. Rather there are signs that dramatic change could be a way of life in the United States for the next few years. The communities the ACP studies will be experiencing and reacting to those changes differently. The only real way to understand the shifts more fully is to talk to the people who make up these 15 community types, and the nation as a whole.
For the last few months, the American Communities Project has noted that unemployment rates were rising across the country in many different kinds of communities — including places that are often more resilient in mild economic downturns.
The August data suggest that story goes on, with 10 of the 15 community types showing higher unemployment rates this August compared with August 2024. Three community types saw no change in their unemployment rates while two others saw declines.
When the analysis of the employment situation includes the number of people employed this August compared with August 2024, 11 of the 15 community types have seen either an increased unemployment rate or a decrease in people employed.
It’s possible to have a rising unemployment rate even with more people employed because the labor force can grow. A loss in the number of people who are employed can suggest a discouraged workforce. In August 2025, seven community types had fewer employed people than they did in 2024.
The patterns the ACP sees in the August numbers are like ones we saw in June. That is, the increases in unemployment don’t seem to follow the normal patterns around job losses. Places with higher incomes and more college degrees were just as likely to have a worse employment situation this August as rural places with fewer high-end jobs.
The Numbers
On the whole, the unemployment track in the county data from August does not look that different from the data in June. The national unemployment rate is up 0.1% again. At the community type level, many of the same places that saw increases in unemployment or decreases in the number of people working were the same.
The only difference in the figures came in the African American South, where the unemployment rate dropped and more people were employed in August 2025 compared with August 2024.
For these monthly analyses of county data, the ACP compares the latest data to the same month from the previous year. That’s because the county numbers are not “adjusted” to account for differences in industry hiring tied to seasonal changes.
Even with that caveat, there some signs in these numbers of a slowing economy.
Nationally, there were 268,000 more people working this August than in August 2024. But that increase is about half the increase we saw in the June data, which showed an additional 500,000 people employed in 2025 compared with 2024.
As we noted with the June data, this is a mix of places that is curious because of its spread. Some places are quite rural — such as Hispanic Centers, Rural Middle America, and Graying America — but the Urban Suburbs stand out.
The Urban Suburbs have the highest median household income of all the types in the ACP at about $90,000. Those 112 counties also have the population with the highest share of bachelor’s degrees.
Normally when the economy hits a bumpy patch of road the Urban Suburbs are less likely to feel the immediate effects than other places. The fact that they are among the leaders in unemployment increases in the last few measurements suggests something different about this current slowdown. The trend has not gone unnoticed and may be tied to cuts in government jobs and the adoption of AI.
To be clear, the Urban Suburbs are still doing well economically. Their unemployment rate is still below the national average of 4.5% for August, but the employment situation appears to be worsening relative to the national figure.
Also worth noting, Rural Middle America and Middle Suburbs both saw increases in unemployment and decreases in the number of people employed in these August numbers. Those two community types are the leaders in manufacturing employment in the ACP, and those labor figures suggest that sector of the economy is stalled.
That jibes with data from the Bureau of Labor Statistics that shows a decline in manufacturing jobs this year. It also suggests that, if the employment picture in those places doesn’t turn around in the next year, “jobs” are likely to be a theme in their congressional elections. Many voters in those communities voted for President Trump in 2024 due in part to a promise to bring jobs back.
GivingTuesday Data Commons has been running a weekly national survey on generosity and identity in the U.S. for the past three years. We reported on what we learned about the Populist Right in July and the Left in August. Now we follow up with insights about centrist groups.
We use an eight-part question about one’s worldview to place people on the U.S. political spectrum, adapted from a Pew Research survey. Combining this with ACP’s model tells us how the current political landscape plays out in various community types.
68-91% of Centrists agree that America’s openness to people from all over the world is essential to who we are as a nation. This is one of the few policy positions that all three centrist groups share, and they align with the Left on this. Few Centrists support stronger border security.
How Centrists’ Values Compare With Those on the Left and the Right
They are slightly less likely to have participated in an act of generosity. They are also less likely to report being asked to participate through solicitation.
They are less likely to report trusting other people.
They are most likely to feel “ambiguous” about their sense of community belonging, rather than having a strong sense of belonging or non-belonging.
When asked what their most important act of generosity was, they are most likely to value giving items, and less likely to value volunteering.
They appear to be less “plugged in” to community or national issues. Within the larger umbrella of Centrists, Stressed Sideliners are defined by their lack of time to engage, due to economic stress.
Where are they found? Centrists are evenly spread across all community types (typically around 16-21% of the population), but more prevalent in the African American South (26%) and least prevalent in Military Posts.
Political Shifts in 2025 toward centrism
In the first half of 2025, we saw a shift in some of the most conservative parts of America toward centrist beliefs. This combines both a shift in the center-left toward centrist ideas and a shift from the Populist Right toward the center.
(Footnote on our tables and maps: We recoded LDS Enclaves as Evangelical Hubs, Aging Farmlands as Working Class Country, and Native American Lands as Hispanic Centers due to limited sample size, as those were the closest county types. All remaining groups had at least 150 respondents. County types are ordered by largest to smallest sample size.)
The table shows the change in the percent of each respective community type that align with the Right, Center, or Left between 2024 and 2025. The percent of population in the table comes from our 2025 sample.
Note how Centrists were least prevalent in these areas in 2024:
People in Hispanic Centers and Military Posts
In the first half of 2025, people in Hispanic Centers have shifted politically. Hispanic Centers are filled with younger residents with lower incomes. These areas, concentrated in the Southwest and Florida, appeared to be Populist Right strongholds in the second half of 2024. Since then, they have appeared to shift toward a mix of less conservative beliefs in 2025. Overall, 1 in 3 respondents in these areas appeared to have Populist Right beliefs in 2024; now 1 in 5 appear to have them in 2025. It is important to note that Hispanic Centers have only a slim majority (53%) of people who identify as Hispanic on average. The counties are where immigration is a hot-button issue, according to the American Communities Project. They narrowly voted for Democrats in every national election since 2008 but shifted toward Trump in 2024.
Hispanic Centers
Military Posts — young, diverse, middle-income communities around military bases — differ in that they were dominated by the Populist Right in 2024 and have since moved toward traditional “Committed Conservative” ideas in 2025. Also, about 1 in 4 identified as Centrist here in 2024, but now only 1 in 12 are in 2025.
Military Posts
How fluid are political identities?
The political center (around 37% of the population) is defined by some combination of disliking both political parties and feeling too busy/stressed to engage, but they’re not always the same people, year after year. Pew Research finds that people drift in the way they think about issues and how what they believe shapes their identity. They report that 9% of Republicans or Democrats switched to the opposite party between 2018 and 2020 (based on a sample of 11,077 voters), more than the typical margin in national elections. Based on our data, we also find that changing beliefs or growing doubts around a single belief could reassign a person to a different group. In particular:
If Establishment Liberals lost faith in the government as the answer, and began to see religion as a valuable partner, about 70% of Establishment Liberals would become Democratic Mainstays.
Members of the Outsider Left feel a disconnect with the Democratic party. If they trusted it more, they would align with the Progressive Left.
About 30% of the Ambivalent Right would realign with Stressed Sideliners if they were to start believing that the economic system unfairly favored powerful interests over regular people.
In the first half of 2025, we began to see the Populist Right and Ambivalent Right align on immigration. Previously they split over their openness to people from around the world, but now the Populist Right is more open to the world (shifting from 23% support for openness in 2021 — according to Pew — to about 50% support in 2025), while the Ambivalent Right is becoming less open (75% support dropped to 66% in 2025).
Conclusions
In our sample of 6,700 people over the last 15 months, we see early signs that groups on the right are adopting more centrist views in early 2025. Further research may uncover key drivers of these shifts.
Marc Maxmeister, Senior Data Scientist at GivingTuesday, helps organize and convert the world’s generosity data into meaningful insights into how giving works, and what organizations can do to improve the lives of people served. He brings context from mixed methods field research in Africa, rigor from his Ph.D. work as a molecular neuroscientist, and engineering from past AI-driven startups and nonprofits.
The last few decades have not been easy on the U.S. economy. From the mortgage crisis and the Great Recession to the impacts of the Covid-19 pandemic, supply-chain disruptions, and high inflation, it’s been one hit after another.
But an analysis of key economic metrics since 2010 in the American Communities Project does not show massive struggles and pain. In most community types, the data suggest many economic conditions have actually improved — although at uneven rates.
The one exception is homeownership — and that concern may be driving a lot of angst in the U.S. today.
To understand the state of the economy, the ACP examined four key economic indicators for all 15 community types:
median household income (adjusted for inflation),
homeownership,
percentage of the population with a four-year college degree, and
the Gini Index (a measure of economic inequality).
For each indicator, the ACP focused on three points in time:
2010,
2019 (the last year before the pandemic), and
2023 (the last year for which there is complete five-year data from the U.S. Census American Community Survey).
There are challenges in using these data. The American Community Survey collects figures over a five-year period, so the 2023 sample includes data that goes back to 2019 and includes the pandemic, but it’s a robust sample that can still reveal changes over that period.
Ultimately, the data draw a nuanced picture of who is “winning” and who is “losing” in the American economy. They also show how where you live may play a big role in how you see the U.S. economy in 2025.
Median Household Income
The headline in the story of median household income in the ACP: Every community type is doing better than it was in 2010 — and that includes adjusting the amounts for inflation.
To calculate these numbers, the ACP focused on the median household income in every county in each of the 15 community types, and then looked at median county in each, adjusting the amounts for inflation using the Bureau of Labor Statistics Inflation Calculator.
While every kind of community saw an increase by this measure, increases were far from uniform.
The African American South saw the smallest increase, about $2,300, adjusted for inflation and less than 5% in terms of percentage. But the jump was three times higher in the LDS Enclaves, which saw the biggest percentage increase at 14.5%, perhaps due, in part, to the rapid growth of those communities, particularly around Salt Lake County, Utah. The Aging Farmlands and Big Cities also saw double-digit jumps, at 10.4% and 12.3% respectively.
Perhaps most interesting, the urban-rural split often seen in economic data (with urban places outperforming rural ones) doesn’t really appear. The Aging Farmlands and Big Cities are the least densely populated and most densely populated community types in the ACP, and they both saw big growth in income. Rural Middle America saw its median household income grow faster than the Middle Suburbs.
The data suggest the tumult that has shaken the economy in the past two decades is having complicated impacts, upsetting the idea of who’s winning and losing. That makes sense for an economy adjusting to a rapidly changing world.
But the impacts of the Covid pandemic are also apparent in these numbers.
Some community types saw the biggest part of their increase in the wake of the pandemic. That’s true for Graying America, Middle Suburbs, and Working Class Country. And the African American South and Military Posts saw their median household incomes decrease between 2010 and 2019 when adjusted for inflation. The entirety of their household income gains since 2010 came after the pandemic.
Meanwhile, other communities experienced their biggest increases in median household incomes before the pandemic. That group includes the community types that are more urban/suburban and that have higher incomes and more college degrees: the Big Cities, Urban Suburbs, and Exurbs.
The data suggest that the government payments during the pandemic and the inflation that followed it (and that angered many voters) actually helped communities with lower incomes — at least more than it helped communities on the top economically. That surprising bit of data may be because the wage pressures that came with inflation had a bigger impact in places where the wages were lower.
Homeownership
What has happened to homeownership, long the epitome of the American Dream, is mostly the inverse of the story of median household income. Notably, owner-occupied housing declined in 11 of the 15 community types from 2010 to 2023 amid a series of economic weaknesses, according to the ACP’s analysis. Since the Great Recession in 2007-2009, brought about by the subprime mortgage lending crisis, building new housing units slowed and never really recovered. Housing continues to be a wicked problem nationwide.
In the most populated community types — the Big Cities and Urban Suburbs — homeownership percentages actually declined three points in these 13 years, to 55% and 67% respectively. In Big Cities, characterized by multiculturalism, stratified environments, and prohibitively high ownership costs, residents don’t necessarily see owning a home here as a goal. These communities are also full of more young people who are just starting their lives and, usually, renting. In the Urban Suburbs, where owning is more common, it has also become harder as the cost of living and economic precarity have increased.
A range of community types experienced dips in homeownership from 2010 to 2019 and inched up after the pandemic receded, but in 2023 was still slightly below 2010 numbers. It’s impossible to know whether the pandemic and associated economic changes led to a temporary shift in the trajectory of homeownership. But federal data show that ownership numbers are falling again — and all community types appear to be experiencing such declines.
In the case of two community types sitting side by side in the South — the Evangelical Hubs and the African American South — the persistent racial divide in ownership is evident. In 2023, the mostly white Evangelical Hubs hovered around 76%, while the African American South sat at 68%. Over these 13 years, owner-occupied housing declined in both, but to different degrees. In African American South communities declined 1.7%, while ownership in Evangelical Hubs dipped 0.3%.
Aside from the Big Cities, College Towns, filled with transient residents, posted the lowest ownership rate at 62% in 2023, followed by economically depressed Native American Lands at 65%.
Where ownership increased in these 13 years was generally in more middle-class, homogeneous, rural communities: Graying America counties, which are scattered all over, Aging Farmlands in the Midwest, and LDS Enclaves in the interior West. The exception was the Native American Lands, which increased by 0.2%.
Aging Farmlands and LDS Enclaves had the highest rates at around 78% in 2023. Graying America was just behind.
Bachelor’s Degree
Meanwhile, as the public and private discussions heated up over the question and value of college, all 15 community types saw continual increases in the percentage of residents with a bachelor’s degree or more between 2010 and 2023, with some types rising at greater levels than others.
The diploma-divide between urban and rural places was evident in this time as well — hovering around 20 points. By 2023, 41.9% of residents in the Urban Suburbs and 36.2% in the Big Cities had at least a bachelor’s degree. At the other end were low-income southern communities, the African American South and Evangelical Hubs, at 15.8%. Not far behind were Working Class Country communities primarily in Appalachia and the southeast at 17.6%, and Hispanic Centers and Native American Lands at 17.4%.
In these 13 years, degree increases were highest — above 7 percentage points — in the Big Cities, Urban Suburbs, and Exurbs, where white-collar industries are concentrated. Again, degree trends were lowest in rural locales, particularly in economically struggling and racially/ethnically diverse communities, including Hispanic Centers at 2.8%, the African American South at 3.3%, Native American Lands at 3.7%, and Working Class Country at 3.7%.
The average increase for all 15 types was 5.2% from 2010 to 2023. Eight types of various socioeconomic, generational, and geographic boundaries stood above the average, including Big Cities, College Towns, Exurbs, Graying America, LDS Enclaves, Military Posts, Middle Suburbs, and Urban Suburbs.
The Gini Index (economic inequality)
While the previous three indicators are clear-cut, economic inequality is more difficult to measure. The Gini Index (or Gini Coefficient) tries to do this by looking at the way income is distributed among the population of a place. The Gini creates scores between 0 and 1, where 0 represents complete equality and 1 represents complete inequality.
Looking at the 15 community types in the ACP, each one has inched a little more toward inequality since 2010, according to the Census data. However, the bigger increases mostly happened before the Covid pandemic. (Again, this measure was done by looking at the median county in each type.)
Every community saw its Gini score increase between 2010 and 2019. Some of the increases were bigger than others — the range was between .009 in the Native American Lands and .019 in the Hispanic Centers.
But in 2023, five community types saw small reductions in their median Gini score: Big Cities, Evangelical Hubs, Hispanic Centers, Urban Suburbs, and Working Class Country. To be clear, no drop was massive, but all were still noteworthy, especially when compared with the larger increases between 2010 and 2019.
Perhaps most interesting in those drops was the range of community types in which they appeared. Big Cities and Urban Suburbs are densely populated and home to a lot of residents with college degrees. Evangelical Hubs, Hispanic Centers, and Working Class Country are very different — largely rural with lower incomes and fewer degrees.
It’s hard to know what to read into those differences. Some may be due to the moment in time — temporary impacts of Covid relief funds.
The numbers in the Big Cities and Urban Suburbs make some sense as they tend to be home to more extreme wealth and poverty — that’s especially true of the Big Cities. But the figures for the Hispanic Centers and Working Class Country are harder to understand. Neither has an especially high median Gini score.
And it’s worth noting that the African American South, which has one of the higher Gini Index figures in the ACP, didn’t see any impacts post-Covid. Its median county score was unchanged. That may suggest that economic inequality in those communities is directly tied to their racial divisions.
Conclusion
Together the four indicators — median household income, homeownership, percentage with a four-year college degree, and the Gini Index — show a country not in dire straits but at an economic crossroads.
As the Trump administration has made deployment of the National Guard part of the nation’s discussion about controlling crime, multiple narratives have emerged.
Critics of the approach note that crime is actually down in most places, so it’s hard to discuss an emergency. Supporters argue that crime has long been out of control, especially in big cities, and the approach may help, at least temporarily.
Crime has been a subject of interest for the American Communities Project for years now, and we have asked about it in each of our first two surveys, especially in last’s years poll (see this piece from November 2024). And consistently the ACP finds attitudes about crime are complicated — some places cite it as a major problem, while others see fewer concerns.
But a few points jump out in the 2024 ACP survey data:
Nationally, “gun violence and crime” ranked below a long list of other topics at the community level including: inflation, taxes, homelessness, health care, immigration, and opioid and drug addiction.
In the individual community types, “gun violence and crime” was not cited as the top issue in any community. Across all community types, “inflation” was the top issue.
The African American South counties stood out as the only ones where greater than 30% of the population cited “gun violence and crime” as a top issue.
The Numbers
To be clear, the argument that crime is going down has a lot of merit.
The FBI’s Uniform Crime Report for 2024 found that violent crime declined by 4.5% compared to 2023 and property crime dropped by 8.1% in the same period. And a smaller study of cities in 2025 found that violent crime was down in the first half of this year compared to the same period in 2024.
But the ACP found sharp differences in what people said about crime in their local community depending on where they live.
The 2024 survey offered a long list of topics and asked respondents to choose up to three that are the “most important issues facing your local community.” The chart below shows the percentage in each community type that put “gun violence and crime” into that group.
A few points become clear:
First, the African American South counties truly stood above the others on the question of crime. A 10-percentage point gap in these data was noteworthy, and that followed the 2023 survey, where these same communities stood above all the others.
It’s important to keep those data points in mind as the Trump administration talks about, and deploys, National Guard troops. Crime is an especially complicated topic in the United States where realities can vary city to city and even block to block. And that’s especially true in the ACP’s Big City communities.
Washington, D.C., where the administration deployed National Guard troops more than a month ago, can be a very different city depending on where one sits. The outer reaches of Northwest Washington haven’t really seen guardsmen at all, and some D.C. residents have criticized the deployment on the National Mall especially during the daytime, where and when crime tends to be low.
That’s likely true in other Big Cities as well, where poverty and wealth as well as crime and safety are spread out very unevenly.
Indeed, the 2024 survey data suggest that if the goal is to help communities that have deep concerns about crime, the National Guard might be better deployed in the rural communities of the African American South. And President Trump announced last week that he was sending the Guard into Memphis, Tennessee, which is in Shelby County, an African American South community.
But even that approach is likely to face challenges.
Trump is not popular in Shelby County, where he got only 36% of the vote in 2024. It will be interesting to see how residents respond to the deployment and where the deployments happen.
But beyond that, there are 272 counties in the African American South, and the survey results in the ACP reflect deeply-rooted concerns about crime. That’s a lot of places scattered across a lot of states. It would be difficult to deploy the National Guard to all of them, and even if the administration could (and even if the communities wanted the troops there), they would leave at some point. One wonders how much any deployments would change the long-term concerns in those places.
The U.S. economy is a complicated machine full of difficult-to-read inputs and outputs, but June county-level employment data analyzed by American Communities Project paint the picture of an economy that is stagnant or slowing down.
In 12 of the ACP’s 15 community types, the unemployment rate was up and/or the number of jobs was down in June 2025 compared with June 2024. And there are signs in the data that the current employment picture is different than in the past.
Normally, communities with higher incomes and higher percentages of college-educated workers are less likely to feel the impacts of an economic pinch. When trouble comes, it usually hits people on the bottom of the economic totem pole first. But the June data show effects that are spread across all kinds of people and places. The trends the ACP saw last month seem to be continuing, with discouraging employment numbers in communities that lean more heavily on manufacturing. However, wealthier, better-educated places also seem to be taking hits in the June numbers.
The June Numbers
In these latest figures, the communities of Rural Middle America and the Middle Suburbs led the way in overall employment declines compared with June 2024 — with decreases of 50,000 and 14,000 respectively.
(County-level employment numbers are not seasonally adjusted, so they are best measured by comparing that data from the same month in the previous year.)
As we noted in our post on the May unemployment data, these two community types have the highest shares of manufacturing jobs in the ACP. They may be experiencing supply-chain challenges around the ongoing tariff war with other countries or the data could be showing some uncertainty from manufacturers around the future of consumer demand.
What’s more interesting in these June numbers, however, are the employment changes in other communities, such as the Urban Suburbs.
The Urban Suburbs have the highest percentages of people with a college degree and the highest median household incomes. They tend to be full of people who have higher-end, safer jobs. Yet these communities saw a 0.2 percentage point increase in unemployment and a net loss of 7,000 people employed in June 2025 compared with June 2024.
In some ways, that drop in the Urban Suburbs is not a huge surprise. Business media outlets have been writing about the struggles for white-collar workers for months — and high-earners have seen especially bad numbers.
But the fact that the worsening job picture extends across so many of the ACP’s 15 types, places driven by very different kinds of economic activity, is noteworthy.
The 0.3 percentage increases in the Graying America and Hispanic Center community types are good examples. Those communities are very different demographically and geographically. In the case of the Hispanic Centers, it’s hard to ignore the possible effect of the Trump administration’s aggressive approach to immigration enforcement. In Graying America, the data could indicate a slowdown in spending in communities where many live on fixed incomes. The ACP will have to visit some of those communities in the months ahead to get a better read on the data.
Messages in the Data
To be clear, none of these numbers signify a sudden, drastic change in the nation’s job picture. The drops in jobs and increases in unemployment are pretty mild. And the U.S. unemployment rate is still relatively low at about 4.2%. But the drops in jobs and increases in unemployment that appear in these June county data follow a not-so-good May, and together the two months suggest a possible directional shift.
Furthermore, the widespread nature of June’s lackluster job picture suggests bigger issues may be affecting the economy.
The 15 community types in the ACP are driven by very different economic factors. They tend to react differently to changes in the economy — with different economic “winners” and “losers.” Usually when there is similar movement across all the types, it’s because the economy is going through a difficult patch.
These kinds of more uniform moves, even with an economy that seems relatively healthy overall, are unexpected and merit a close eye in the months ahead.
In the last 20 years, more than 2,100 newspapers have shuttered across the United States, and tens of thousands of journalists have seen their positions evaporate. But the effects of all those losses have not been evenly distributed, according to an American Communities Project analysis of new data.
In 2025, the news ecosystem is akin to a severely worn patchwork quilt, with many counties left with mere threads of local news, according to an ACP analysis of data from Rebuild Local News, a nonpartisan organization that advocates for policies that revitalize community journalism, and Muck Rack.
Viewed through the lens of the American Communities Project, a person’s local news environment varies greatly depending on the kind of community they call home. In some locales, dozens or even scores of reporters and editors may be covering the local scene, even if the number is dramatically lower than it was 25 years ago, while in other communities, there is not a single journalist to be found.
That dearth of local reportage can have profound impacts on the affected communities. It means fewer (or no) people keeping eyes on local officials and events and, in a broader sense, a loss of community cohesion and identity.
Understanding the Data
The Rebuild Local News/Muck Rack count of journalists is complicated measure. It doesn’t tally all the people working as local reporters, it tries to distinguish them by their roles in the community. It looks at whether someone is a freelancer or an aggregator or whether the person has published anything in the first half of the year, when the data sample of was gathered. And using those measures it comes up with something it calls the “Work Adjusted” number of journalists for each county.
You can see those numbers on the map below.
But sorting those county data into their respective American Communities Project types shows the local news challenges in a different light.
What the Data Reveal
The first thing that jumps out of the ACP analysis is the figure for the Big Cities. That’s likely due to several factors. Metro daily newspapers still have decent-sized staffs. Interior suburbs in many of those counties often have their own small newspapers or outlets.
But the number may also be skewed by cities like New York and Washington that hold huge numbers of journalists. And remember Big Cities also hold a lot more people and generally produce a lot more news than other community types.
Also, on the higher side of journalists per community are the Urban Suburbs and College Towns. Those communities stand out for a few reasons. They tend to be home to more college graduates and higher incomes, which may suggest more reading and appetite for news, and they tend to be more densely populated and therefore more able to support news organizations.
Those are among the most rural community types in the ACP and four of them voted for President Donald Trump by huge margins in 2024 — wins of 30 percentage points or more.
The small number of local journalists in these places is about more than just meetings going uncovered or an increased chance for local corruption. The lack of local news in those places means the dominant source of news is likely to be national outlets, particularly cable news outlets that bring a more partisan cast to coverage.
The red/blue frame for events in the news doesn’t just overwhelm local news; in many ways this frame replaces it, as more news becomes nationalized – and that is especially true in communities where there are very few local journalists working.
Other Notes
One outlier in that local news coverage story seems to be the LDS Enclaves. Outside of Salt Lake County (the home of Salt Lake City), most of those counties are fairly rural. And yet, the average number of journalists per county in that community type is more than 10.
It might be tempting to associate that high overall number with the scores of journalists in Salt Lake, but that isn’t the whole story. About a quarter of the LDS Enclave counties, 9 of 39, are above the national average for working journalists. A big factor here may be community cohesion. LDS Enclave communities tend to be tightly knit, bonded by a common culture, and that may lead them to having more interest in local goings-on.
The Exurban local journalist figure also stands out at 9.2. It’s above the national average, but relatively low for communities with higher incomes and more college degrees. In some ways, these places are the opposite of LDS Enclaves, which may account for the lower figure here.
The Exurbs tend to be among the fastest growing communities in the ACP. In many cases, their community identity may still be developing, and their more recent growth may mean they lack the old media legacy infrastructure (older newspapers and outlets) that are part of the ACP’s more urban communities.
As the broader restructuring of the nation’s news media continues, the shifts in these numbers are worth watching now and in the coming years. Local news has traditionally been a way to get beyond the back and forth of national politics and debates, which have grown increasingly divisive. If local news continues to decline and the nation’s news environment is increasingly national, it may be difficult to stem that tide.
In the second year of the American Communities Project’s study of fragmentation in society, we focused on understanding Americans’ hopes and fears, and found that some communities, including Military Posts, Working Class Country, LDS Enclaves, Rural Middle America, Aging Farmlands, and College Towns, expressed less hope about the country’s future than the nation as a whole. We talked to many residents on the ground to learn more, as seen in the pieces below.
In our survey and field work this past year, we also probed Americans’ lived experiences — from their connections with family and friends, to what contributes to a good life, to crime happening to them and their networks, to why they choose to move, to the media they consume. Responses show that personal, proximate experiences shape people’s views of the important issues in their communities. Furthermore, we asked Americans nine knowledge questions on voting, immigration, crime, and economic issues nationwide, and found that community types of all education and income levels have difficulty discerning facts from falsehoods today.
Below are snippets and links to our full pieces from year two. Peruse the full survey results here.
As the 2024 campaign reaches its crescendo, Americans’ immediate and long-term hopes and fears are front and center. They are a visceral part of the story, heard in intimate conversations and seen in media coverage.
This summer, the American Communities Project delved deeper into understanding the drivers behind these complicated and often anxious views in our ongoing study of the fragmentation of American society, funded by the Robert Wood Johnson Foundation. The latest ACP/Ipsos survey of 5,000-plus Americans finds an overwhelming majority of residents across the Project’s 15 community types have hope for their personal future, but the percentages drop dramatically for the nation’s short- and long-term futures. Reasons for optimism and pessimism vary, but a lack of trust in leaders is a significant concern.
The survey examines the composition of Americans’ personal connections and finds their immediate social circles are complex and diverse across the community types. The survey specifically asks whether or not people of different political and ideological affiliations, income levels, religions, races/ethnicities, and sexual and gender identities are part of respondents’ social circles. In particular, it finds that most people’s circles have fewer scientists and government officials or workers, and only a tiny percent of journalists.
Most importantly, the survey finds these outlooks and personal connections play a large role in shaping Americans’ divergent worldviews including how they perceive inflation and immigration, two issues of sustained importance in American life that are dominating this campaign season. Taken together, the survey’s findings offer a map to better understand the different values and concerns that define the nation and suggest why finding common ground remains a vexing problem.
Editor’s note: Since 2018, we have connected with many residents across the country for our work, supported by the Robert Wood Johnson Foundation. This summer, we asked community members to articulate what’s been happening where they live since President Trump took office in January. Some asked for anonymity for safety concerns. We thank all those who shared their views and experiences for this story.
More than six months into President Donald Trump’s second term, the consequences of his administration’s policies and practices have been stacking and far-reaching. The food system, education, health, and well-being sectors have been hit hard, and anxiety over new hardships keeps surfacing and cresting as the “Big, Beautiful Bill” takes effect. Economic uncertainty is tangible. Immigrants, LGBTQ+, children, elders, veterans, and college residents are heavily bearing these consequences, often in the shadows.
We share perspectives from community members in rural, suburban, and urban community types in nine states from coast to coast: Oregon, North Dakota, Kansas, Texas, Minnesota, Wisconsin, Michigan, North Carolina, and Virginia.
A sense of fragmented reality has churned up intense emotions in public and private spaces across America. In this heated climate, where it seems hard to find humor, who’s going out to see comedy in their community? How are comedians performing in different places?
At the American Communities Project, we sought to understand what live comedy feels and sounds like in America, how comedians are tackling hot-button cultural issues on stage, and how various audiences are responding to their acts.
In our quest, writers around the country chronicled their experiences at comedy shows within or near their home counties, from the west to east coasts.
In the matrix used by the American Communities Project to define the nation’s counties, the jurisdictions hugging the Rio Grande are almost all “Hispanic Centers,” places where self-identified Latinos make up the largest share of the population, on average 53%. In the case of Starr and Hidalgo counties, the share is above 90%, making these some of the most uniformly Latino counties in the country. In the 2020 census, rural Starr stood at 97%, more urban Hidalgo at 91.9%.
There’s a bustling border crossing in Starr County’s seat, Rio Grande City. You could easily walk to the border from the domed government building in Rio Grande (pop. 15,317). The city manager, Gilbert Millan, told me Rio Grande City has worked hard to attract retail outlets that appeal to shoppers on both sides of the border, and it shows on his balance sheets. “We have had a historic tax collection year. Last year, we did over a half a million. This year, we’re close to 800,000. I’m sure you saw on the way in…we didn’t have Starbucks, or Chick-Fil-A three years ago. We are just booming!”
As the American Communities Project has explored divisions in the nation these last few years, immigration has stood out as an especially complex issue. People see it differently depending upon whether it is framed as local issue or a national one.
As a local issue, immigration is just one of many problems their communities face, and it ranks below several other concerns. But as a national issue, immigration is a serious threat to the nation that needs to be addressed. Furthermore, survey data show that people in every community type see the issue as a much bigger problem for the nation than they do for their communities.
The recent raft of polls focusing on President Donald Trump’s first 100 days in office do not paint a sunny picture for the White House. Trump’s job approval numbers seem largely locked in the low 40s in the major media polls — from 44% in the Fox News poll to 39% in TheWashington Post survey — with good-sized drops since his inauguration.
When voters went to the polls last November, they had a complicated set of concerns, but the data suggested the electorate was primarily driven by economic concerns. AP VoteCast found that 39% of Americans said the economy was their top issue in 2024, while 20% said immigration. Abortion was a distant third at 11%.
Digging deeper, a 2024 survey from the American Communities Project found that one issue was driving those economic concerns across all community types: inflation. And as the White House wades deeper into a tariff war with China, that point should not be lost.
To better understand how men and women see the United States more broadly, the American Communities Project analyzed male and female responses around hope for the future of the country in all 15 community types from our 2024 survey with Ipsos.
Two clear points jump out of the data.
First, on the whole, women seem to have a less hopeful view than men about the direction of the nation, both short- and long-term. That shows up in most of the community types and very different kinds of places, from the Aging Farmlands to the College Towns.
Second, the gender divides look very different in the community types. In some places, men and women seem to be largely in agreement about the near-term and long-term hopes for the country. In others, there were wide differences, and there are some where men are more dour.
As the local news landscape continues to shrink, a large swath of Americans say they absorb community news through the ether and their daily chatter, from going about their day to scrolling on social media to connecting with family and friends. At the same time, a large part of the population says they avoid the news, according to the latest American Communities Project/Ipsos survey of some 5,000 Americans, conducted last summer.
As if to underscore these points, our survey found that 40% of Americans spent zero hours or almost no hours reading online news sites in a day, on average. Another 39% said they spent one hour a day on online news sites. Overall, 21% read such sites for more than one hour in an average day.
Where people live and how they live are big parts of the American Communities Project’s work. And as the ACP studies the country’s fragmentation culturally, politically, and economically, our 2024 survey asked: “Would you like to move to a new community, city, or town (inside or outside of your current state)?”
Overall, 39% said yes, and 61% said no. The desire to move was highest in the African American South at 45% (where the nonrenewal rate was higher), Working Class Country at 42%, Big Cities at 41%, Hispanic Centers at 40% (also with a higher nonrenewal rate), College Towns at 40%, and Military Posts at 40%.
Amid America’s political frictions and loneliness epidemic, our recent ACP/Ipsos survey revealed a bright spot in Americans’ social lives: Across communities, people reported feeling connected to family or friends most days.
The American Communities Project and Ipsos asked 5,312 residents across the ACP’s 15 types how many days in the past week they felt connected to family or friends and how often they felt lonely. Overall, Americans said they felt connected to family or friends five out of seven days a week and felt lonely 1.2 days a week.
Feeling connected to family or friends was relatively uniform among the community types, but two very sparsely populated communities separated themselves from the pack.
What impacts the ability to live a good life? It’s a question long pondered — and answered — through one’s lived experiences. The American Communities Project and Ipsos asked this question to nearly 5,000 Americans recently to understand where the public stands today. Our findings underscore the significance of personal and local connections as well as a belief in commerce and civil society over government. Drs. Robert Waldinger and Marc Schulz chronicled the centrality of relationships in their 2023 best-selling book The Good Life.
In our survey, local enterprises as well as civic, volunteer, or charitable groups emerged in the strongest positions nationally, perhaps because these are well integrated into Americans’ day-to-day, warm interactions with friends, neighbors, colleagues, and community members.
The state of the economy, democracy, immigration, and abortion. Those were the most important issues fueling voters in the 2024 presidential election, according to the exit polls. Crime was not at the top of the list.
That may be because violent crime in the U.S. dropped in 2023 after surging — and drawing much media attention — during the pandemic.
While crime continues to be amplified in America’s different information ecosystems, it is very much felt at the community level and in some communities more than others, as shown in our survey findings of 4,712 Americans this year.
Ever since the day of the 2020 presidential race, rumors have circulated about illegal votes and cases of voter fraud. And for years now, those rumors have been knocked down as false with no real evidence to support them — again and again and again.
And yet…
In this year’s research survey from the American Communities Project, fewer than four in 10 respondents, 38%, knew those rumors were false. Even in communities that voted for President Joe Biden by large margins, fewer than 50% said they knew the following statement was incorrect: “There are tens of thousands of documented cases of voter fraud in the last election.”
As the 2024 campaign winds down, that incorrect understanding of the election facts is important to keep in mind, but it is by no means the only area where Americans struggle to discern fact from fiction.

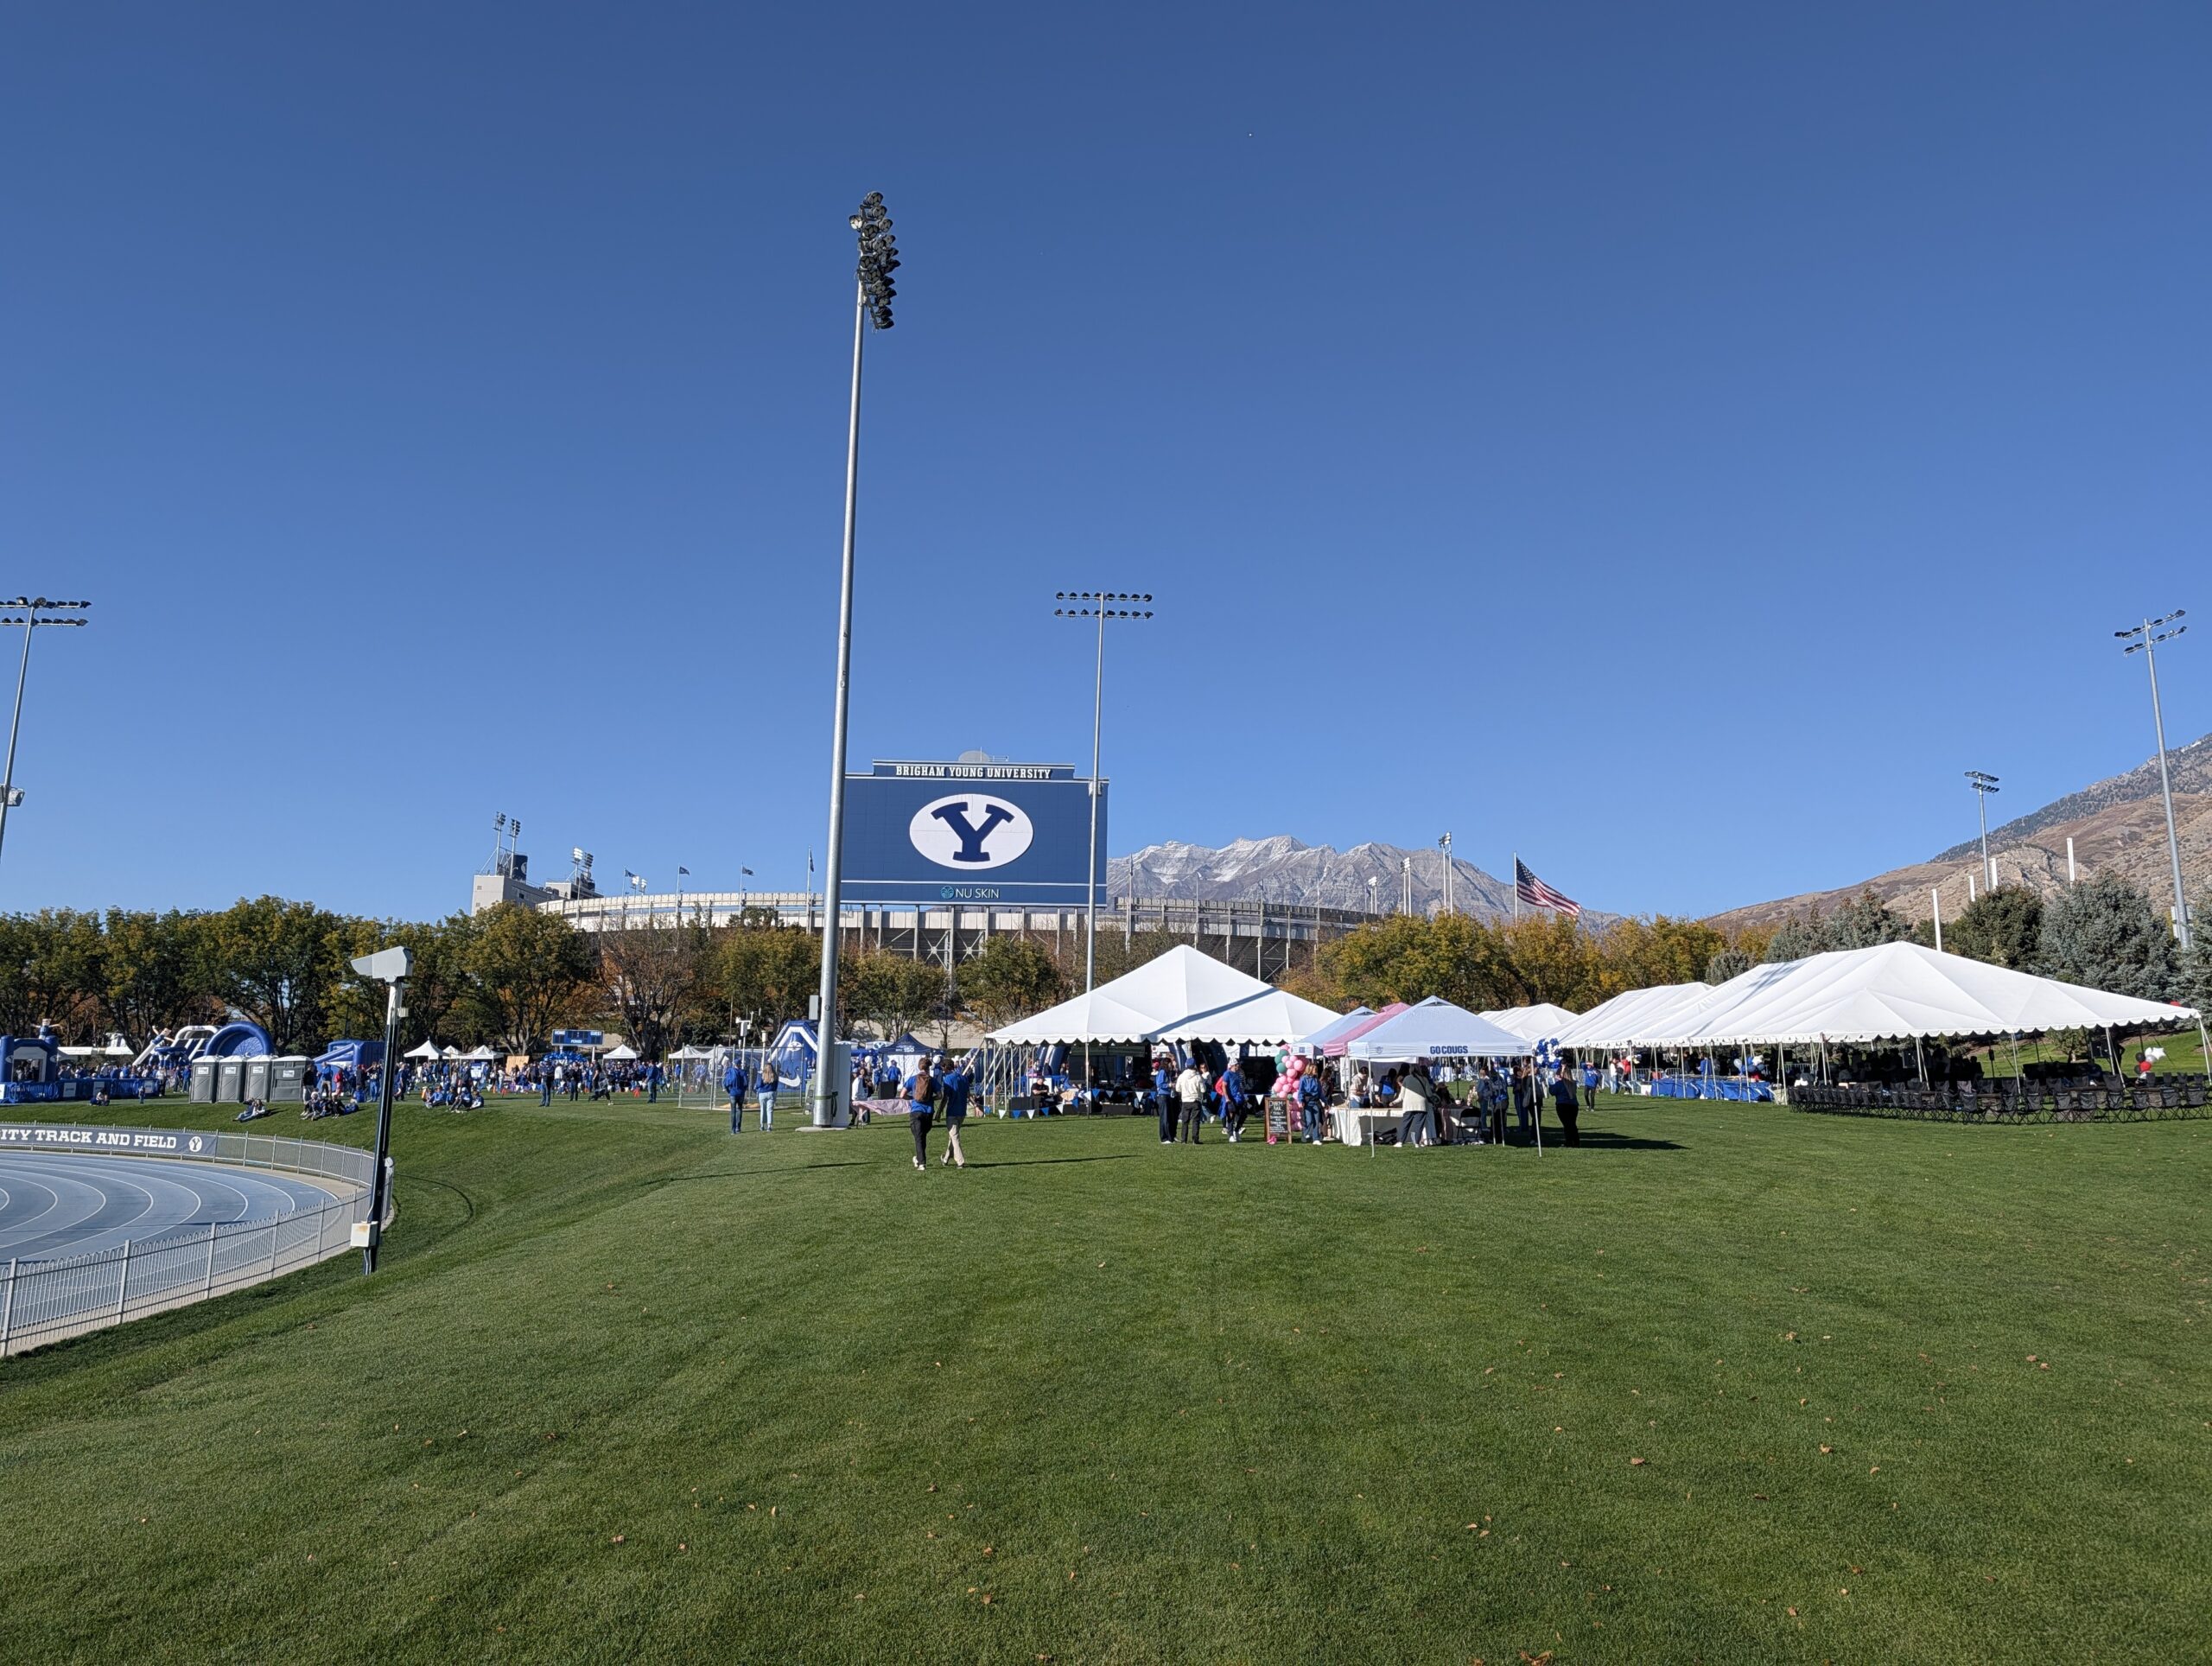
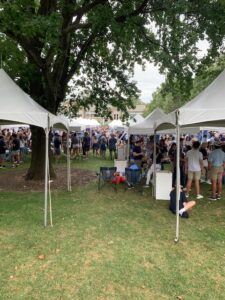

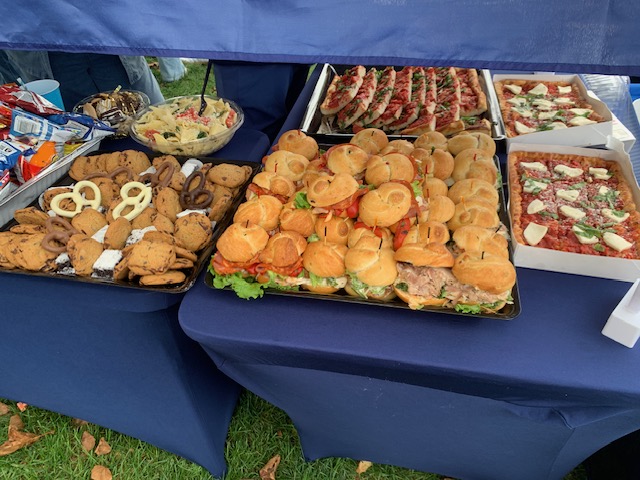
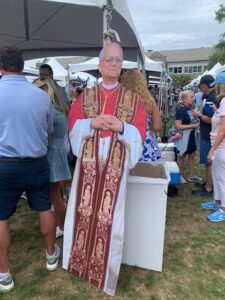
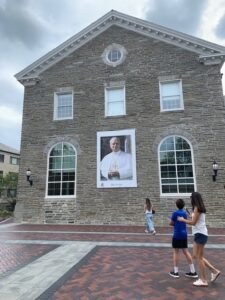
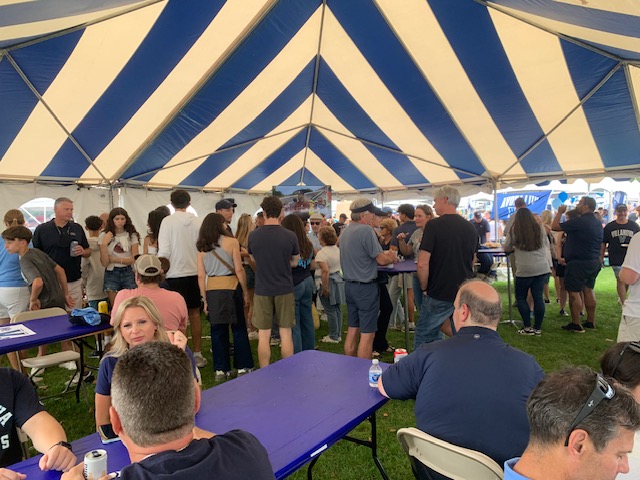

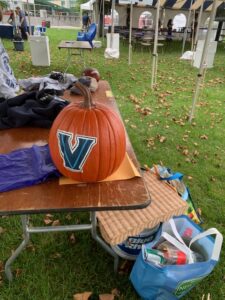
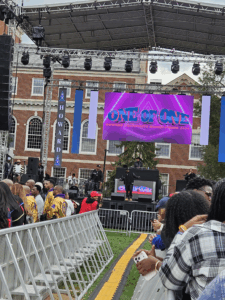
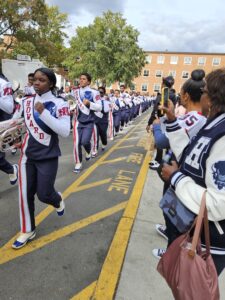
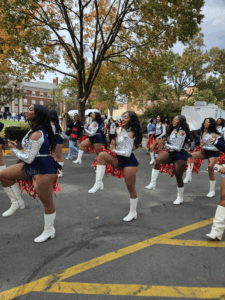
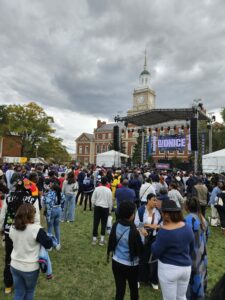

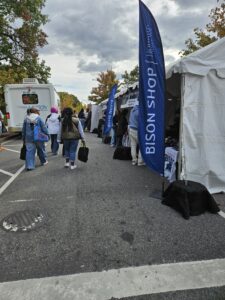
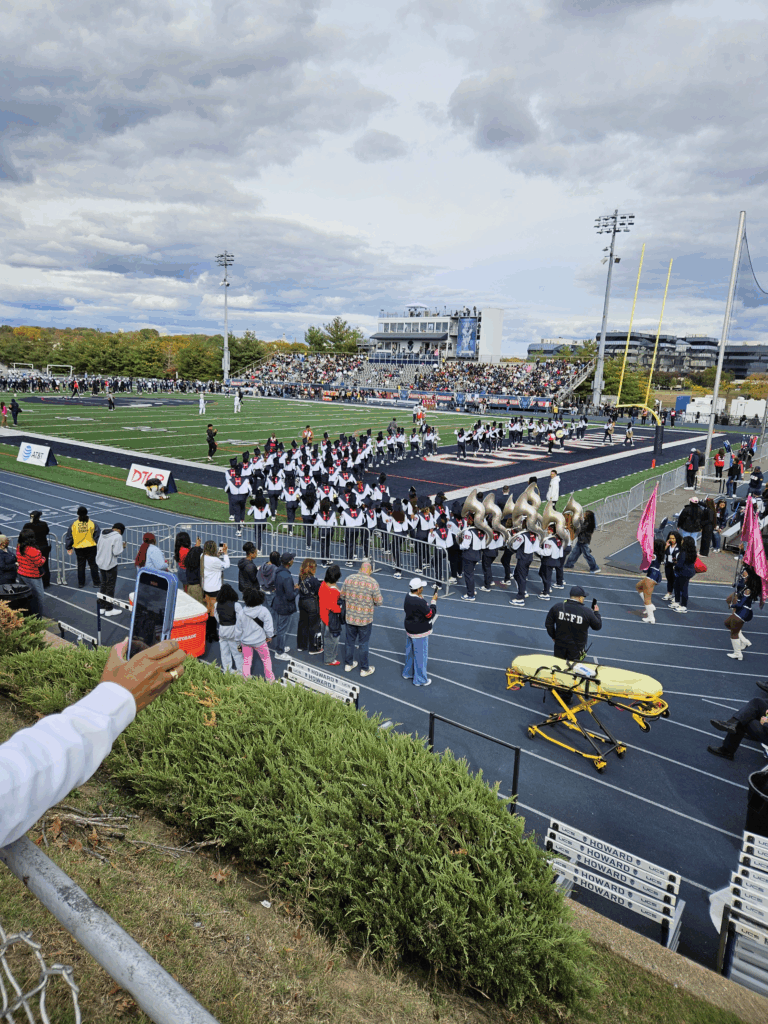
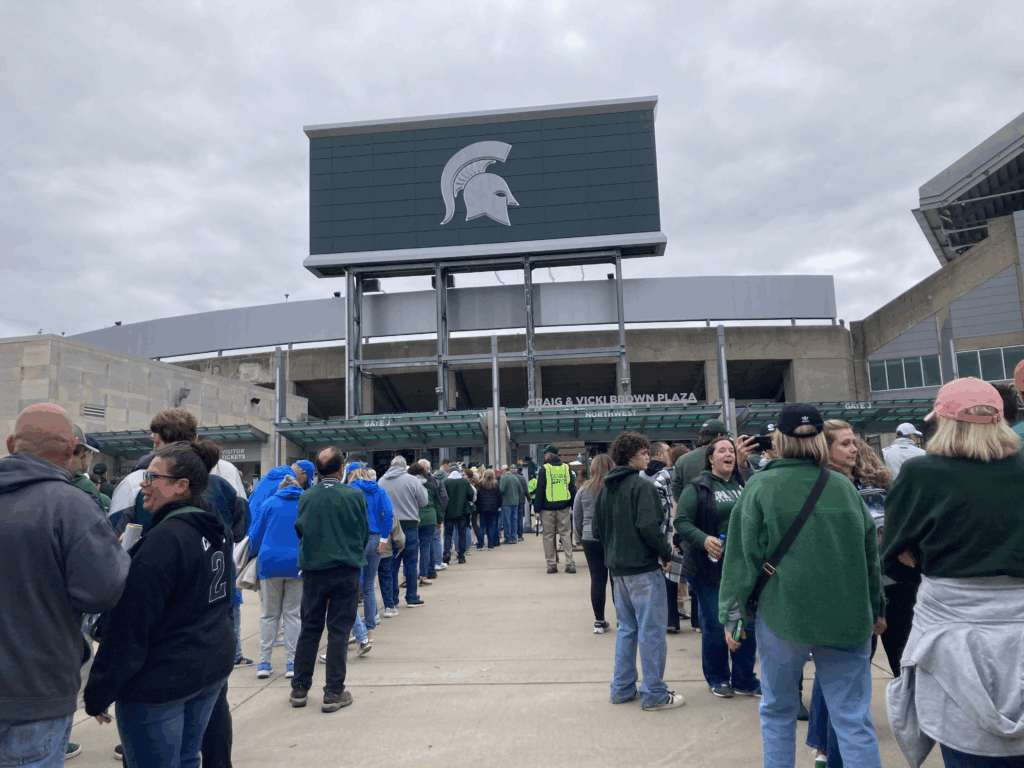
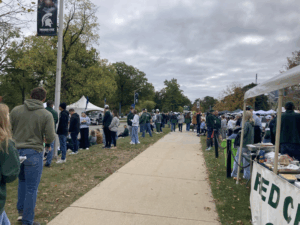

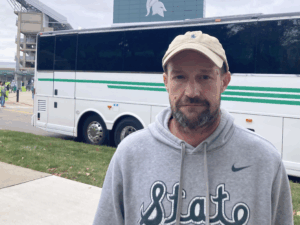
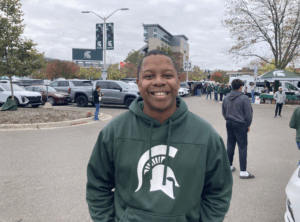
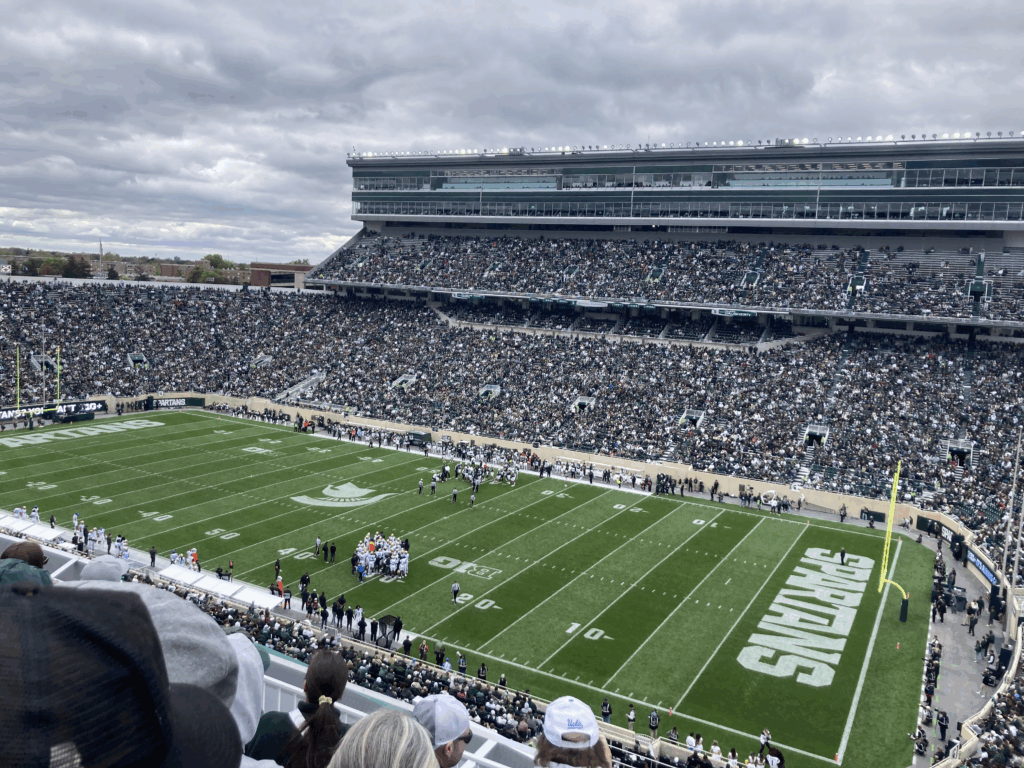

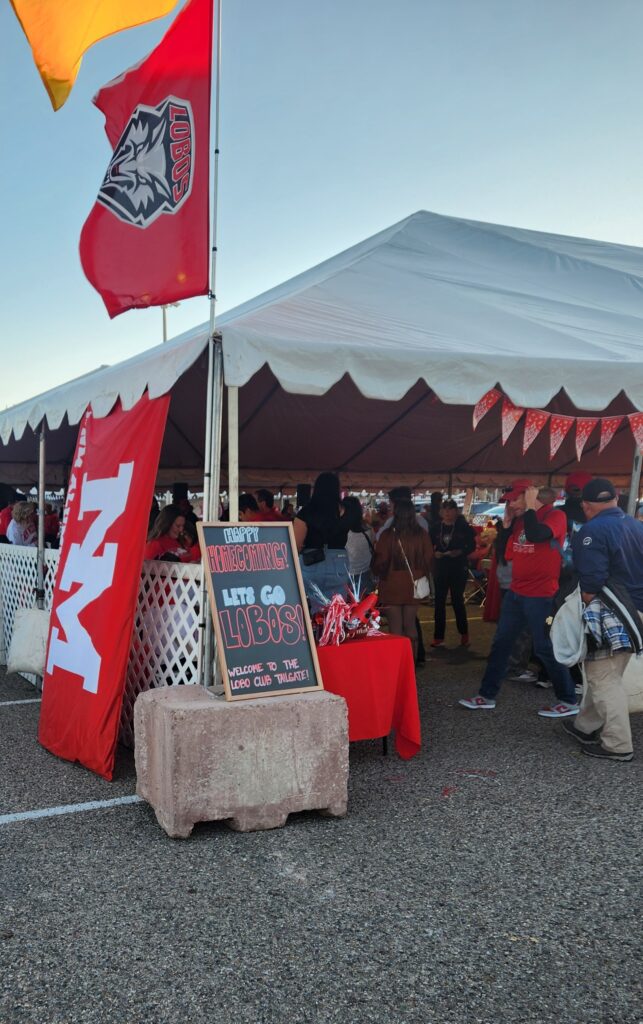

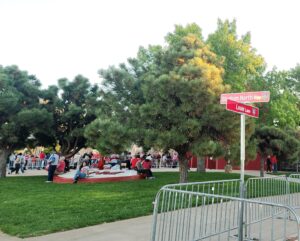
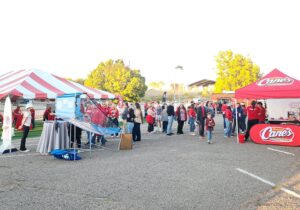
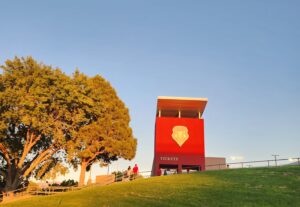
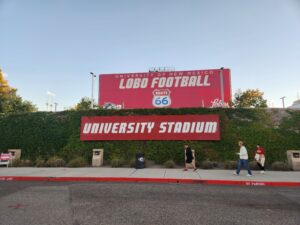


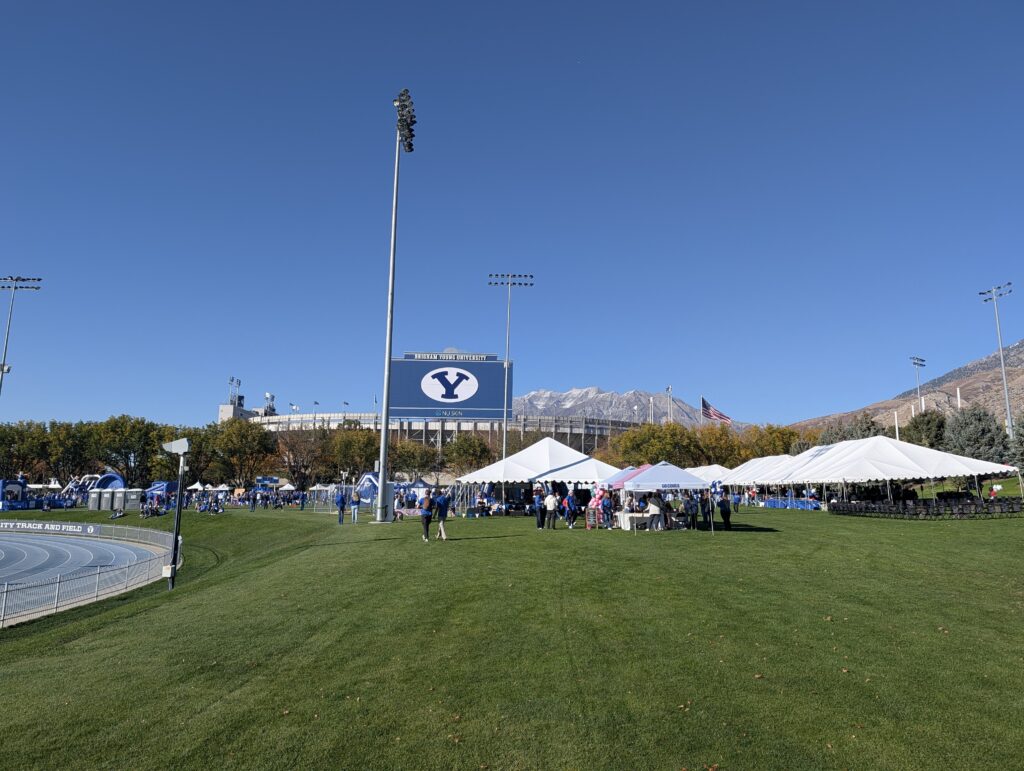

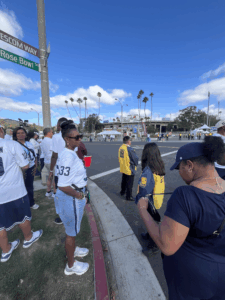
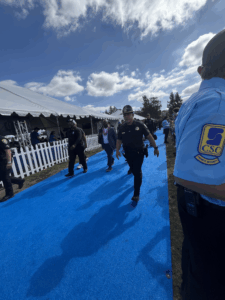
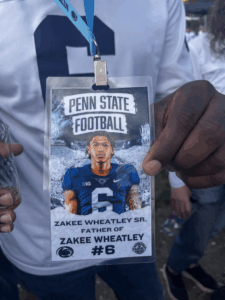

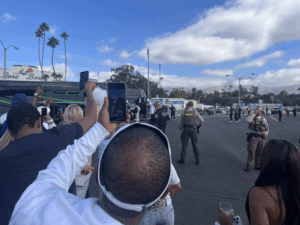
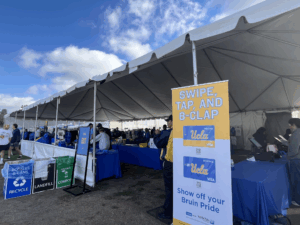
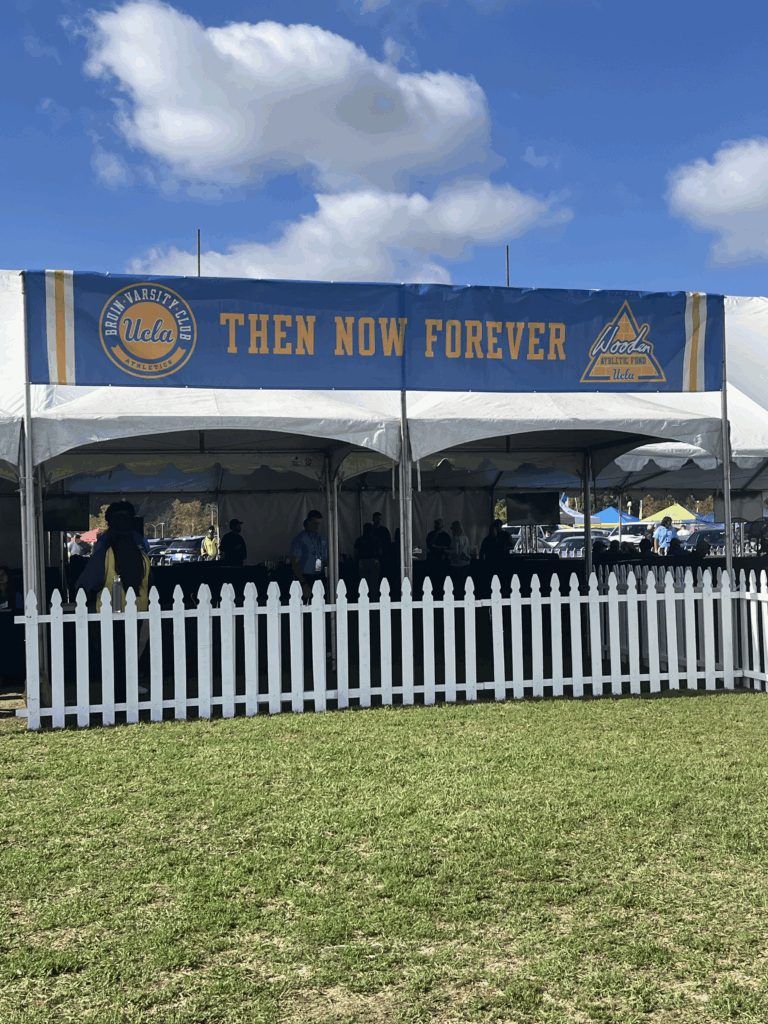
 Ari Pinkus is senior editor/writer/researcher and project manager at the American Communities Project.
 Theo
Theo 
 Allison Brennan is an Emmy-nominated freelance journalist and producer based in Livingston, Montana. Co-founder of 64 and Sunny Studios, Brennan worked for CNN and CBS News for a decade before she went out on her own. She now works with independent journalists and creators on their new endeavors and walks her four dogs along the Yellowstone River in her free time.
  Alex
Alex  Jenna Modica is a production assistant and freelance writer in Los Angeles with experience across indie films and large-scale production.
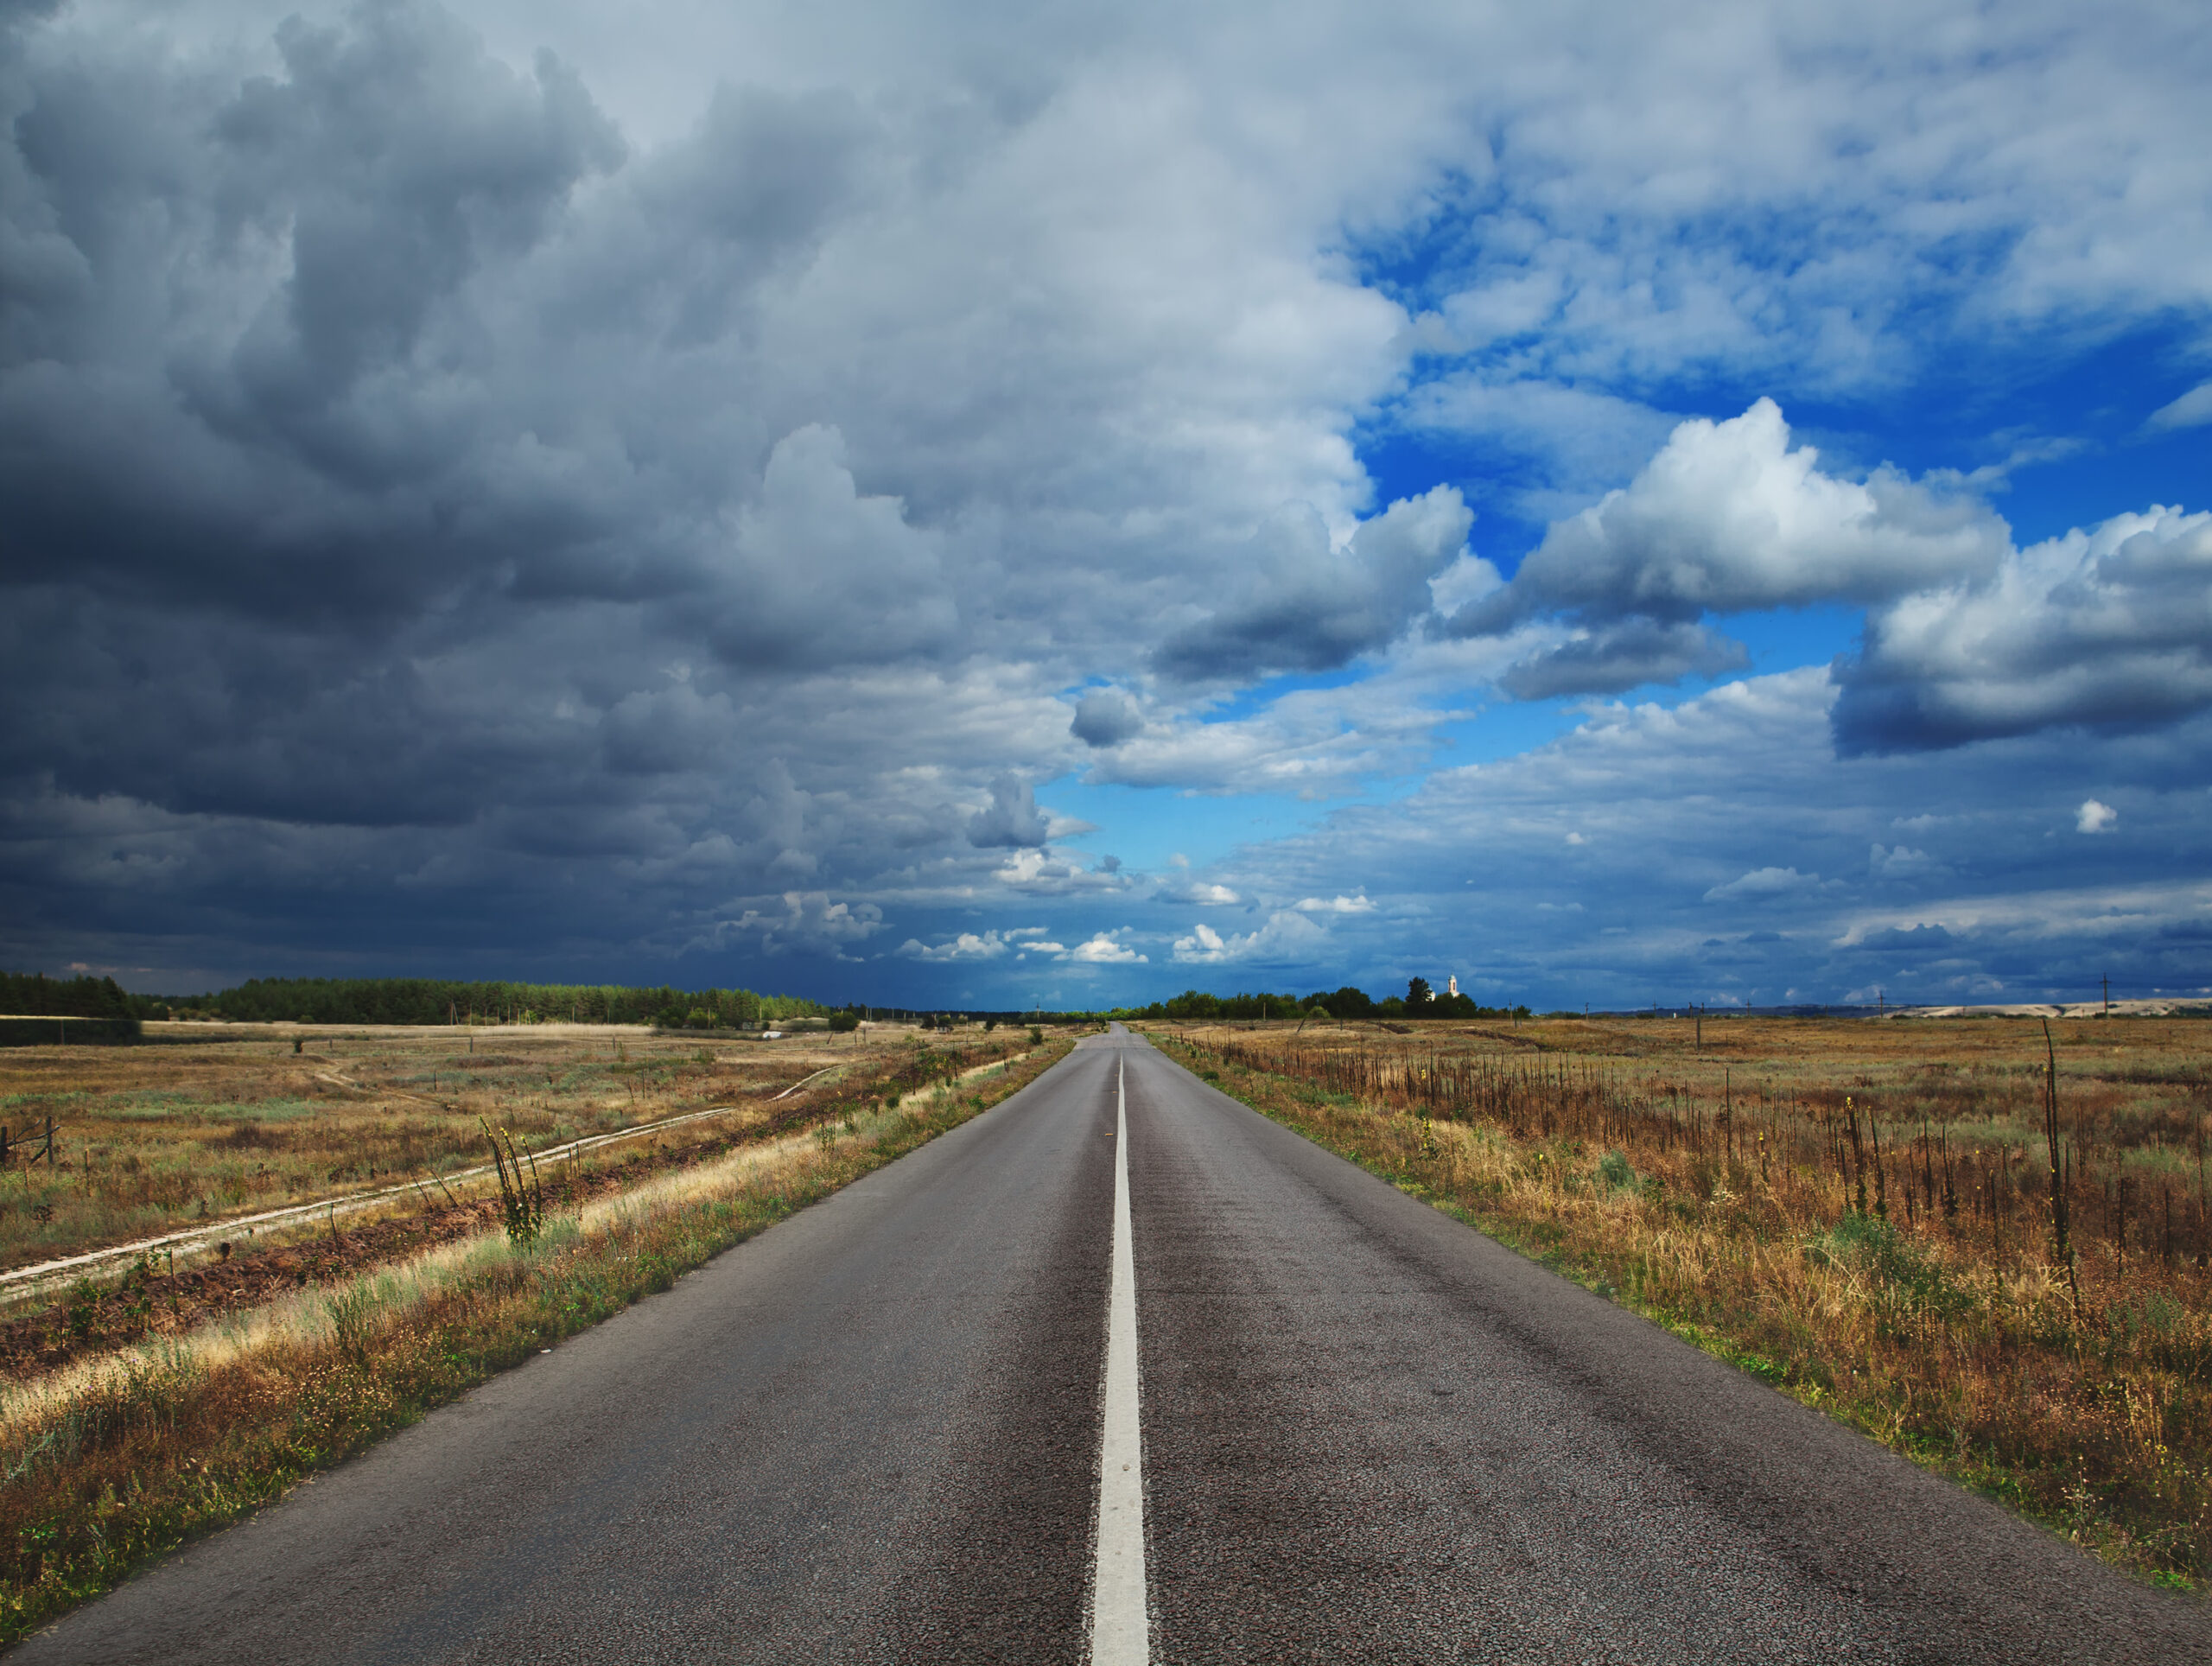
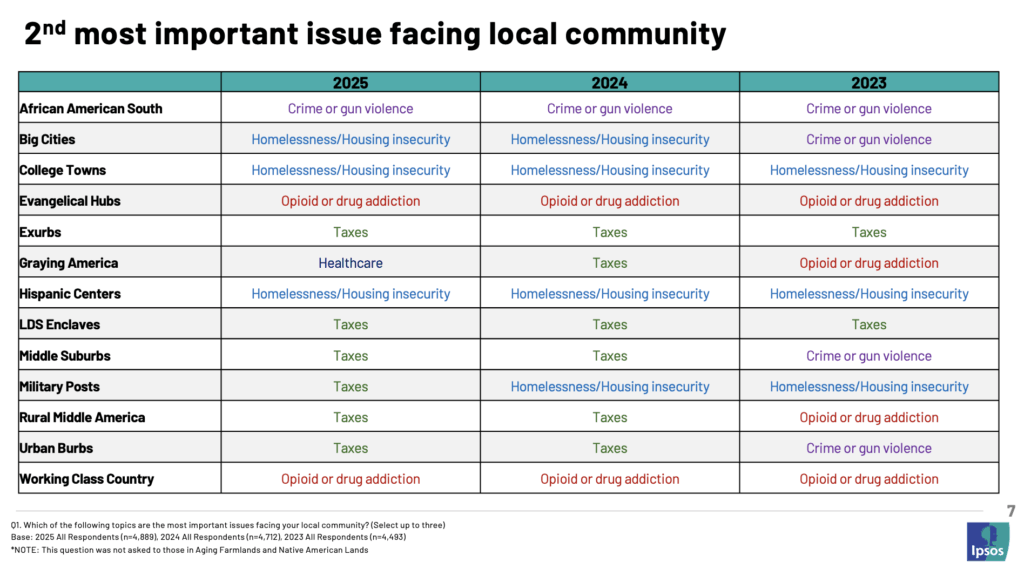

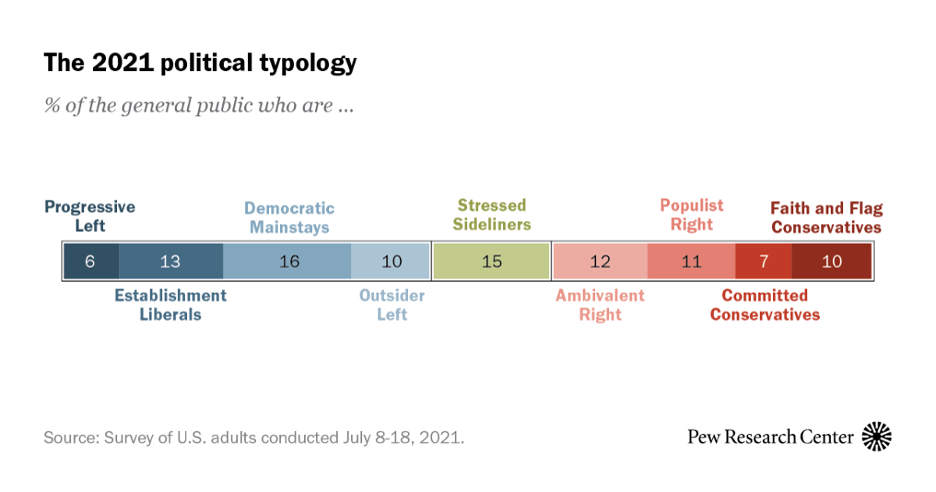
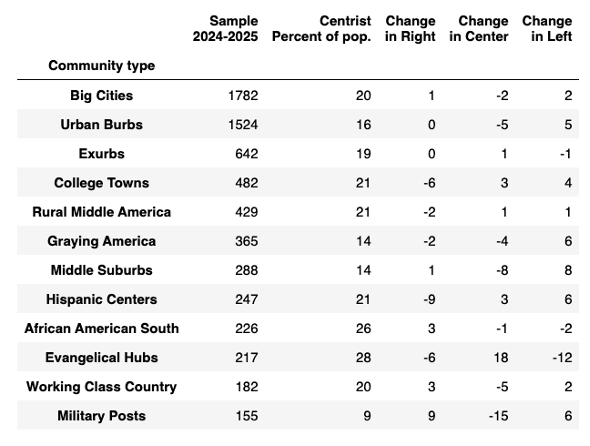
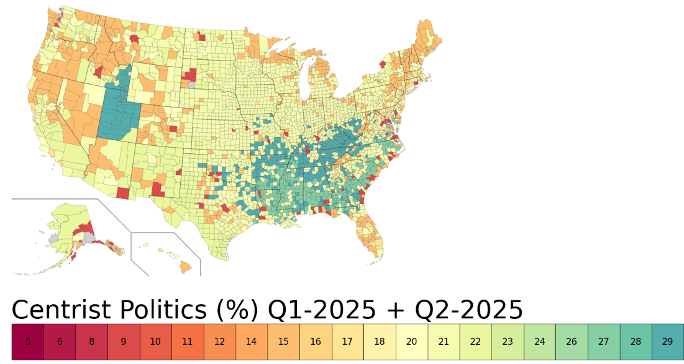
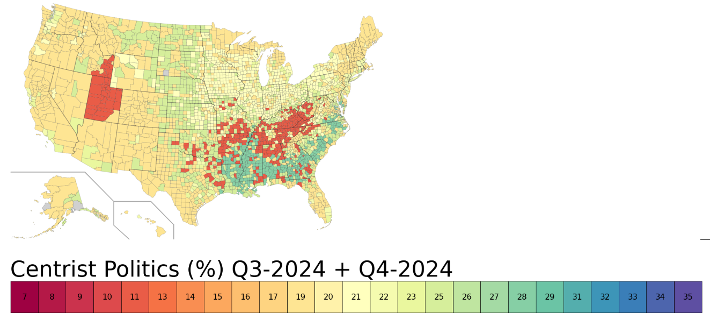
 Marc Maxmeister, Senior Data Scientist at GivingTuesday, helps organize and convert the world’s generosity data into meaningful insights into how giving works, and what organizations can do to improve the lives of people served. He brings context from mixed methods field research in Africa, rigor from his Ph.D. work as a molecular neuroscientist, and engineering from past AI-driven startups and nonprofits.