The American Communities Project/Ipsos third public opinion survey and subsequent reporting reveal continuing chasms and points of common ground across the country. This past year, we captured the changes in hope for the short- and long-term future of America; the key issues at the community and national levels over the survey series; Americans’ similarities and differences on a host of issues and identities; as well as their thoughts on and use of AI.
In the field, we amplified people’s views of college value, diversity programs, and AI in a series of college tailgates from coast to coast. We also sought to better understand the central challenges of particular communities: the federal immigration crackdown in Big Cities, homelessness and housing insecurity in College Towns and Big Cities, crime and gun violence in the African American South, political polarization in LDS Enclaves, and immigration and agricultural issues in Hispanic Centers.
Peruse the full slide deck of the third survey here. > ACP Topline October 2025 Year 3
Find snippets and links to the full stories from this past year below. Visit all the stories from the study’s first year, On the Fragmentation in American Society, and second year, On Americans’ Hopes, Fears, Perceptions, and Lived Experiences.
Editor’s note: The American Communities Project partnered with the Associated Press on the release of the survey. Click to visit the AP’s story on the findings.
Much has changed in the United States in the past year… and much hasn’t.
The new leadership in the White House has not only altered the partisan tilt of Washington but also challenged fundamental norms across the country down to the local level. There have been massive shifts in immigration enforcement and big moves in education funding. Tariffs and political tensions have risen. Tens of thousands of government workers have been let go.
And the American people have noticed the tumult, according to this year’s survey on the fragmentation in society from the American Communities Project. Across the 15 community types that the ACP studies, there are big differences in how people see the direction of the country today compared with 2024.
Yet for all the froth at the top of the American cultural/political scene, there is a more static set of concerns underneath. Worries about rising prices have not abated. Most Americans across the board still see a “rigged” economy. And there is a deep distrust for both political parties and the media.
Those two seemingly contradictory experiences — a country trying to handle dramatic change, while struggling with deeper unmoving problems — are behind many of the results in this year’s survey of 5,400 Americans, conducted by Ipsos and funded by the Robert Wood Johnson Foundation.
COMMUNITY PIECES BASED ON THIRD ACP/IPSOS SURVEY
May 19, 2026
DENISON, IOWA – You have to zoom in pretty close on a map of Iowa before this town of 8,300 pops into view. Denison, the seat of rural Crawford County, sits amid rolling hills about 70 miles northeast of Omaha, Nebraska, at the intersection of the U.S. highways 30 and 59.
But in a larger sense, this community sits at the intersection of two of the biggest issues of the 2026 midterms: tariffs and immigration.
You see a lot of tractors working the fields and rolling down country roads here, but you also see a lot of signs in Spanish. Crawford occupies a special place in the United States, a deeply agricultural county in the rural Midwest that is one-third Hispanic or Latino.
It’s classified as a Hispanic Center in the American Communities Project rubric. In the ACP’s 2025 survey, residents in Hispanic Centers were more likely than the nation as a whole to think recent changes on immigration and tariffs were net negatives for their community.
May 11, 2026
As I noted at the beginning of this look back at a wrenching year for Los Angeles, the dramatic, destructive, and expensive fires were not the only big events of 2025. President Trump had railed against Los Angeles and other cities as dirty, and dangerous. Soon after his January inauguration, the President activated National Guard troops, and sent them into American cities on patrol. Los Angeles was, if you will, a demonstration project. When 4,000 Guardsmen and -women, and 700 U.S. Marines hit the streets in the spring, they were met with weeks of protests, lawsuits, and steady opposition from state and local politicians.
April 13, 2026
On a recent Tuesday night, a man in a rumpled suit paced in the back of a small, carpeted room, nervously smoothing back his hair as he watched the scene in front of him.
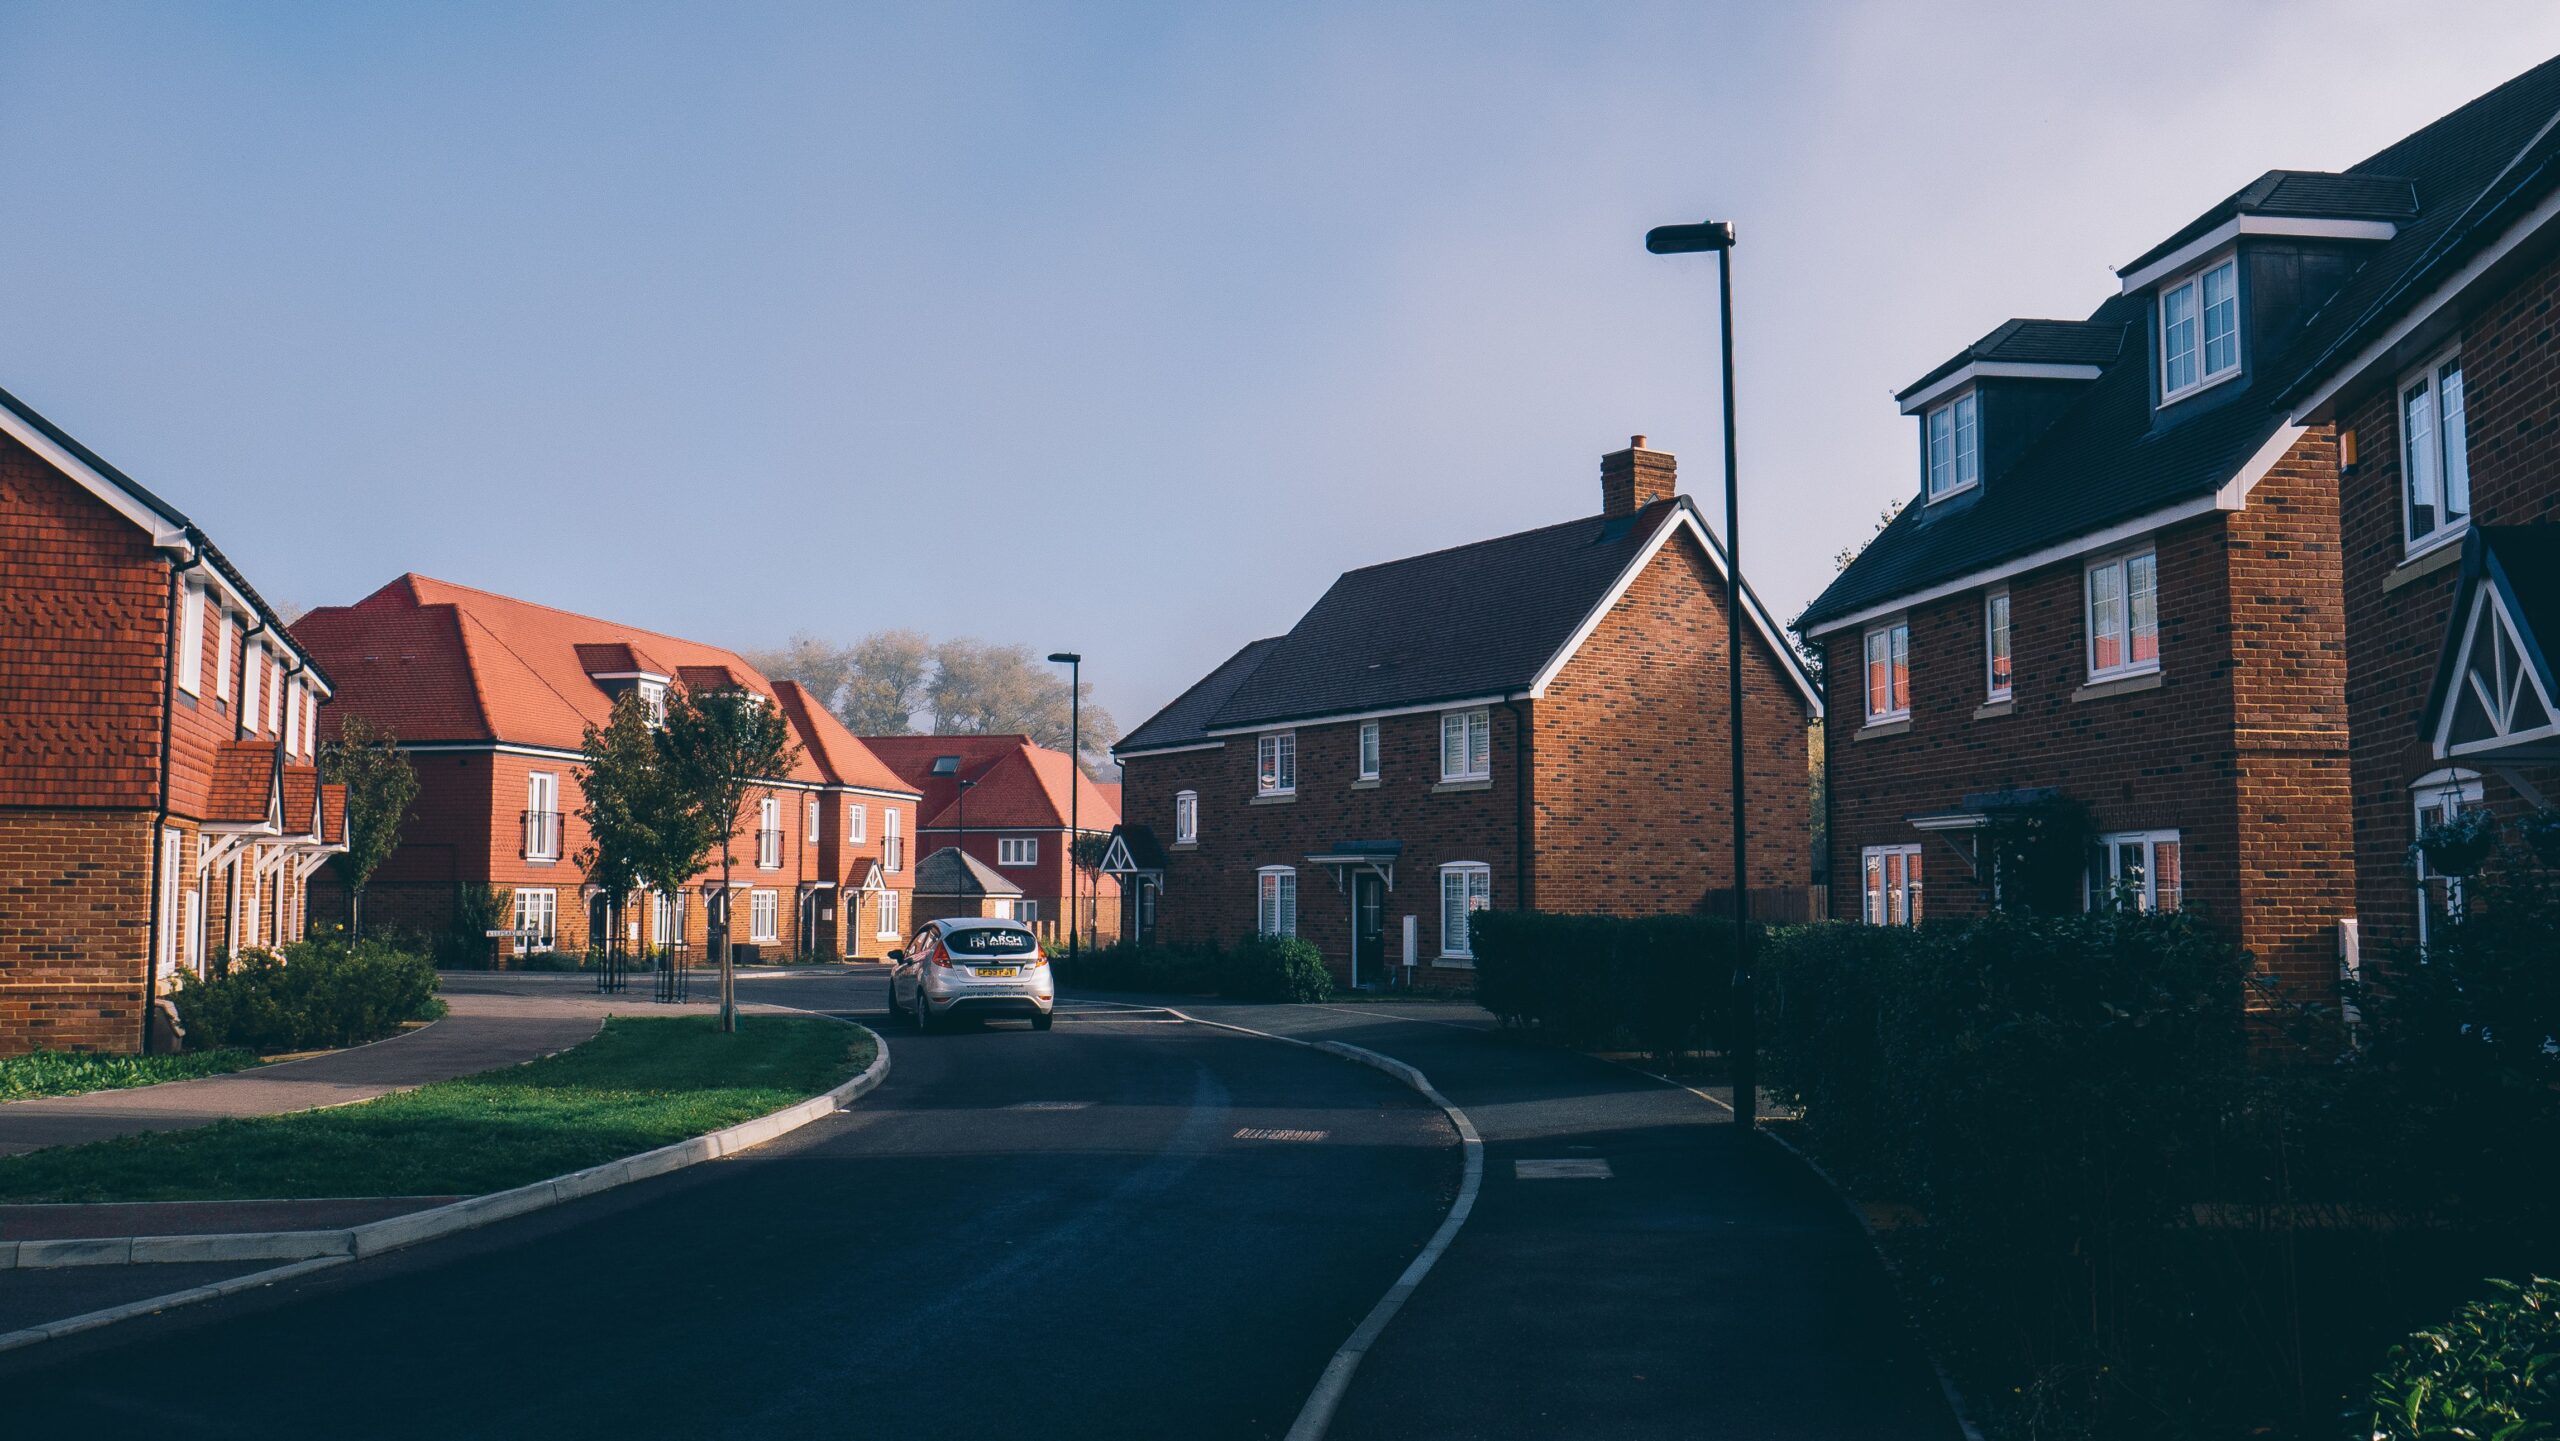
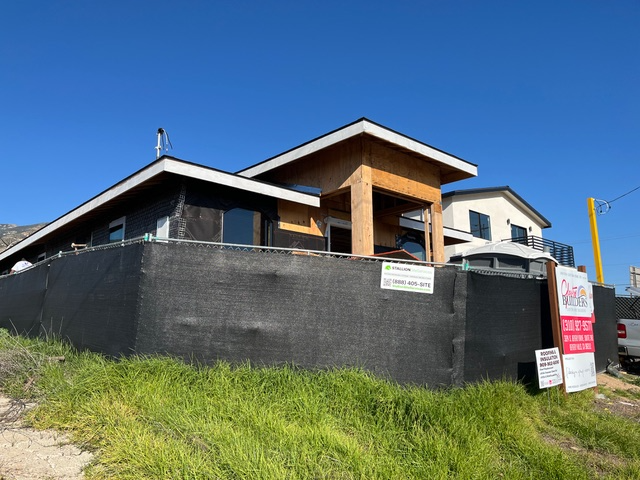
He was one of several unhoused people from Lansing, Michigan, who had traveled that night to a high-school-turned-community-center in the college town next door. Bringing him to East Lansing — as well as dozens of community members and multiple camera crews — was a prickly and ever-present subject for the entire region: housing.
In contention were two ordinances that critics say criminalized the homeless, and another to approve the construction of a new apartment building.
Other measures were on the East Lansing City Council’s agenda as well, but none had them quite as incensed as these. Surrounding Lansing, where 648 people experienced homelessness on a given night in 2024, it’s an issue that strikes a chord.
April 6, 2026
Clustered in a belt running from Virginia down through Texas, the African American South is home to a relatively small population of 13 million people in 272 counties, just about 4% of the nation’s population. Yet residents in these small, mostly rural counties rated crime or gun violence as one of the top two issues facing their local community for the past three years, according to the American Communities Project/Ipsos survey series taken in the summers of 2023, 2024, and 2025. It was the only community type to do so.
March 31, 2026
From early 2025 into early 2026, the Los Angeles basin has lived through a year locals may never forget. It began with devastating fires that destroyed most of two big communities: Pacific Palisades and Altadena. It continued with National Guard on the streets of Los Angeles, sent by the new Trump administration to respond to what it said was an ongoing emergency. Then communities throughout the metropolitan area felt the rising impact of the U.S. Immigration and Customs Enforcement agency.
You have to scratch a little to see the various impacts, because the enormity of the region can easily obscure the enormity of the challenges.
March 24, 2026
Drive through the sprawling, manicured suburbs of Utah County, and the American political crisis feels like a distant rumor. Framed by the towering Wasatch Mountains, the neighborhoods here project an image of pristine, impenetrable harmony. Neighbors wave across pristine lawns, church parking lots overflow on Sunday mornings, and the culture maintains a deep, collective emphasis on family and community.
Yet, beneath this tranquil surface, the data reveals something more complicated.
In its third annual survey on the fragmentation of American society, the American Communities Project and Ipsos released findings that highlight a striking paradox within communities boasting large populations of members of the Church of Jesus Christ of Latter-day Saints (Latter-day Saints for short and formerly called Mormons), categorized as “LDS Enclaves.” When asked to identify the most important issues facing the nation, 39% of respondents in these communities pointed to political polarization and extremism — a statistically significant leap from the 27% reported by the population overall.
November 24, 2025
This year has been searing for U.S. colleges and universities — from grappling with federal funding cuts to rancor over diversity programs to the ultimate value of college amid an affordability crisis and the rise of AI.
Still, most people said a college degree is somewhat or very important for a good life, according to the American Communities Project/Ipsos American Fragmentation survey of some 5,000 Americans conducted in August 2025. There is some variance at the community level, with a high mark of 87% in the diverse and densely populated Big Cities, full of white-collar professionals.
In the very rural communities, residents see the value differently: 53% in Native American Lands and 31% in Aging Farmlands said, “Earning a bachelor’s degree is important to a person’s ability to have a good life.”
DATA-DRIVEN ARTICLES BASED ON THIRD ACP/IPSOS SURVEY
April 27, 2026
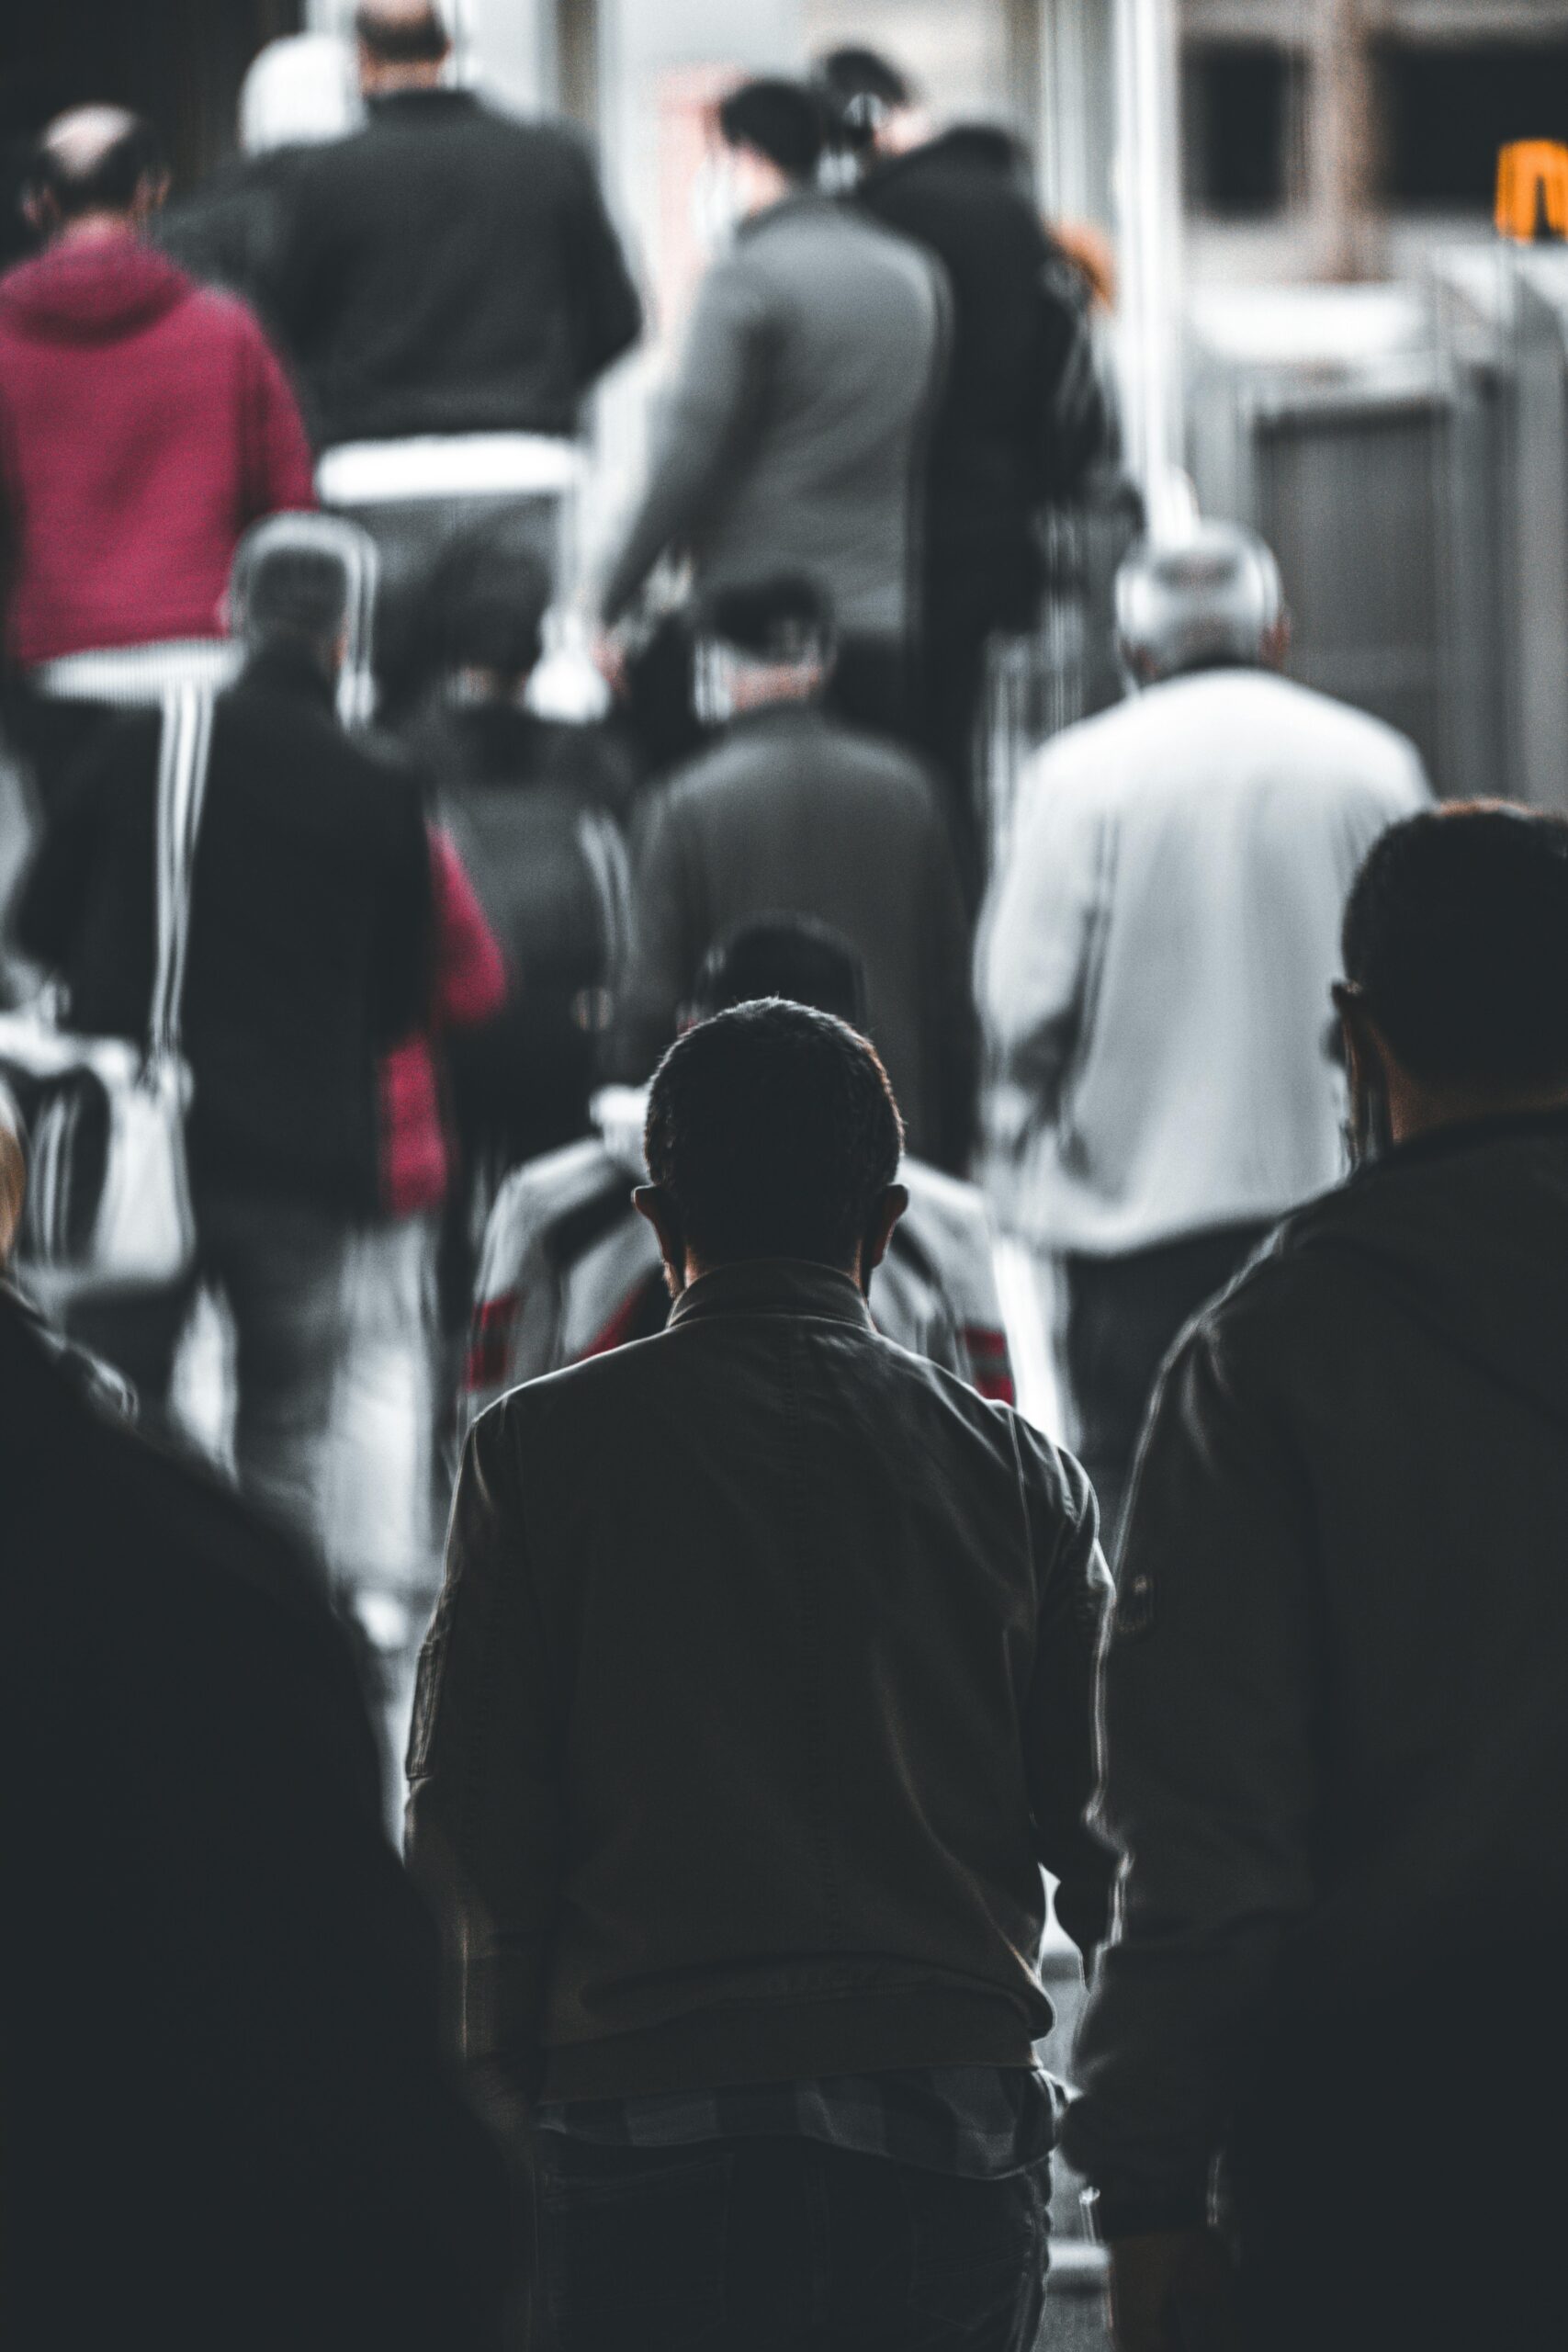
In 2026, the United States is a study in contradictions.
In many ways, the nation’s population has never been more diverse or fragmented — in race and ethnicity, in faiths represented, and in languages spoken. Politically, it is deeply divided. And economically, the disparities between rich and poor, measured by tools like the Gini Index, are at or near all-time highs.
Yet, data from the American Communities Project finds that people say their friends and neighbors are quite similar to them. On important measures at the local level — politics, economic status, religious practices, and educational attainment — people don’t seem to feel divided at all. Rather, they seem to feel at home among kindred spirits.
That dichotomy — national diversity and local homogeneity — may be at the center of the deep divisions in the country and a big reason why they will likely be difficult to overcome.
February 23, 2026
It’s easy to look at national headlines, and the stories under them, and see a hopeless blue/red political chasm. But that isn’t completely true.
A close look at survey data from the American Communities Project shows there are some issue areas that seem to unite the right andthe left as the nation hurtles through a midterm year, and the force behind them seems clear: anti-establishment populism.
Distrust of elites and “the powers that be” has become a defining part of the MAGA movement that supports President Donald Trump. But ACP survey data indicate that on a range of issues — from the media to the government to big business — distrust reigns supreme in all kinds of communities, from liberal-leaning Big Cities to conservative Aging Farmlands.
February 11, 2026
There is almost always an adversarial relationship between the White House and the news media, but tensions have ratcheted up under the Trump administration — from requiring special rules for news organizations in the Pentagon to the recent arrests of two journalists covering a protest in a church in Minneapolis.
As the debates heat up over the First Amendment, media organizations face a special set of challenges with the public, according to the American Communities Project/Ipsos surveys.
- First, very few Americans say they actually know a working journalist. Journalists ranked at the bottom of a long list of professionals and/or groups that people know well.
- Second, most people believe the mainstream media are more interested in “making money than telling the truth.
January 27, 2026
Fifty years ago in February, President Gerald Ford observed Black History Month thus: “In the bicentennial year of our Independence, we can review with admiration the impressive contributions of black Americans to our national life and culture…. The last quarter-century has finally witnessed significant strides in the full integration of black people into every area of national life.”
On the cusp of the nation’s 250th anniversary, race remains a central fault line in American society that continually runs through public opinion polls. In the summer of 2023, the American Communities Project and Ipsos asked 5,000 survey respondents if they agreed or disagreed with the statement: “Racism is built into the American economy, government, and educational system.” Nearly half, 48%, said they agreed.
Two years later in the most recent poll by ACP/Ipsos, 47% of 5,000 respondents agreed. Nationally, these results are among the most discordant in our survey series, but they do not convey the full picture. Also, as with all polling, this shows a snapshot in a turbulent time.
January 06, 2026
Of all the Trump administration’s changes in the last year, those around immigration and immigration enforcement are probably the most immediately felt. Stories about arrests and detentions are all over national and local news outlets around the country.
The 2025 American Communities Project survey suggests there may be concerns about how far those new immigration policies are going.
On the survey, 59% of respondents said, “Immigrants who entered the U.S. illegally, but have been working community members for at least ten years, should be given a pathway to legal status.” In a country that feels deeply divided, that number is surprisingly high. And the response may fly in the face of the administration’s efforts to remove 1 million undocumented immigrants a year during Trump’s presidency.
December 22, 2025
Even as millions gather to mark religious holidays in public and private spaces this month, the role of religion and faith in America remains a point of stark disagreement. In the latest ACP/Ipsos survey of 5,400 respondents, just over half (56%) said, “Religion and faith are important parts of American life.” But the variance at the community level ranged 34 points — and emphasized the country’s rural-urban divide on a signature sociocultural issue.
In very rural communities of moderate to low means, Aging Farmlands and Native American Lands, more than 75% of residents said religion and faith are important parts of American life. For Evangelical Hubs and Working Class Country, rural communities with lower-incomes based in the South, Midwest, and Appalachia, the figures were in the mid-60s. In middle-income rural communities in the country’s upper tier and interior West — Rural Middle America and LDS Enclaves — 59% of residents said religion/faith was important in American life. In African American South and Military Posts, known for their large Black populations, 57% and 52% of residents said so. On the opposite end of the spectrum were urban-oriented places: Big Cities, Urban Suburbs, and College Towns. Characterized by higher density, affluence, economic stratification, and many cultures, these communities were in the mid- to upper-40s.
December 16, 2025
President Donald Trump is a deeply divisive political figure in the United States — loved by some, loathed by others — but American Communities Project’s 2025 survey made one point clear: He has the nation’s attention.
The ACP/Ipsos survey of more than 5,000 people asked five factual true/false questions mostly around the Trump administration’s policies and impacts, on everything from tariffs to immigration to the president’s “big beautiful bill.” And large numbers of people got the answers correct in all 15 community types we examine.
December 11, 2025
The latest American Communities Project/Ipsos survey of 5,400 respondents continues to paint a very bleak picture of how Americans across geographies see the traditional news media in society and the role it plays in their daily lives.
NOT PAYING FOR NEWS
In new items in the survey series, ACP/Ipsos found that paying for news is not at all popular regardless of where people live. The survey asked if they paid for a local news source, national news source, and content from individual creators. Some may pay for multiple sources. Overall, 15% nationally said they paid for a local news source in the last six months, while 10% said they paid for a national news source in the same time frame. Individual creators are breaking through the din and picking up subscribers. Nationally, 10% said they paid for content from individual creators in the last six months.
December 08, 2025
A perception schism exists over the degree to which “crime or gun violence” is a major national problem, according to the newest ACP/Ipsos survey of 5,000 people conducted in the late summer.
Lately, media coverage of crime in America has been relentless, from mass shootings to politically targeted assassinations. A notion of out-of-control crime has been the Trump administration’s reason for deploying National Guard troops to Los Angeles and Washington, D.C., this past summer and its effort to expand deployments to other cities this fall.
However, crime/gun violence is not seen as a significant national problem among residents living in most areas of the U.S. The one exception is the African American South, where real crime numbers have been higher than many places. Just above one-quarter of residents (27%) rated crime/gun violence as a top-tier national issue in the ACP/Ipsos survey. The concerns and challenges seem different here.
December 02, 2025
The nation’s affordability crisis is not new. For the past three years, the American Communities Project has surveyed the country and found that inflation has been the No. 1 issue in all 15 community types we study.
But the concerns take on a special meaning this time of year, with Thanksgiving over and a lot of retailers nervous about how the next few weeks are going to go.
Judging by the 2025 American Communities Project survey, it may be a tough holiday season across the United States, but particularly in communities with larger Black and Hispanic populations as well as some rural blue-collar communities.
‘SERIOUS FINANCIAL PROBLEMS’
The 2025 survey of 5,000 Americans found that 30% had experienced “serious financial problems caused by recent price increases” in the last year. But the numbers were even more pronounced in some types of communities.

 Victor Wooddell is a graduate student in the Journalism program at Michigan State University. After earning an earlier degree in psychology at Wayne State University, he became a human resources manager, a nonprofit management consultant, and a college instructor. He has published articles with the Lansing City Pulse and many regional papers around Michigan, including the Detroit Free Press.