The Meaning of Demographic and Voting Trends in a Changing Pennsylvania
Political polling generally offers snapshots of political leanings at the individual level, as aggregated by a handful of personal demographic characteristics. So, we hear about how “Black women” or “Republican men, aged 18-34” or other groups are feeling about a politician, party, or issue at a point in time. While this has its uses, it cannot tell us much about the interactive social milieus within which political action happens. In contrast, deep reporting or political ethnography can give us insights into how political perspectives and practices develop and change within communities or regions. But extrapolating from that nuanced portrait becomes complicated: There’s no automatic answer to the question of which places that thick description can be generalized to.
The American Communities Project offers a useful complement to other kinds of political analysis. By aggregating electoral results for counties that share common demographic and social features, we can analyze political change in a way that is attuned to the importance of place. In spring 2023, the ACP released updated county classifications, using 31 variables in a new cluster analysis (with the help of Michigan State University Professor Matt Grossman), based on survey data from 2016-2020.
In my home state of Pennsylvania, for example, the new classifications show two major, divergent stories of population movement and demographic change unfolding. Both the Lehigh Valley and South-Central Pennsylvania are becoming more like the southeast Pennsylvania collar counties in their demographics, while Southwest Pennsylvania outside of Allegheny County is becoming more demographically similar to the rural counties of northern and central Pennsylvania. These underlying shifts are reflected in the counties’ voting trends.
Here’s a way to think about the bigger picture: As the legacy similarities created by the mid-20th century manufacturing boom fully fade, Pennsylvania counties at different ends of the state are looking ever more similar to the parts of the Mid-Atlantic, Great Lakes, and Appalachian regions nearest to each — and less similar to one another.
Pennsylvania Counties’ Shifting Categories
In the ACP’s 2023 update, four counties moved into categories characterized by higher education, income, and density, and more young people. The aggregate population? 1.5 million people.
- Northampton and Lehigh are now Urban Suburbs; and
- Lancaster and Cumberland are now Exurbs.
Meanwhile, four counties moved into the Rural Middle America category from either Working Class Country (Warren and Greene) or Graying America (Huntingdon and Carbon): total population, 183,000. Again, that reclassification reflects demographic data that by 2020 look a little less old, a little less stagnant, and a little less poor than a decade before.
All eight of these counties are shaded blue on the map below, with the intensity of the color gradated by the size of the county’s population.
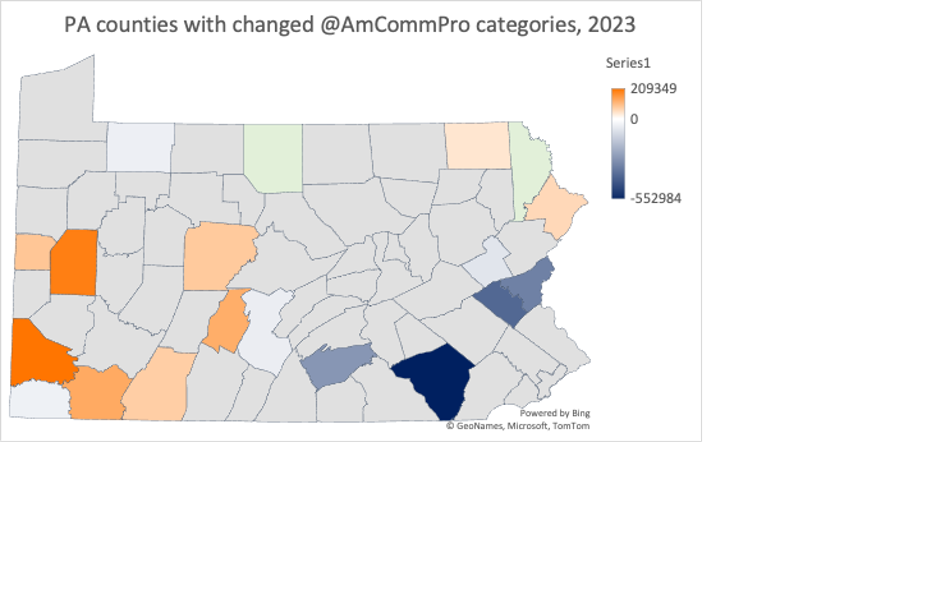
In contrast, nine PA counties were reclassified into categories defined by lower education, income, and density, and older populations.
- Washington, Lawrence, Butler, and Blair were reclassified from Middle Suburb to Rural Middle America;
- Somerset, Clearfield, and Fayette from Rural Middle America to Working Class Country;
- Susquehanna from Rural Middle America to Graying America; and
- Pike from Exurb to Working Class Country.
These nine counties are shaded orange above, again with the intensity of the color reflecting the size of the population. The total population encompassed is 992,000 — which is a lot, but also, a lot less than 1,500,000.
Meanwhile, Wayne went from Working Class Country to Graying America and Potter did the opposite: These two are tagged in pale green on the map.
The overall impact of the recategorizations is that the portion of Pennsylvanians who reside in counties labeled Urban Suburb or Exurb has risen, while the number of people living in Middle Suburb counties has fallen. Meanwhile, the total population residing in counties labeled Rural Middle America has remained the same, even though exactly which counties fall into that category is somewhat different than before.
Effect on Voting Trends
Voting patterns in the counties whose demographic shifts have led to recategorization have been showing those underlying pulls. Look at the results of the 2022 gubernatorial race in five sets of counties:
- counties categorized as Rural Middle America, Middle Suburbs, and Urban Suburbs that remained in those same categories;
- counties that had been Middle Suburbs but were reclassified as Urban Suburbs; and
- counties that had been Middle Suburbs but were reclassified as Rural Middle America.
In the counties whose classification shifted from Middle Suburbs to Urban Suburbs, Democratic gubernatorial candidate Josh Shapiro indeed did better than he had in the rest of the Middle Suburbs, although not as well as he did in the rest of the Urban Suburbs. And in the counties that shifted from the Middle Suburbs to Rural Middle America, Shapiro indeed did less well than he had in the rest of the Middle Suburbs, but not as poorly as he had in the rest of the Rural Middle America counties.
If we zoom out from the map a bit, the larger picture is clear. South-Central Pennsylvania and the Lehigh Valley are becoming part of what we can think of as the Greater Acela Corridor. The rest of the state is looking increasingly like the rest of the Greater Great Lakes: largely rural, with pockets of density and prosperity. And in the corner along the WV/MD border, PA looks like the northern edge of Appalachia, which it is.
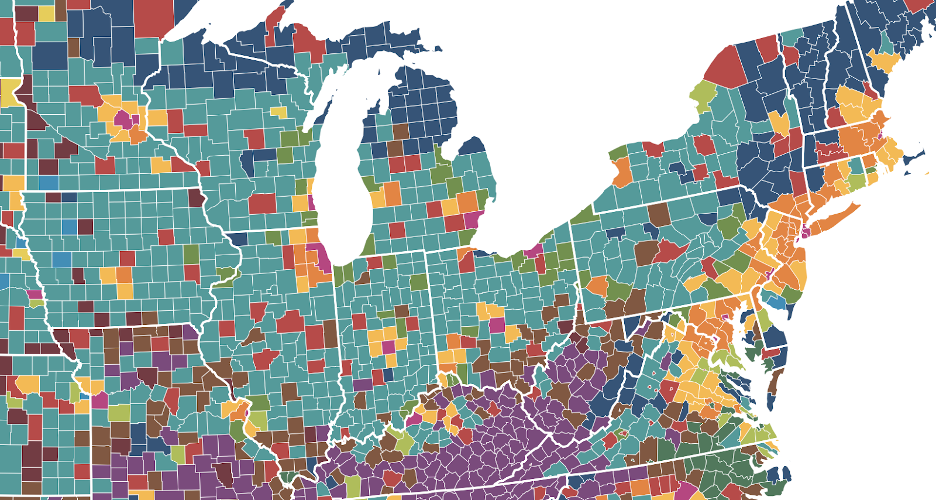
There will be lots of references to “red states,” “blue states,” and “purple states” in the coming months. The many colors of the map above — and awareness that those colors change over time, as underlying demographic and cultural attributes shift — can help build a better mental map than that.
Underlying demographic and socioeconomic patterns are important drivers of political trends. That doesn’t mean issues and campaigns don’t matter. This point is exemplified by the difference between Pennsylvania’s statewide judicial elections in 2021 (the Covid and Culture-War backlash election) and 2023 (the Dobbs backlash election).
The chart below underlines just how broad-based the Democrats’ improvement (aka the Republican decline) from 2021 to 2023 really was. Of Democrats’ net improvement:
- 25,000 came from decreasing the deficit in Rural Middle America counties,
- 38,000 from increased turnout in Big City Philadelphia,
- 41,000 from decreasing Democrats’ deficit in the Middle Suburbs,
- 66,000 from flipping the Exurbs from net loss to net gain, and
- 87,000 from hyper-charging the already strongly Democratic Urban Suburbs.
This is a crucial reminder that issues — like new threats to abortion care — can change political dynamics, and also that issues can impact different kinds of communities to different degrees, with distinct electoral results.
Leveraging the Shifting Landscape
Demography isn’t destiny — but also, demography really does matter.
Meanwhile, the underlying demographic and socioeconomic patterns themselves are not set in cement. They change over time, in visible and impactful ways.
In the case of Pennsylvania, socio-demographic shifts underway are likely to torque the regional realignment of the last decade. Told using the ACP’s 2012-era typology, much of the political story of the Obama-through-first-Trump era in Pennsylvania was about the ex-industrial, olive-green areas below swinging from being enduring Democratic stalwarts to swingy but Republican-friendly terrain.
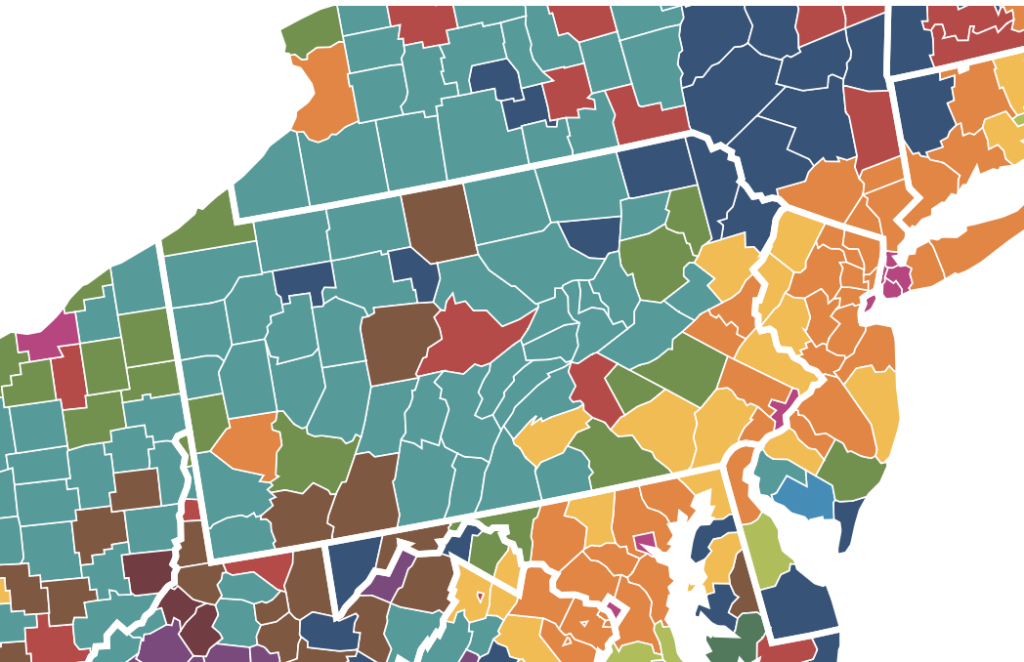
2012–2023 American Communities Project Map
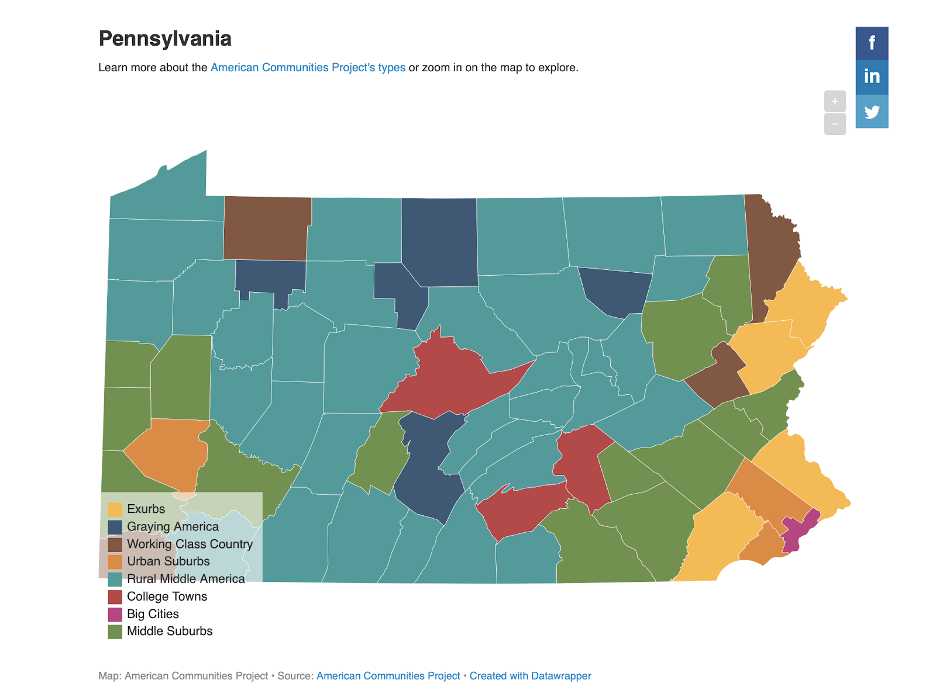
Now look at the 2023 map below. The story for the foreseeable future will be the Lehigh Valley and South-Central Pennsylvania voting increasingly like New Jersey and northern Virginia, and southwest Pennsylvania — with the important exceptions of Allegheny County and communities adjacent to it — voting increasingly like Ohio and Indiana.
2023–Present American Communities Project Map
Neither Republican nor Democratic activists should take that assessment as grounds for either complacency or fatalism about any part of the state. For statewide campaigns (and the electoral college), limiting losses in opponents’ home turf can make the difference between victory and defeat. Meanwhile, there will be possibilities for crafting winning campaigns at the local level even in places where county-wide totals aren’t running one’s way. Underlying demographic patterns shape a landscape of political opportunity and inclination. Activists’ and organizers’ work is to build bridges and communication lines fit for that evolving terrain.
Lara Putnam is UCIS Research Professor and Director of the Global Studies Center at the University of Pittsburgh. She leads the Civic Resilience Initiative at the University of Pittsburgh’s Institute for Cyber Law, Policy, and Security.