A common narrative portrays “Rural America” as one big place with one set of similar people and facing similar challenges. Yet, in reality, rural America’s geographic, demographic, and socioeconomic landscapes are remarkably diverse. Rural places can be hilly and remote, or begin at an interstate exit with flat lands stretching to the horizon. The racial and ethnic composition can look like it did 50 years ago or be decades ahead of trends. Their economies might be driven by tractors and commodity prices or by factories and the retail trade. The American Communities Project uses its unique community typologies as well as data and on-the-ground reporting to explore these differences and blow up the mythology of rural America. (Note: The multimedia report contains many graphics and interactive features that can delay loading time.)
by Lara Putnam and Gabriel Perez-PutnamSeptember 13, 2019
As the 2018 midterm campaigns hit their stride last summer, there was finally some mainstream recognition that post-2016 grassroots groups — sometimes discussed as “Resistance” groups — had become an electoral force to be reckoned with. Reporters and academics have established certain baseline facts:
Can we gather a more detailed assessment of where the new grassroots are? A previous post here tried to answer that question for Pennsylvania, combining electoral stats and firsthand observations to trace variations in grassroots intensity by county type and show the 2018 electoral swings linked to them. What does the data show across the nation as a whole?
As of January, some 4,600 groups were listed on Indivisible’s “Find Your Local Group” portal; the great majority had been posted in the first half of 2017. As we have discussed elsewhere, group listings there should not be taken as a complete list of post-’16 grassroots organizations, nor as reflecting the reach of Indivisible national headquarters per se.
Detailed study of the 225 groups listed for Pennsylvania and the 77 for Missouri confirms that some never came into existence, others are longtime local progressive groups with no ongoing connection to Indivisible, and still others have never had more than a virtual (Facebook or listserv) existence.
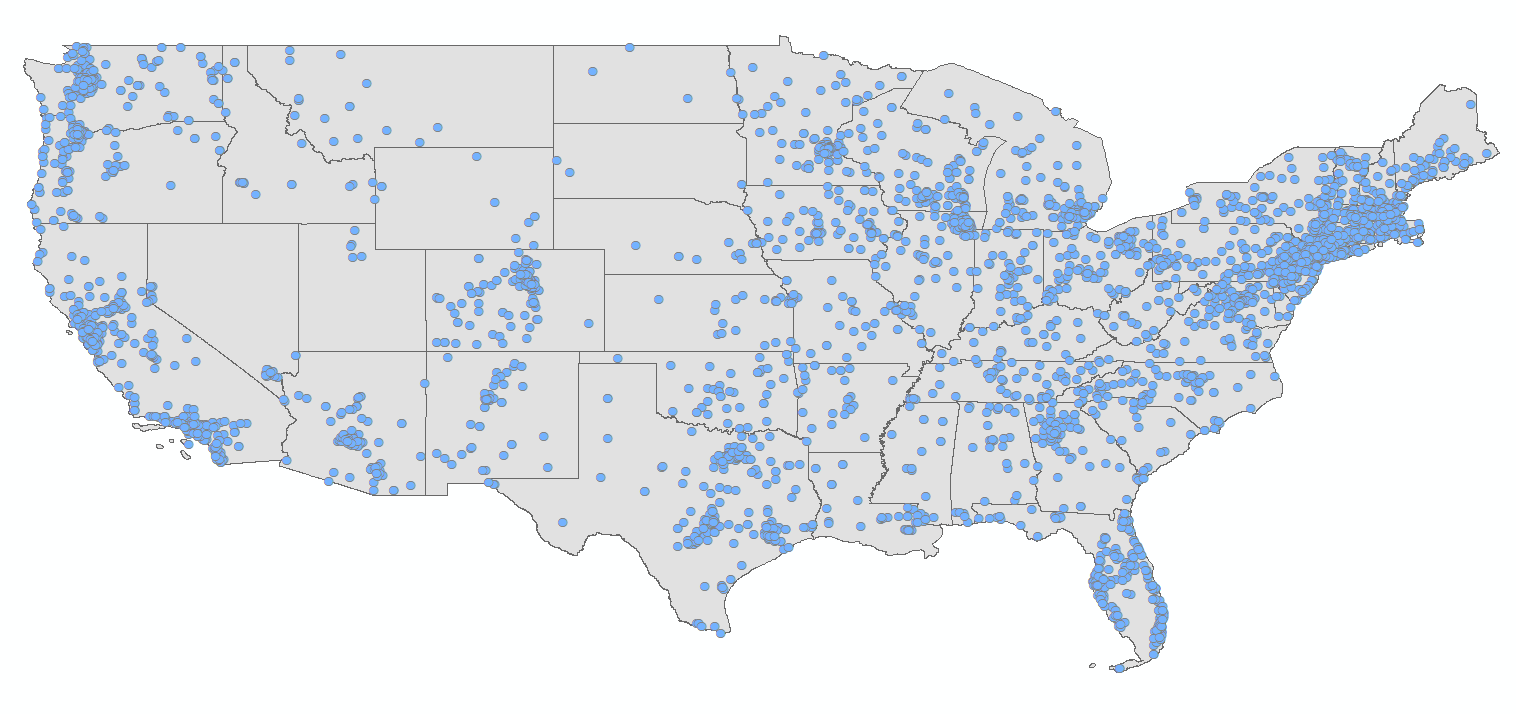
Map of Group Listings Included in Indivisible Portal, January 2019
Meanwhile, sizable numbers of similar, locally-originated post-2016 grassroots groups — groups with active boots on the ground, remaking politics in their communities — never chose to list themselves in the portal. But most often, such groups are in the same places for which portal listings are dense. In Pennsylvania, the correlation between the county count of Indivisible portal listings and the county count of unlisted groups that Harvard political scientist Theda Skocpol’s research group has located through intensive local research is .87. In sum, we see every reason to treat this dataset of 4,600 posted, geographically locatable groups as the best available indicator of the strength of new grassroots organizing in reaction to the Trump presidency in any given locale.
Just eyeballing the blue dots in the map above already tells us that the landscape of change spreads well across the country, with a sizable presence in some middle American states that routinely vote Republican, and a meaningful reach well outside America’s big metros.
Note that we are not claiming these data capture all political organizing in the era of Trump. In some places existing local civic groups have remained the main channel for political organizing: This has been true for African American churches within African American communities both rural and urban, and seems to be the case with locally-rooted labor groups in Nevada. The dataset we are mapping is by no means a guide to all political action worth watching today. But it is the best guide we have to where the organizational landscape of center-to-left political engagement has most changed and grown in response to the 2016 election.
Studying the Grassroots by Congressional Districts
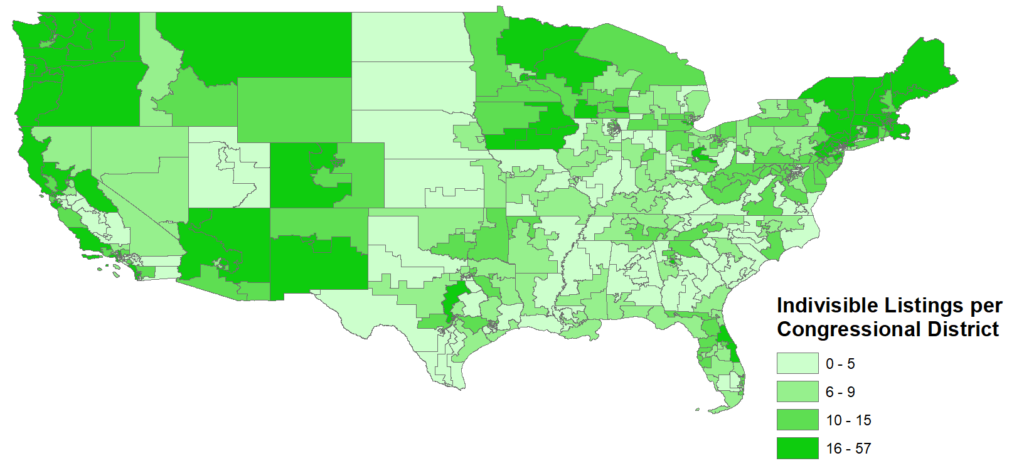
The following map, a choropleth that colors congressional districts by the number of postings (thus controlling for population density), makes the changing landscape even clearer. Rural, rural-mix, and sparse-suburban districts across Iowa, Minnesota, Wisconsin, Arizona, West Virginia, Texas, and beyond show up as having a significant new grassroots presence.
Map of Group Listings Included in Indivisible Portal, by Congressional District
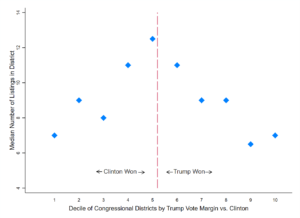
When we match those districts to their 2016 presidential vote margins, a striking pattern emerges — and again, it is not one of coasts-vs.-heartland polarization. With stunning rationality, new group formation was concentrated where groups could be most impactful: in the nation’s most narrowly balanced congressional districts.
Median Number of Groups Listings per Congressional District, for Each Decile of Districts when Arrayed by 2016 Presidential Vote
Of course, congressional districts are large enough that most encompass multiple different settings: chunks of cities; stretches of suburbs and towns, manicured and prosperous in some cases, grimly down-on-their-luck in others.
Using Counties and the American Communities Project
We can learn more about the kinds of local contexts shaping group formation when we map groups onto counties, and use the American Communities Project taxonomy to understand which kinds of places these counties represent.
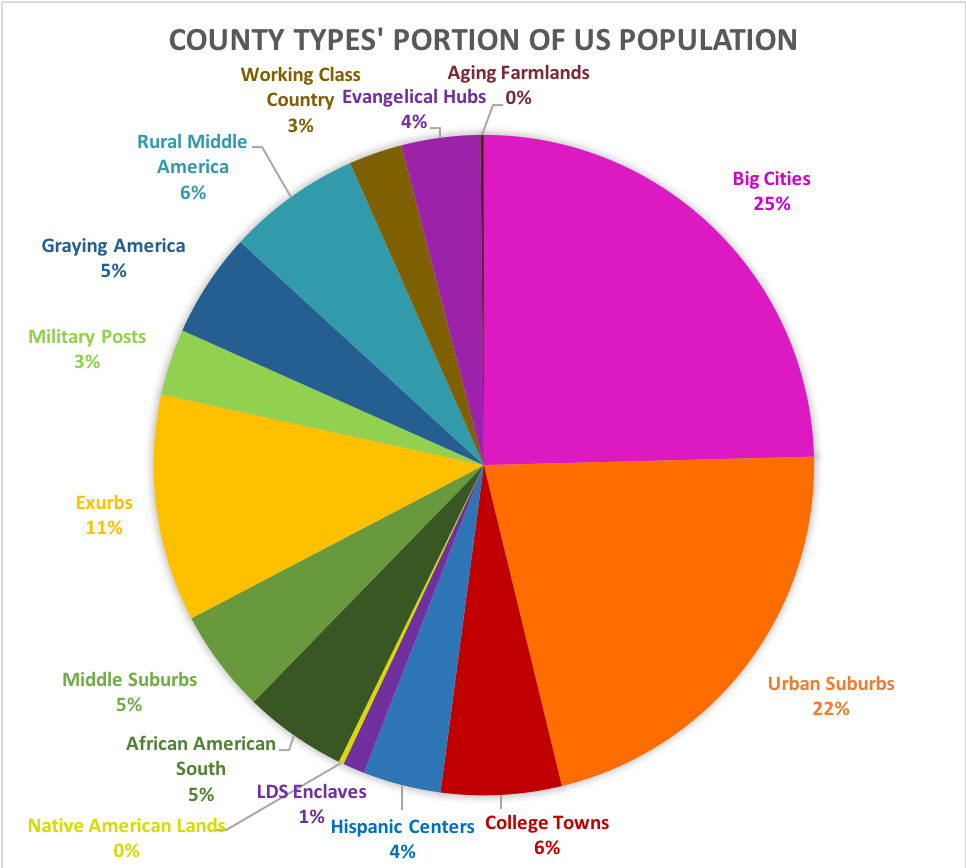
First, let’s review how the nation’s overall population is distributed across the American Communities Project’s 15 county types.
Big City counties account for the largest share, with a quarter of the nation’s population.
Urban Suburbs (dense, cosmopolitan, and highly educated) make up nearly as large a share.
Exurbs (well off, less dense, and less diverse) account for half that population share.
Middle Suburbs and Rural Middle America (each less educated, less wealthy, and largely white), College Towns, Graying America, and African American South each account for roughly half the population of the Exurbs.
All other county types comprise even smaller shares.
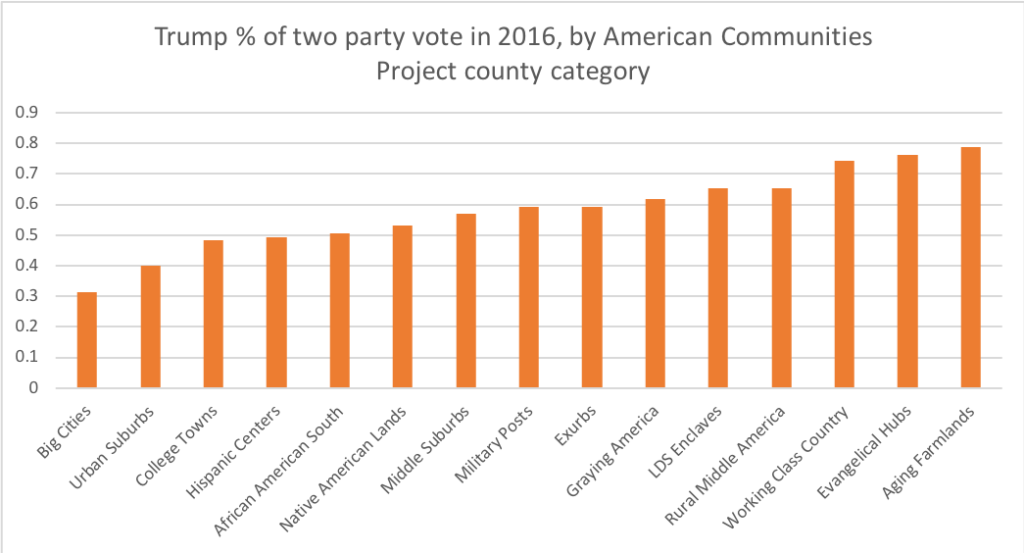
The Trump Vote by County Type
These county clusters, varying by population density, age profile, race and ethnicity, education, income levels, religion, and more, display markedly different political preferences. Less than one-third of voters in America’s Big City counties voted for Donald Trump in 2016, while almost half of voters in College Town counties did so.
At the opposite end of the spectrum, three-fourths of voters in Working Class Country and Evangelical Hub counties and nearly four-fifths of voters in America’s Aging Farmlands cast their ballots for Donald Trump.
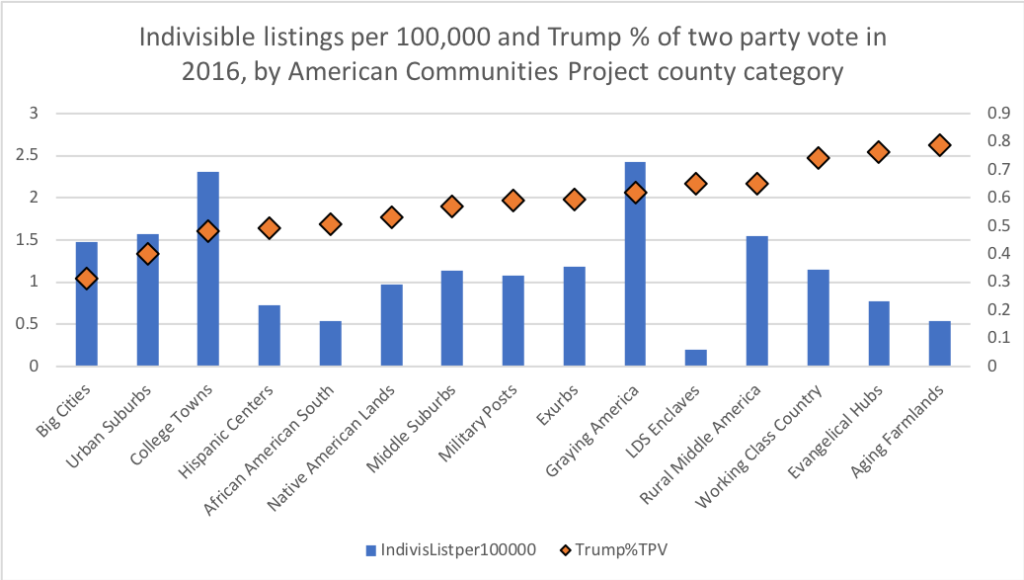
Where Grassroots Group Listings Are Highest by County Type
Given these demographic and political differences, it is not surprising that our Indivisible portal dataset suggests the intensity of grassroots group formation varies notably by county type. What is surprising is how little the pattern of grassroots intensity reflects the pattern of presidential vote choice.
Group listings were highest, per capita, in College Towns and Graying America.
At the second tier down are Big Cities, Urban Suburbs, and Rural Middle America. These have strikingly similar rates of group formation despite their very different demographic and political profiles. (Donald Trump got only one vote out of three in America’s Big City and Urban Suburbs combined; Hilary Clinton did just that poorly in Rural Middle America.)
A third tier includes five county types: Exurbs, home to 36 million people, Middle Suburbs of 16 million, Military Posts of 11 million, Working Class Country of 9 million, and Native American Lands of under 1 million.
The lowest rates of post-2016 group formation are in Evangelical Hubs, Hispanic Centers, African American South, Aging Farmlands, and LDS Enclaves.
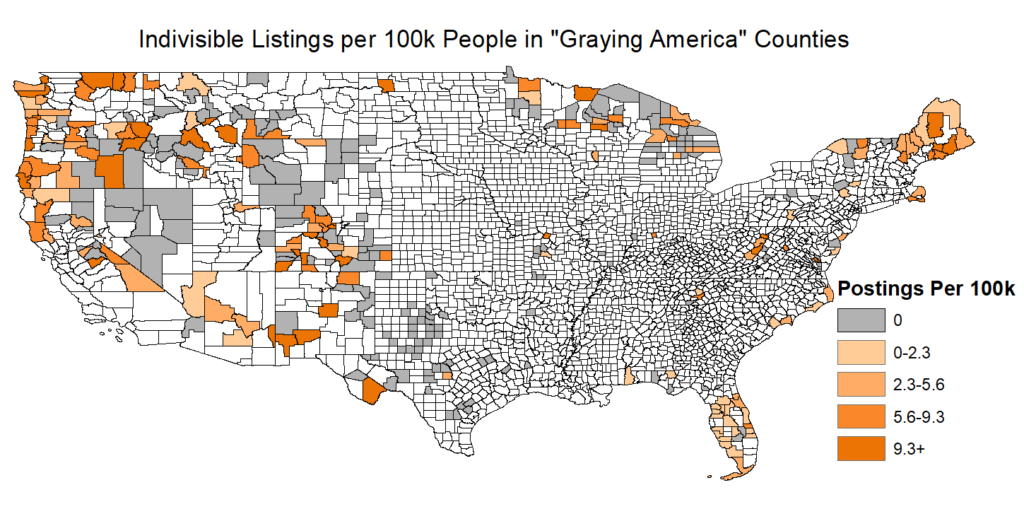
How Graying America Stands Out
While most county types are consistent nationwide in having either lots or few postings to the Indivisible group list, others vary more. “Graying America” stands out (stats here): This category includes some of the counties with the very highest per capita counts and also a good many of the lowest. New grassroots organizing is very high in those counties that are disproportionately older because prosperous elder folks retire to them — Arizona, Florida, Oregon, and Washington. In contrast, it is very low in those counties — largely in the Rust Belt and High Plains — whose populations are older because the young people who can leave have left
This “Graying America” map should spark questions about the impact of newly organizing, fired-up liberal retirees in Arizona and Florida: places where most of their close neighbors and peers may be staunch conservatives. How effectively are the progressive newcomers or “snowbirds” that these indicators seem to capture, connecting up with potential Democratic voters around them — who in Arizona and Florida may be quite different from the newfound activists in age, class, and cultural coordinates?
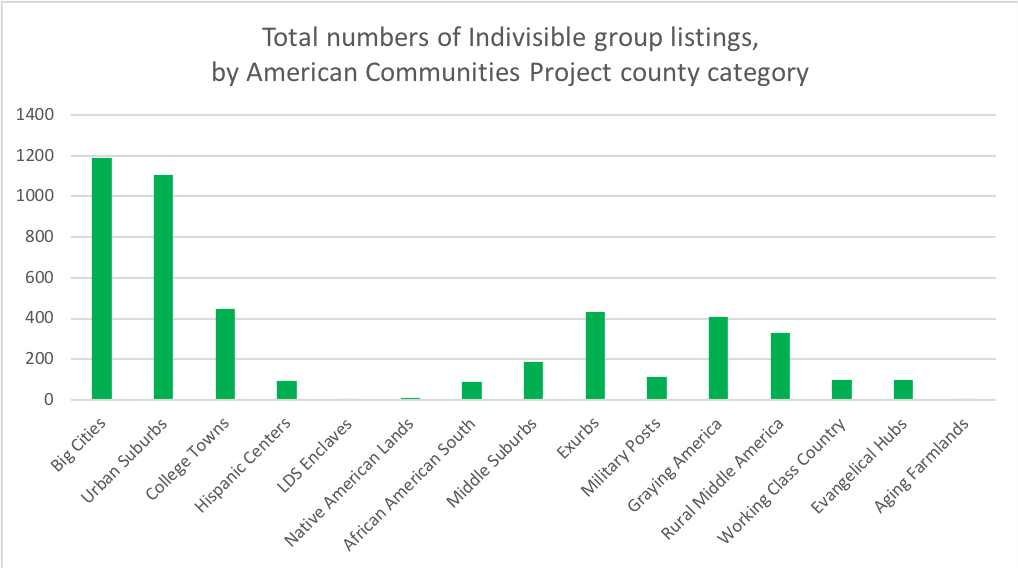
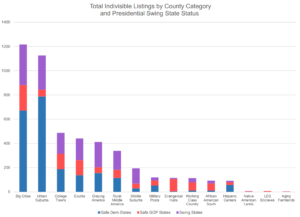
Let’s conclude by shifting away from per-capita prevalence to simple totals. As we consider where new organizing is likely to make an impact moving forward, it’s helpful to know not just where the grassroots are strong per capita, but where the grassroots are strong, full stop. Here’s what that panorama looks like.
How Grassroots Groups Fit into Electoral College Map
To explore the potential impact on the Electoral College, we broke that down by anticipated presidential vote status as well. The resulting chart shows many, many postings coming from blue state Big Cities and Urban Suburbs: That captures all those new groups in metropolitan and suburban California (and New Jersey, Virginia, New York, and beyond) who flipped “Country Club Republican” congressional districts from red to blue last year.
But we also see significant indicators of group activity in the swing states, in purple here: Florida, Wisconsin, Pennsylvania, Michigan, New Hampshire, Nevada, Arizona, Georgia, North Carolina, Iowa, Ohio, Minnesota, and Colorado.
The indicators of new grassroots presence in these swing states are spread far more evenly across county types than in blue states. They are found in Big City counties (as is a chunk of purple state population). But purple state Urban Suburbs, Graying America, Rural Middle America, Middle Suburbs, Exurbs, and College Towns are now home to significant boots-on-the-ground for center-to-left electoral action as well.
There has been a lot of supposedly savvy commentary recently about how narrow a slice of America will decide the 2020 presidential election. But post-’16 grassroots group formation shows regular citizens forging a far broader geography: of small-d democratic action today, and of capital-D Democratic possibility over the long term.
Lara Putnam is UCIS Research Professor and Chair in the Department of History at the University of Pittsburgh. She is active in grassroots political organizing in southwest Pennsylvania.
Gabriel Perez-Putnam (right) brings experience in data analysis and modeling from his work in antitrust consulting. His academic background is in engineering and economics, with a focus on human interactions with the built environment.
Nearly two-thirds (64%) of U.S. travelers plan to take a vacation this summer — many escaping to Orlando, Florida; a historical European city; or a city in the American West, AAA recently reported. This divide between domestic and international destinations comes into sharper focus through the prism of the American Communities Project. So, too, do the differences in Americans’ preferred vacation activities. (Discover what type of community you live in using our interactive map.)
Passport or No?
For a majority of Americans, traveling abroad does not appear to be on an immediate itinerary. Just 44% say they have a valid passport, according to recent Simmons Consumer Research data.
The rates are higher in more diverse, urban areas, yet no individual community type crosses the 50% threshold. Urban Suburbs, known for having a highly educated, multicultural population mix, reach 50%, while segregated, diverse Big Cities come up just shy at 48%.
In contrast, Working Class Country, the African American South, and Evangelical Hubs — poorer, more rural communities concentrated in Appalachia and the South — are well below the national average at 32%, 31%, and 30%, respectively. Rural Middle America, full of residents with average incomes and educations concentrated in small towns from Maine to Minnesota, is slightly higher at 37%.
Union-heavy Middle Suburbs, places in the Industrial Midwest hit hard by the globalized economy and more recently by America’s continuing trade fights, reach 40%. Graying America, often in rural areas and home to large numbers of retired seniors of moderate income and education, ticks to 41%.
Running in the middle of the pack are community types filled with educated, global-thinking, bilingual youth. LDS Enclaves, where many of Mormon faith undertake missionary work abroad, post a rate of 43%. Similarly, it’s 42% in College Towns, well-educated bastions where students learn the value of cross-cultural competency and studying abroad is commonplace. Hispanic Centers, home to high numbers of Latinos and youth, many of whom are immigrants, also stand at 42%.
AAA’s Top 10 Summer Vacation Spots
The top 10 vacation destinations, according to AAA’s travel bookings from June 1 to August 15:
Orlando, Florida (in an Urban Suburb)
London, England
Rome, Italy
Vancouver, British Columbia, Canada
Dublin, Ireland
Paris, France
Seattle, Washington (in a Big City)
Anchorage, Alaska (in a Military Post)
Honolulu, Hawaii (in a Big City)
Punta Cana, Dominican Republic
What Americans Enjoy Doing on Vacation
A majority of Americans say they like to sightsee on vacation, according to Simmons Consumer Research. That ranks higher than all other vacation activities. Going to the beach is the second most popular at 43%, and shopping comes in third at 36%. The top seven activities — all above 20% — are depicted in the chart below.
Dig deeper and distinctions emerge. For example, when drilling down to the community type level and looking at some popular activities associated with summer vacations, sightseeing is most favored in the homogenous Exurbs, Aging Farmlands, and LDS Enclaves. Sightseeing ranks below average in more diverse communities: the African American South, Big Cities, and Hispanic Centers.
The pattern is similar for another vacation activity that many Americans would consider a quintessential summer vacation: going to the beach.
People in LDS Enclaves are far and away the most likely to enjoy going camping/hiking on vacation, as the community type holds a rate that’s 56% above the average. Two other predominately rural community types, Aging Farmlands and Rural Middle America, are also more than 20% above average. In general, and perhaps not surprising given people’s comfort with their home terrain, camping/hiking shows a starker divide between rural and urban areas than other activities do.
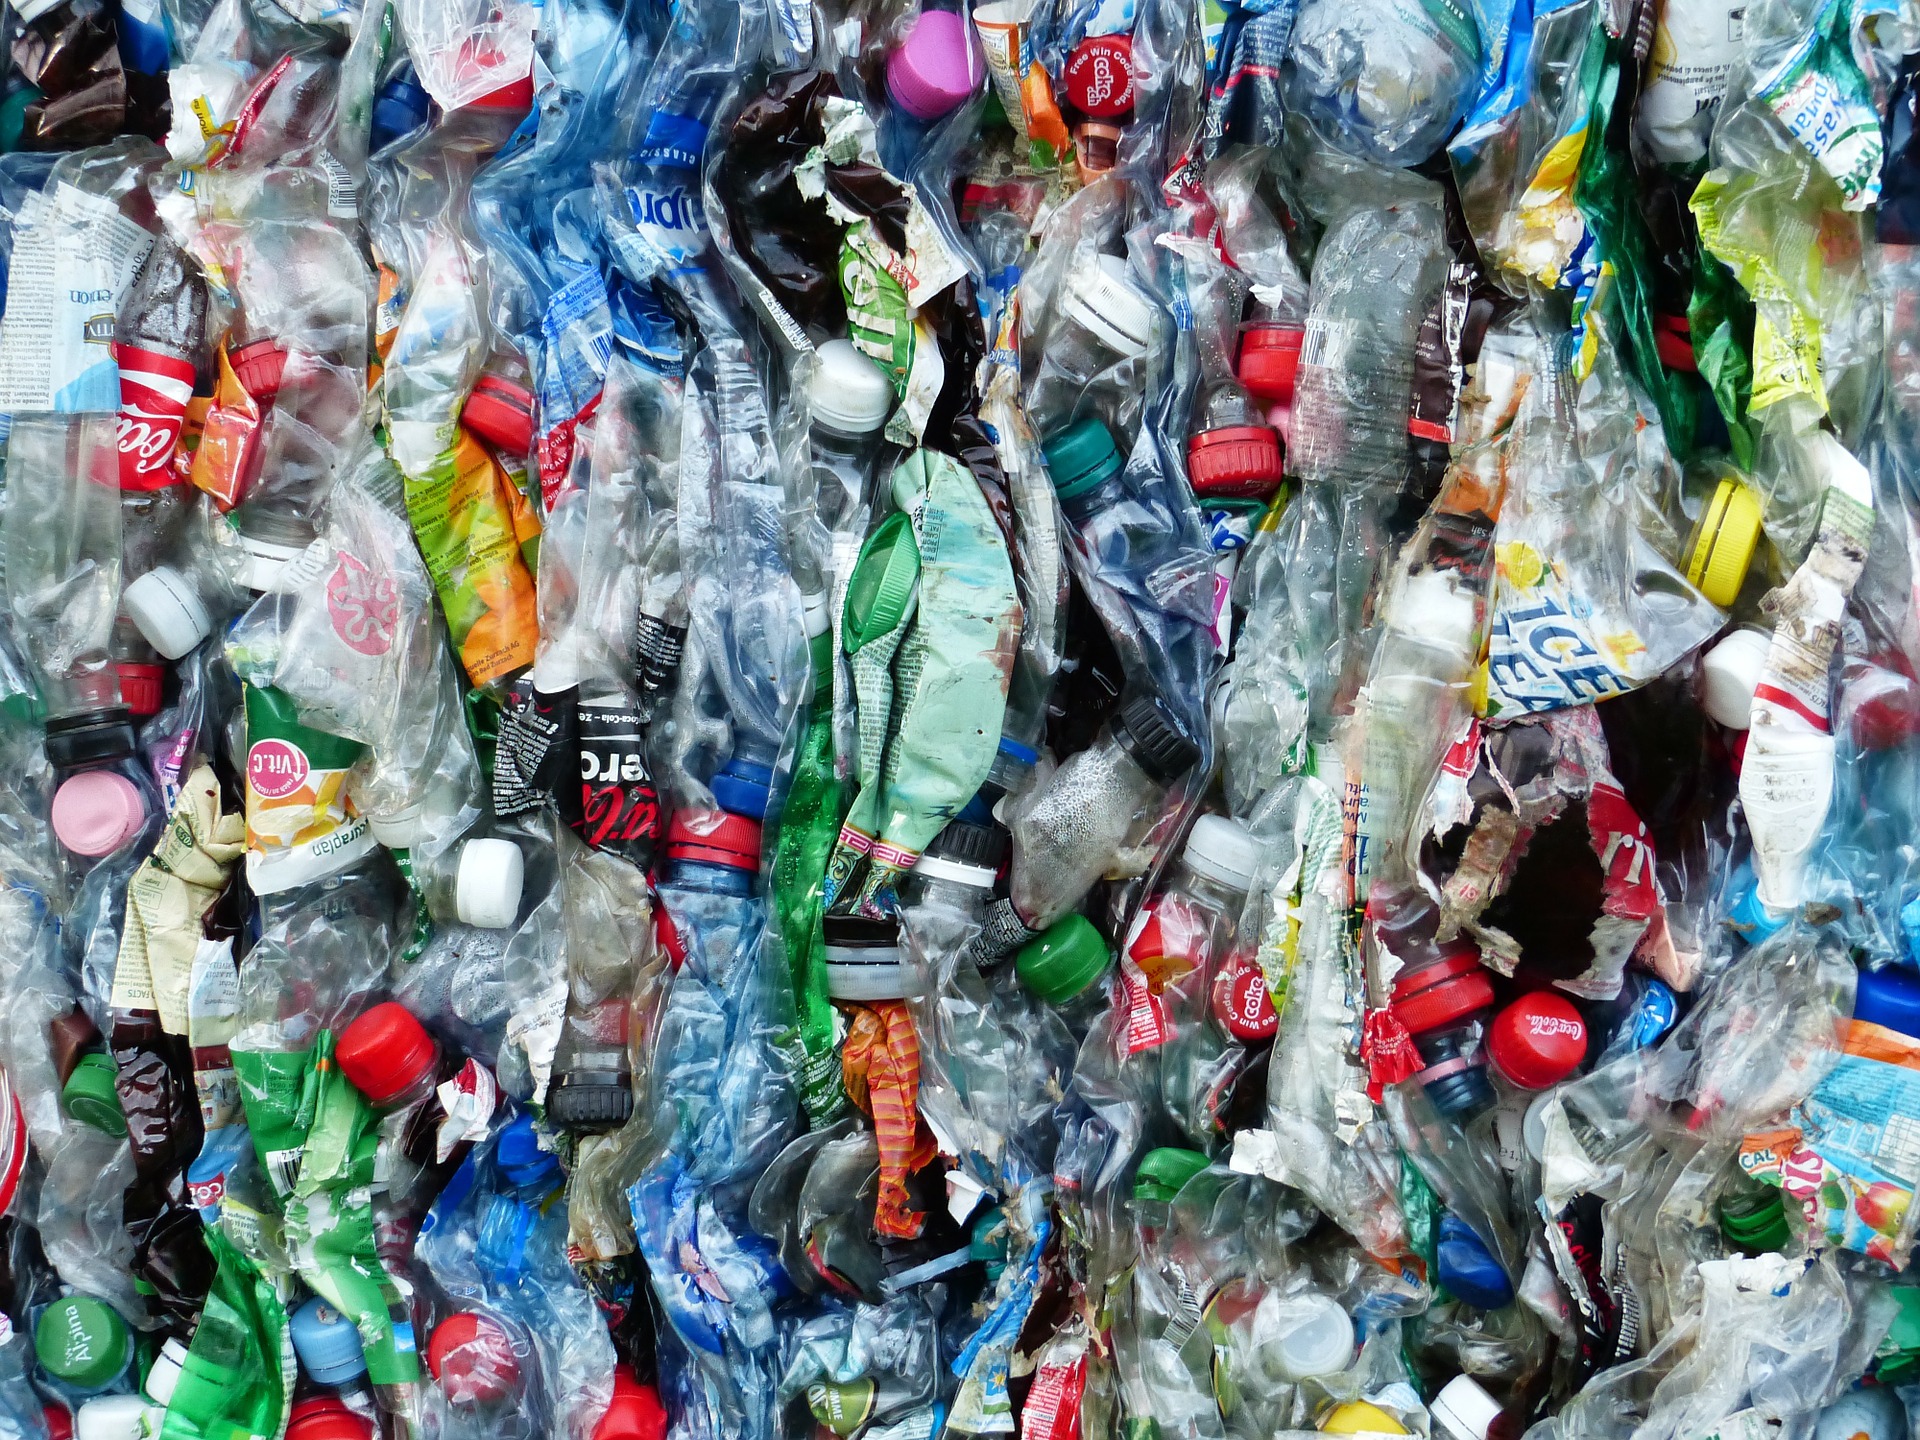
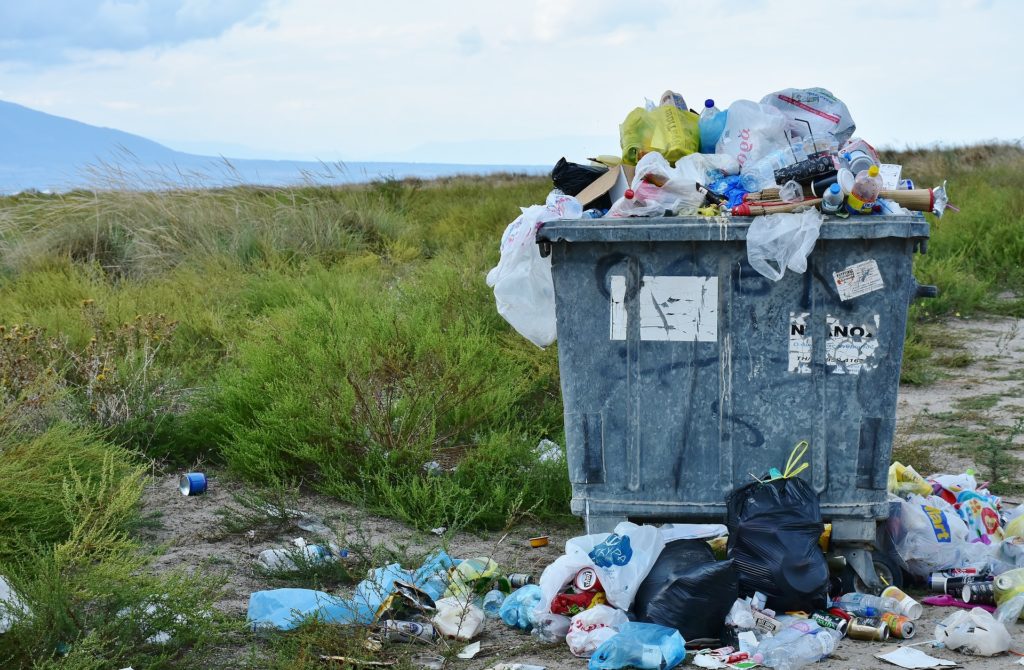
Americans are recycling now more than ever. In the 1970s, the decade when Earth Day was formally recognized, people recycled just 7% of their waste, compared to about 35% today.
While that number is a clear improvement, it also that means that nearly two-thirds of the items we use, most of which could be composted or recycled, still end up in the trash. According to new data from Simmons Consumer Research, a majority of people across the country say they don’t regularly recycle. About a quarter of the population reports never recycling their glass, paper, metal, and plastic waste.
The U.S. recycling system itself is in dire straits. Prior to 2018, the U.S. shipped about 40% of its recycling to China for processing. But last year, China changed its policies, and the country no longer accepts most of the items the U.S. used to send over, such as mixed paper and most plastics. Municipal programs have struggled to adjust. Some have been cut altogether, with rural areas and small towns hit the hardest.
Differences Between Urban, Suburban, and Rural Communities
Breaking down recycling rates using the American Communities Project types shows that communities already have marked differences in their recycling habits. (You can find out what type of community you live in using our interactive map.)
Suburban communities — Exurbs, Urban Suburbs, Middle Suburbs — report that they recycle “very often” at higher rates, according to the Simmons data. People in Big Cities tend to report recycling only “sometimes.” On the other hand, residents of some more rural communities are more likely to say they do not recycle. Survey respondents from African American South communities, Evangelical Hubs, Native American Lands, and LDS Enclaves report “never” recycling different items at higher than average rates.
Take glass, for example. In the Urban Suburbs, more than half (51%) of people say they recycle glass beverage containers very often and more than one-third (39%) of people report recycling other types of glass very often. In LDS Enclaves, however, just one-third of people (33%) say they recycle glass beverage containers and just over a quarter (28%) report recycling other types of glass at the same frequency.
People also report recycling plastic differently depending on where they live:
One Barrier: Unequal Access to Recycling Programs
A mayor caveat to the findings, of course, is whether people actually are recycling as much (or as little) as they say. Additionally, recycling infrastructure across the country is highly unequal. About 94% of the U.S. population have some type of recycling program available to them. But a recent Pew Research Center survey found that about seven-in-ten people living in urban and suburban communities report having curbside recycling, compared with just four-in-ten rural residents. And an October survey by the Recycling Partnership, a nonprofit aiming to improve recycling, found that more than half of Americans, particularly young and low-income people, feel they don’t have access to recycling programs.
What is clear across the country, however — whether due to a lack of resources, personal decisions, or the struggles of the recycling industry — is that recyclable bottles, bags, cans, and boxes are piling up in our trash.
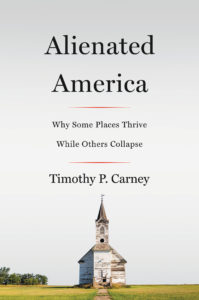
In his opening presidential campaign speech, Donald Trump declared, “The American Dream is dead,” thus launching his campaign theme: Make America Great Again. This belief in the American Dream’s death was the “defining characteristic” of Trump’s enthusiastic Republican primary support, journalist and conservative commentator Timothy Carney soon realized, as he described in a recent interview with the American Communities Project.
In 2016, Carney set out to understand why the American Dream seemed dead to so many. He knew the widely discussed explanations: factory closures, more equal rights for women and minorities, old white men angry about losing their privilege.
Carney’s new book, full of personal stories and studies, is the product of his search for answers. Alienated America: Why Some Places Thrive While Others Collapse reveals how an invigorated community is the backbone of the American Dream. In his journey through America, Carney uncovered that “places collapse if they are not planted with institutions of civil society that connect people together and provide a sense of purpose. The places that thrive have those institutions, and in America, for the middle class, those institutions are mostly church,” as he put it in our interview.
Read on for more highlights of Carney’s research, his viewpoint shifts, and his ideas for rebuilding civil society. (Click on the anchor links below to jump to specific points of our interview.) Listen to the full, 34-minute interview.
Tie Between Social Capital and 2016 GOP Primary Vote
When I talk about Trump support in the book, I’m almost always talking about the Republican primaries. In the general election, there’s two choices; there’s so many confounding factors. But when there are 17 people on the ballot, for those choosing Donald Trump, my hypothesis was it was an expression that the American Dream was dead. It was borne out by the data in Iowa — the counties with the best measures of social capital were Trump’s worst counties. And Trump’s best counties were the counties with the lowest measures.
Two of the most educated counties in America are in Iowa, and they were two of Trump’s worst counties in the whole country. But Sioux County — where everybody is Dutch (they’re Dutch reformed); they go to church twice on Sundays; there’s two Dutch reformed colleges — was Trump’s worst county in Iowa by far. The other bad counties were where Des Moines is, where Iowa State is, where the University of Iowa is.
His best big county was Pottawattamie County, which is where Council Bluffs is. The Trump contingent — a huge number of first-time attendees — didn’t even have a leader. Jeb Bush had a precinct captain in every precinct there, even if he’s only getting five supporters in a precinct. Trump had the most people in that room in Pottawattamie County, but then they sort of disbanded at the end. Pottawattamie has the worst social capital scores of any big county in Iowa.
How Factory Workers’ Skills Relate to Family Formation
I call this the Joe Adams Effect. In 2005, there was a factory in Bloomington, Indiana, shutting down. I stopped by the union hall, and Joe Adams, the vice president, was losing his job. I asked him how he got into factory work. He said, ‘I was kind of surprised when I first wanted a factory job; they asked me if I had experience.’ Joe responded: ‘What do I need experience for? This is unskilled labor, right?’ You pick up a tool, you drive in a rivet, and then you do it again.
And they said, ‘You know what we want from experience? We want to know: Do you show up on time? Do you wait until the whistle to take your lunch, come back before lunch is over, and then stay until the whistle? Do you only call in sick when you’re actually sick? And are you willing to stick around and do this mundane thing for decades?’
This was 2005 — before I was married and had kids. Thinking about Joe Adams years later, I realized this is a prerequisite for being a dad. Can you show up on time, stay for as long as you’re needed, pick up basic unskilled tasks like changing a diaper and not burning the scrambled eggs and commit yourself to something that at times might be crazy-making for decades?
I realized factories cultivated these skills of the unskilled. You could call them basic virtues, and places that lost those factories lost a training ground for those virtues. If you go to college, if you go to a high school that expects you to go to college, a lot of those same things are there, while for the working class, the factory was the prime training ground. I included that because the data show that the retreat for marriage in America is mostly happening in the working class. And one of my explanations is that the loss of the factory job has meant less cultivation of those basic virtues.
Mancamps in Fracking Towns: A Natural Experiment
The mancamp is this warren of trailers and the rooms are fairly nice. It’s a flat-screen TV, a nice bed, good lighting; you are sharing a bathroom but only with three other people. Then there’s these massive quadruple wide trailers with ping pong tables, all you can eat fast-food, 24-hours a day, and big screen TVs for watching the game. It was dude-heaven.
In Williston, North Dakota, they effectively had to import lots of workers, but they also had to pay them a lot of money. It was $18 an hour for unskilled labor. If you had a commercial driver’s license, you were making six figures because this is fracking central.
But there was a study of these various fracking communities because what was the rare thing going on here: blue-collared guys getting a lot of money. So if we saw the loss of these good factory jobs preceded the retreat from marriage among the working class, the return of good jobs for the people without a college education should hopefully bring a return to the marriage and family formation. It didn’t happen in Williston, and it didn’t happen in these other fracking towns, as studied by Melissa Kearney at Brookings.
For me, the lesson of Williston was this isn’t a real human community. You are giving labor and they’re giving you money, which may sound like what all work is, but most jobs are different. They’re more relational. Most places are geared towards family formation.
Biggest Surprises in Research — It Takes a Village
Author Timothy Carney is a visiting fellow at the American Enterprise Institute and the commentary editor of The Washington Examiner.
One of the things that surprised me most is that I would find the phrase it takes a village to raise a family to not only be true but profound. This was, of course, Hillary Clinton’s book title, and to me as a conservative, it sounded like some collectivist thing.
A lot of my individualism faded away while writing this. As a parent, I never thought my wife and I were doing this on our own. But realizing that it wasn’t just that we relied on this help but that the whole undertaking of family formation requires this support structure of a community of multiple institutions.
For other conservative friends, one of the most surprising things is that the liberal elites practice what we social conservatives preach. They finish school. They get a job. They get married. They stay involved in their kids’ lives. I address in the book what I call the Lena Dunham Fallacy: this belief that liberal elites, college-educated elites, are all graduating from Wesleyan and then never getting married, and if they have children, it’s deliberately out of wedlock with no regard for the traditional family. That’s not the way it works.
One of the places I go in the book, Chevy Chase, Maryland, about 10 miles from my house, is overwhelmingly Democratic. It’s overwhelmingly wealthy and educated. If you go to a place like Chevy Chase, you will see them living the traditional family life: finishing school, getting a job, getting married, having kids, staying married — divorce rates in these circles are lower than average by far — and being involved in their kid’s life, coaching T-ball, and even going to church at a higher rate than I would have suspected.
Where Education Fits In
One of the places people thought I would talk more about was education, but I see school as being another institution of civil society, not dramatically different. When people say, ‘Oh, I’m going to send my kids to a good school,’ it doesn’t primarily mean that there’s some extra skilled teachers there or more technology. It means the other parents are very involved in the school. And so school can be a very strong institution of civil society, but it’s only in certain communities.
It’s a little depressing because it means there’s no easy fix. You can’t snap your fingers or pass a new funding bill and create a ton more intact families and involved parents in a school district. There’s deeper systemic things that have to do with the strength of community.
Impact on Young People
Across the board, the data show worse outcomes for people who grow up in places with worse social capital and weaker communities. Raj Chetty is a researcher who found that the No. 1 predictor of upward mobility by children was the number of intact families locally. And No. 2 was measures of social capital.
One of the things I remember from Uniontown, Pennsylvania, was talking to this couple saying, ‘We’re going to beat this place,’ meaning we’re going to be successful, stay married, and raise our kid. They’re trying to overcome the culture in a way that I never felt particular counter-pressure.
Casting Findings After 2018 Midterms
In 2018, notably Democrats did well in places Trump had won in the Rust Belt or working-class places. Trump had won Pennsylvania and Michigan and Wisconsin, and in all three of those states, Democrats won all the big statewide races.
I actually predicted this in a New York Times piece I wrote ahead of the election. I said some people thought Trump had brought about a realignment, bringing working-class communities into the Republican Party. He certainly didn’t do that. I mean the Republican Party still stands for certain ideas: lower taxes, pro-life, Christian conservative things; that’s not the agenda of the American working class.
But more importantly, I thought the vote for Trump was a vote that the American Dream was dead. And some of the very same people were saying the same thing when they voted for Obama, especially in 2008 and also in 2012. So I wasn’t surprised to see counties in Michigan go Obama, then Trump, and then go Democrat again in 2018. It’s not an ideological expression of their vote as much as it is an expression that things are thoroughly broken all the way to the bottom.
Recommendations for Reinvigorating Civil Society
It has to happen on the local level. The last chapter doesn’t have a lot of big federal legislation that can solve it because there’s no Restore Local Institutions of Civil Society bill.
But on the community level, anybody who is near the top of an institution that has any stability should just say wait a second: We are the ones who are going to help people’s lives be better. If you’re running a church in Fayette County, Pennsylvania, you have to think what I thought was the job of some government agency, or what I thought was the job of a nonprofit geared towards helping drug addicts, is my job. Not to just necessarily provide the acute treatment but to build an infrastructure. If you want people to get married, you can’t preach to them about the importance of marriage. You have to build the culture, a society, where there’s support and modeling for that.
A lot of it is on an individual level: Go to church and start a T-ball team. Even while writing this book, I started a T-ball team and coached kindergarten girls basketball and saw a positive value for myself and others.
We have to get rid of, weaken, or reform those policies that kill institutions or try to back them into corners. Sometimes there are people who don’t like the idea of churches and religious organizations getting involved. They say, ‘Your job is to lead worship and spirituality; stay out of civil society.’ I would like to tell people who disagree with religious institutions, OK, but let them do their good work without trying to interfere with them because that is going to be the backbone of the American Dream.
On a secular level, it would be a big gain for counties and states to move control of schools to as local a level as possible. People always ask me, ‘Are there secular things I can do what you talk about the churches doing?’ And I say, ‘Yeah.’ I’m from New York, and I know places in New England where the local schools really are controlled by the town. So then they become these defining institutions. The high school where I grew up was what made our town our town, and we had control over it.
In my current county, Montgomery County, Maryland, there’s no local control over the schools. It’s run by the county, which runs a dozen schools. Give people control over their community. That gives them a sense of purpose, the modeling, and the safety net to allow them to have the infrastructure around which you build a good life. That would be one public policy proposal that states and counties can carry out.
What Media Miss About Trump Supporters in Depressed Places
I think they’re missing the fact that it’s a local phenomenon, it’s a cultural phenomenon, and it’s a very real phenomenon.
Some people will chalk up it to pure economics. That’s what the populists on the right say sometimes: The steel jobs are lost. The oversimplification on the left is to say it’s cultural anxiety and then skip ahead to say, ‘Oh, this is just backwards and bigotry’ and that sort of thing.
What they’re both missing is the nature and the depth of the loss, that it’s not just that the factory shut down. It’s after the factory shut down, one of the churches had to shut down, and that people then didn’t go to the next church over, and they stopped going to church, and the coffee shop where people meet shut down.
Providing Helpful Reporting for 2020 Election
Looking beyond the purely economic explanations is the first step. And trying to deal with people on their own terms; there’s this bad habit in the press when somebody says something to respond with, ‘Oh, so what you’re saying is…’ and filling in the blanks.
Those are the two types of reporting we’ve had: People who just tried to give a purely economic account for it, or people who, when they gave a cultural account for the suffering, chalked it up to bigotry instead of alienation.
It’s tricky because I find people who live in places that have really suffered under alienation often love where they live, and will be very protective of it, and then can open up to lamenting how it doesn’t have what it needs to have and what it used to have.
Sometimes if I showed up and said, ‘I came to your county because by all measures it’s falling apart,’ they’ll say, ‘You have no idea what you’re talking about. We’re great.’ And then within an hour they’re telling me about how there aren’t these strong bonds. So listening and understanding the complex messages was a much harder undertaking than you might first imagine.
How to Reach Out to Alienated America in 2020 Campaign
It’s tricky because one of the things that made Trump appeal was articulating the pain that people suffer. And that will always be step one. I thought Hillary Clinton was incredibly tone deaf to go to Michigan right before the election and say, ‘The American Dream is alive and well as it’s ever been.’ How does that sound to somebody who remembers a strong town where people had a real ladder, and access to climb up the ladder, and now they don’t?
Trying not to demean and diminish their actual suffering would be the first way to acknowledge that this is real and that the roots of it are not purely economic. And to acknowledge that the repair is going to happen at the community level and that what you as a presidential, senatorial, or congressional candidate can do is provide some support but also make sure that nobody is interfering with people’s ability to build.
Feelings About the American Dream Now
What makes me feel more hopeful is that it’s not that our souls have gotten worse or anything. Looking at middle-class places, like Oostburg, Wisconsin, or Orange City, Iowa, I saw places that on a material level don’t have much more than the real alienated places. But they’ve built and maintained very strong church communities, so that’s made me think we don’t need to totally change the U.S. economy. We don’t need to change the character of Americans in order to turn things around. We need to figure out how to plant and make stick strong institutions in the places that are currently suffering from alienation.
More than 12% of Americans rely on food stamps to feed themselves and their families. The partial government shutdown, which forced operators of the food stamp program to make decisions in a pinch, continues to disrupt the lives of 39 million food stamp recipients.
The Supplemental Nutrition Assistance Program, or SNAP, provides food stamps primarily to low-income working families, seniors, and people with disabilities. “For many poor families, SNAP makes a huge difference in their ability to get by,” Marion Nestle, professor emerita of nutrition, food studies, and public health at New York University, said in an email.
Disruption Can Cause Crisis for Families
The United States Department of Agriculture covers the cost of SNAP benefits, while states distribute them and split administration expenses. Households on average receive about $245 a month and, usually, states distribute SNAP benefits on a 28- to 31-day cycle. But as the shutdown dragged on earlier this year, and USDA’s funding for February remained in limbo, food stamps for the month were given out two weeks early to avoid potentially slashing money for the program.
Though the government is now funded, the cycle of SNAP benefits was drastically disrupted, according to a report from the Center on Budget and Policy Priorities, a progressive think tank.
SNAP households could see an abnormally long gap between February and March benefits, with wait times depending on when states typically issue food stamps. Because of the early distribution of February benefits, CBPP estimated that about 90% of SNAP households, or roughly 30 million people, could experience a more than 40-day gap between receiving food stamps. About 4 million SNAP households faced a gap of more than 50 days between receiving food stamps. Such delays violate SNAP’s own law, which mandates that the program “ensure that no household experiences an interval between issuances of more than 40 days.”
To help lessen the strain, most states are planning to give out March benefits early. But damage has already been done.
“If you have just barely enough money to eke by, any gap will cause a crisis,” Nestle said. “Families count on SNAP benefits in their budget planning. They will have two choices: eat less or give up something else.”
Analyzing the Landscape of SNAP
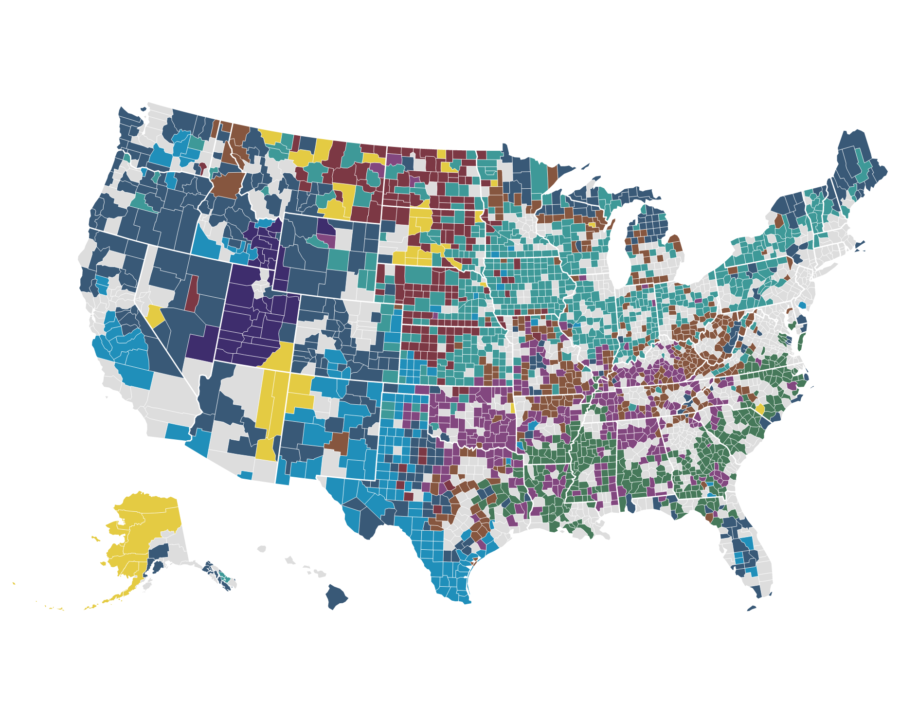
The distribution of SNAP benefits varies across the country. In Wyoming, for example, about one in 18 people receive food stamps. Just a few states over, in Oregon, one out of every six residents use SNAP benefits. In some states SNAP households are largely concentrated in certain counties, as shown on the map. Alaska, South Dakota, Kentucky, and Texas each have at least one county where more than 40% of households receive food stamps.
In South Dakota, about 11% of the state population, or 93,000 people, rely on SNAP, including several counties where more than a third of households use food stamps. In Oglala Lakota County, a Native American Land in the American Communities Project typology, nearly 55% of households receive SNAP — one of the highest percentages in the nation.
“For many, it’s what they need to bridge that gap in their budgets, so that they are able to survive, pay their bills, and put food on the table,” said Matt Gassen, CEO of Feeding South Dakota, which operates food pantries and warehouses, and partners with organizations across the state to distribute food. He noted that South Dakotans rely on SNAP in all corners of the state, a fact which may be masked in more rural areas.
Monthly SNAP benefits also inject roughly $10 million into the local South Dakota economy. If the program were to lose funding — a real worry during the shutdown — it would take about 5 million pounds of donated food each month to fill that $10 million gap, Gassen said.
How SNAP Works
Eligibility for SNAP is largely determined at the federal level based on criteria such as income and assets. Gross monthly income generally must be at or below 130 percent of the poverty line, or about $26,600 a year for a three-person family. Households with elderly or disabled members are exempt from that limit. In general, childless adults must be employed to receive benefits for longer than three months. States can apply for a waiver of this requirement in areas where unemployment is high and jobs are scare.
Food stamps are not intended to cover the complete cost of food for a household, but many families still count on them for their entire food budgets, Nestle explains. Even when the program is operating normally, most households run out of SNAP benefits before the end of the month.
Food banks and nonprofits like Feeding South Dakota are preparing to face the repercussions of a disrupted SNAP cycle. They know that when food stamps run out, people stream in seeking assistance.
“We are bracing to absorb the additional demand that we are going to see,” Gassen said. “It’s going to be a challenge for them, and in turn a challenge for us.”
Which Community Types Will Hurt Most
There are clear differences in which communities rely the most on SNAP benefits. In Native American Lands, one out of every four households receive food stamps. In African American South communities, the ratio is one of every five households. On the other end of the spectrum, in Aging Farmlands, LDS Enclaves, and Exurbs, less than 10% of households use food stamps.
Stakeholders Grappling With Uncertainty
Giving out SNAP benefits early, for the second month in a row, is an unprecedented disturbance to the SNAP cycle. “That’s just kicking the can down the road,” Gassen said. “At some point you have to catch up to get back on cycle.” It remains unclear when states will release April benefits.
Other impacts of a gap in benefits aren’t easily measured, such as the added stress on SNAP households caused by uncertainty and confusion.
“Messing around with SNAP benefits hurts the most vulnerable members of our society,” Nestle said. “We are a rich nation and can easily afford to help the most vulnerable. That we don’t do a better job of that is shameful.”
There are many ways to crack the fissures of the American economy — the impacts are unfolding in real time. Take personal finance in this unpredictable climate for one. Peering into people’s financial accounts on the county level shows the degree to which communities of color lag in creating wealth. In particular, the 161 Hispanic Centers, with their young and growing populations, struggle here.
More than two-thirds of Americans report some form of financial investment for the future, according to Simmons Consumer Research. Across the American Communities Project’s 15 types, 69% say they hold investments. The common link stops there.
Beneath the surface appear obvious cleavages. Whiter, older, rural areas break away from the pack at considerably higher rates: In Aging Farmlands, 79% own investments; in Rural Middle America, 78% do. For these rural areas where the median household income is just below the national average, a mindset of frugality instilled in youth and deepened through experiencing reversals of fortune season to season may be driving these rates; small towns, too, have seen business dry up and people departing for places of greater opportunity.
Other predominately white suburban communities, the Exurbs and the Middle Suburbs, stand at 76%. Exurbs, on the far outskirts of cities, are full of high-earning professionals with the means to invest. Middle Suburbs, found across the Industrial Midwest, are still home to sizable populations of union workers with pensions.
Communities of color, meanwhile, are at the bottom of the pack: In Hispanic Centers, where the median household income is low at $45,800, just 55% hold investments. In addition to having lower incomes and younger, unestablished populations, Hispanic Centers confront the obstacles of documentation status and English literacy, including financial literacy.
For youth-populated Native American Lands, where 31% are under 18, as well as long established African American South counties, the investment figure dips just below the average to 67%; while Big Cities, the most populous, diverse community type with a highest degree of racial and ethnic segregation among the types, clock in at 61%.
The Ability to Save — or Not
The 35-day, partial government shutdown highlighted how many Americans are living without savings. A Huffington Post/YouGov poll taken January 22-23 found that 52% are living paycheck-to-paycheck. The number jumps to 69% if a household earns below $50,000 a year.
This tracks with findings from Simmons Consumer Data last year. While savings accounts are the most used investment instrument, this financial tool doesn’t reach a majority: 47% of Americans across types have at least one. Once again, Aging Farmlands and Rural Middle America are ahead here: 57% of residents in both types have a savings account.
Where banking deserts are common, particularly in communities of color, the savings account rate is much lower. For example, the rate drops to 44% for both the African American South, where the median household income is $37,500, and the Native American Lands, where it’s $41,700. Diverse Big Cities, where the median income is $58,700, come in at 39%.
In Hispanic Centers, the rate plummets to 34%, marking the lowest percentage among the ACP types. It’s worth noting that in Hispanic Centers, 10% of people reported sending money to someone outside the U.S in the past year — the highest percentage among the 15 types. Many may be wiring cash to relatives.
Work Retirement Accounts More Exclusive
For the 24% of Americans invested in work retirement accounts, the topsy-turvy stock market may be of particular concern. In affluent Exurban counties, 30% of people have a 401(k), 403(b), or 457(b), thrift savings plan, or tax shelter annuity. LDS Enclaves, counties with high numbers of Mormons, are the next highest at 27%.
(While 401(k) plans are options in corporations and for-profit companies, 403(b) plans are common in public educational institutions, nonprofits, and churches or church-related organizations; 457(b) plans are offered in state and local government agencies and some nonprofits. A thrift saving plan is a defined contribution plan for U.S. civil service employees and retirees as well as for members of the military.)
Here again communities of color have noticeably lower rates: The African American South comes in at 19%, while Hispanic Centers lag all places at 16%.
For several communities — Middle Suburbs, Aging Farmlands, Military Posts, Urban Suburbs, and Rural Middle America — the average for such plans stands at 26%.
Of these, only Urban Suburbs and Military Posts are known for having more diverse, educated populations. With large numbers of African Americans, Military Posts post a median household income just above the national average at $57,700, while the multiethnic Urban Suburbs have the highest median household income of the types at $67,800.
Who Has a Pension Anymore?
Just 10% of the overall population have pensions — once a staple of the American workplace for loyal employees. Again, places that are whiter do better. The range runs from 8% for the African American South, Hispanic Centers, and Evangelical Hubs to 12% for the Middle Suburbs to as high as 13% for LDS Enclaves and Aging Farmlands.
Watch Disparities in Changing Economy
These financial investment disparities between white and nonwhite communities are worth new scrutiny as America’s demographic shifts continue apace and the economy keeps changing in the months and years to come.
As this contentious campaign season rolls on, the American Communities Project examines how voters see healthcare from recent polls of toss-up Senate elections in November, pointing out uninsured rates at or above the U.S. average as well as common health worries in the dominant community types in each state.
The twin bottom lines: Healthcare matters significantly to voters in the seven states below, and in several cases, keeping costs low is of greater concern than covering everyone.
Arizona
The Grand Canyon State’s uninsured rate: In 2017, 10.1% of Arizonans did not have health insurance, according to the Census. The U.S. average was 8.7%.
Health worries in Arizona’s prominent community type: Arizona is made up of 15 counties, including populous and diverse Maricopa, a Big City county that includes Phoenix. The uninsured rate here is 12%, according to the 2018 County Health Rankings. Access to primary care physicians is also a challenge.
Arizona voters’ healthcare views: In a CBS News/YouGov poll of 1,010 registered voters from Oct. 2-5, voters offered their views on the particulars of healthcare:
78% expressed “a lot” of concern about keeping costs down, 20% shared some “some” concern, and 2% reported “not much” concern.
72% said they are concerned “a lot” with access to treatments and medications, 23% reported “some” concern, and 5% said “not much.”
54% said they are concerned “a lot” about making sure everyone is covered, 29% said they had “some” concern, and 17% said “not much” concern.
How issues stack up: Healthcare is a significant issue in Arizona voters’ decision-making. 77% said a political candidate must agree with them on healthcare to get their vote. In comparison, 81% said a candidate must share their views on immigration, and 69% said a candidate needs to agree with them on taxes.
Healthcare and the horse race: Of registered voters, 43% said Kyrsten Sinema (D) is better on healthcare, 31% said Martha McSally (R) is better, and 17% said they are not sure yet. Overall, McSally garners 47% in the poll; Sinema stands at 41%.
Arizona’s 2016 presidential vote: Arizona ended in President Donald Trump’s column. He drew 48.1% of the vote to Hillary Clinton’s 44.6%.
Florida
The Sunshine State’s uninsured rate: In 2017, 12.9% were uninsured, according to the Census.
Health worries in Florida’s prominent community types: Florida has 67 counties, including 27 in Graying America. African American South is the next highest at 14.
In Florida, Graying America’s average uninsured rate is 17%. The community type’s access to primary care physicians is lower than the national average; injury deaths are particularly high in Graying America.
Meanwhile, the African American South counties in Florida have an average uninsured rate of 16% and struggle with access to care. The African American South has the second-highest premature death rate among all types (more than 10,000 years lost per 100,000 population). Obesity, insufficient sleep, physical inactivity, and smoking rates are high here as well.
How issues stack up: When Florida voters were asked about the national issues currently most important to them, “healthcare was the most frequently selected response, chosen by 17% of respondents,” according to the WCTV-TV poll of 800 likely voters conducted Sept. 17-30.
Horse race: Sen. Bill Nelson (D) is drawing 45%, while Gov. Rick Scott (R) is getting 44%.
Florida’s 2016 presidential vote: President Trump won Florida in a squeaker, 48.6% to Hillary Clinton’s 47.4%.
Missouri
The Show Me State’s uninsured rate: In 2017, 9.1% were uninsured, according to the Census.
Health worries in Missouri’s prominent community types: Missouri contains 114 counties. Working Class Country comprises 33 counties and Evangelical Hubs contain 24 counties.
Missouri’s Evangelical Hubs post an average uninsured rate of 14%. Hubs struggle with healthcare access, having fewer primary care physicians and mental health providers. Also, teen pregnancy is high in these counties.
At the same time, the average uninsured rate for Working Class Country in Missouri is 15%. Access to primary physicians and mental health providers is difficult.
How the issues stack up: In a CNN poll of 1,003 voters who are registered or plan to register by Election Day that was conducted Sept. 25-29, voters were asked to identify the issues that will be most important to them when deciding how to vote for U.S. Senate. Healthcare was first with 31% of respondents, the economy was second with 21%, and immigration was third at 12%.
Horse race: Sen. Clare McCaskill (D) takes 47%; Josh Hawley (R) is at 44%.
Missouri’s 2016 presidential vote: President Trump won 56.4% of the vote; Hillary Clinton received 37.9%
Montana
The Treasure State’s uninsured rate: In 2017, 8.5% were uninsured, according to the Census.
Health worries in Montana’s prominent community types: Montana is made up of 56 counties, 16 of which are classified as Graying America, 15 as Aging Farmlands.
In Montana, Graying America’s average uninsured rate stands at 16%. Graying America’s access to primary care physicians is lower than the national average; the community type’s injury deaths are particularly high.
In the state’s Aging Farmlands, an average of 17% of the population is uninsured. Aging Farmlands counties also struggle with poor access to primary care physicians and drunk driving deaths.
Other notable community types: Native American Lands and Rural Middle America
Montana voters’ healthcare views: In a CBS News/YouGov poll of 543 registered voters conducted September 10-14, voters shared their perspectives on four facets of the healthcare issue:
84% said they have “a lot” of concern about keeping costs down, 14% cited “some” concern, and 2% said “not much.”
72% said they have “a lot” of concern about making sure pre-existing conditions are covered, 19% said “some” concern, and 9% reported “not much” concern.
71% expressed “a lot” of concern with improving healthcare quality, 23% said “some” concern, and 6% said “not much.”
50% reported “a lot” of concern about making sure everyone is covered, 29% expressed “some” concern, and 21% reported “not much” concern.
Healthcare and the horse race: Of registered voters, 41% say Sen. Jon Tester (D) is better on healthcare, 35% say Matthew Rosendale (R) is better, and 17% are not sure yet. In the race, Tester stands at 47%; Rosendale is at 45%.
Montana’s 2016 presidential vote: President Trump clinched Montana with 55.6% of the vote. Hillary Clinton took 35.4%.
Nevada
The Silver State’s uninsured rate: In 2017, the uninsured rate was 11.2%, according to the Census.
Health worries in Nevada’s prominent community type: Nevada is composed of 16 counties, including Clark County, home of Las Vegas. Classified as a Big City county, Clark has an uninsured rate of 15%, according to the County Health Rankings. Access to primary care physicians is another challenge.
How issues stack up: 26% of Nevada’s likely voters said the top issue that might factor into their voting decision is economy and jobs; 25% said healthcare; 18% said immigration; and 9% said taxes and spending, according to an NBC/Marist Poll of 574 likely voters conducted from Sept. 30 to Oct. 3.
Horse race: Sen. Dean Heller (R) is at 46%; Jacky Rosen (D) stands at 44%.
Nevada’s 2016 presidential vote: Hillary Clinton captured Nevada with 47.9% of the vote to President Trump’s 45.5%.
Tennessee
The Volunteer State’s uninsured rate: In 2017, 9.5% of people did not have health insurance, according to the Census.
Health worries in Tennessee’s prominent community types: Tennessee is composed of 95 counties. Evangelical Hubs counties number 43 while 27 counties are classified as Working Class Country.
In Tennessee, Working Class Country’s average uninsured rate is 13%; Evangelical Hubs show a rate of 12%. Both community types struggle with access to primary care physicians.
Tennessee voters’ healthcare views: In a CBS News/YouGov poll of 1,002 registered voters conducted Oct. 2-5, voters were asked about their views on healthcare:
79% reported “a lot” of concern about keeping costs down, 18% cited “some” concern, and 3% reported “not much.”
75% were concerned “a lot” with access to treatments and medications, 21% expressed “some” concern, and 4% said they had “not much” concern.
56% expressed “a lot” of concern about making sure everyone is covered, 30% reported “some” concern, and 14% revealed “not much” concern.
How issues stack up: Healthcare is a big issue in Tennessee voters’ decision-making. 81% said candidates must agree with them on healthcare to get their vote. In comparison, 72% said candidates must share their views on immigration, and 71% said they have to agree with them on taxes.
Horse race: Rep. Marsha Blackburn (R) stands at 50%, and Gov. Phil Bredesen (D) is at 42%.
Tennessee’s 2016 presidential vote: President Trump won 60.7% of the statewide vote; Hillary Clinton took 34.7%.
Texas
The Lone Star State’s uninsured rate: In 2017, 17.3% of people did not have health insurance, according to the Census.
Health worries in Texas’ prominent community type: Texas is made up of 254 counties, 78 of which are categorized as Hispanic Centers. In these Texas counties, the average uninsured rate is 24%. Documentation troubles may be a reason for this high rate. Access to primary care physicians is also poor here.
Other dominant community types: Big Cities, Evangelical Hubs, Graying America, and Exurbs.
Texas voters’ healthcare views: In a CBS News/YouGov poll of 1,031 registered voters conducted Oct. 2-5, voters’ shared their opinions about healthcare:
52% said making sure everyone is covered concerns them “a lot,” 29% said “some,” 19% reported “not much.”
78% said keeping costs down concerns them “a lot,” 19% said “some,” 3% said “not much.”
69% said access to treatments and medications concerns them “a lot,” 23% said “some,” and 8% said “not much.”
How issues stack up: Healthcare is a crucial issue in Texan voters’ decision-making. 76% said candidates must agree on healthcare to get their vote. In comparison, 77% said the same about immigration, and 71% said candidates need to share their views on taxes to get their vote.
Horse race: Sen. Ted Cruz (R) is at 50%, while Beto O’Rourke (D) receives 44%.
Texas’ 2016 presidential vote: President Trump carried Texas with 52.2% of the vote. Hillary Clinton received 43.2%.
Methodology
To calculate the dominant community type averages, the American Communities Project looked at the insurance rates by county broken up into the ACP’s 15 community types by the County Health Rankings team. After adding all the state’s counties and uninsured percentages in each type, we divided the community type’s total uninsured rate by the number of counties in that type.
Your community is more than your home; it defines your life, from job opportunities and consumer choices, to the quality of education, to air quality and exercise options. And just a few miles can make a dramatic difference.
The chart below is interactive. You can choose the indicator you want to explore, from uninsured rates to premature death, by scrolling through the options in the box in the top left. The black line within each type represents its median value. You can also search for any county in the country by entering its name in the “Find a County” box. The chart shows not only the differences in the community type medians but also how communities are clustered in some types and spread across the line in others.
The place you live is more than your home; it defines your life, from job opportunities and consumer choices, to the quality of education, to air quality and exercise options. And just a few miles can make a dramatic difference. The American Communities Project combined its community types with data from the County Health Rankings to explore the intersection of health and geography in the United States in 2018.


