
The Income Gap’s Impact on Life Expectancy
You might expect that some groups of people will live longer than others — women live longer than men, non-smokers live longer than smokers, and librarians live longer than coal miners. But what about differences based on where you live and your income?
According to data developed by the United States Small-Area Life Expectancy Estimates Project (USALEEP) and analyzed by the City Health Dashboard team, residents of Gary, Indiana, the city with the shortest life expectancy and part of the Middle Suburbs in Lake County, live an average of 71.4 years, while residents of Newton, Massachusetts, the city with the longest life expectancy and part of the Urban Suburbs in Middlesex County, live an average of 84.7 years. And there are huge gaps between the neighborhoods with the longest and shortest life expectancies. In Gary, people who live just west of Marquette Park live on average to 77, while just a few miles west, residents live an average of 64 years.
What’s Behind the Gaps
Factors such as crime, environmental toxins, and the availability of safe and affordable housing can all impact people’s ability to live long, healthy lives. Researchers are also now looking closely at the impact that income inequality has on how long and well people live. According to new data from the U.S. Census Bureau, the gap between the rich and poor is the widest it has been in 50 years. Income inequality is associated with poor health outcomes for city residents, such as higher heart failure rates and poorer mental health. The potential effect on life expectancy seems clear.
What the Data Say About Income Inequality
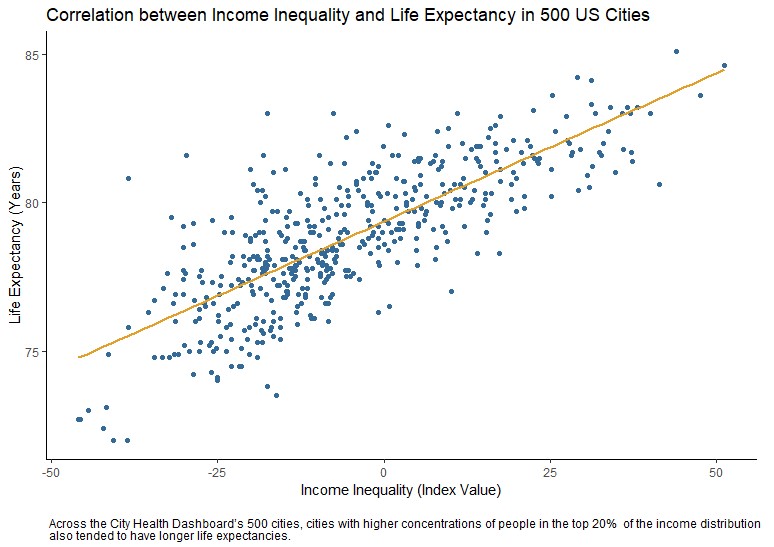
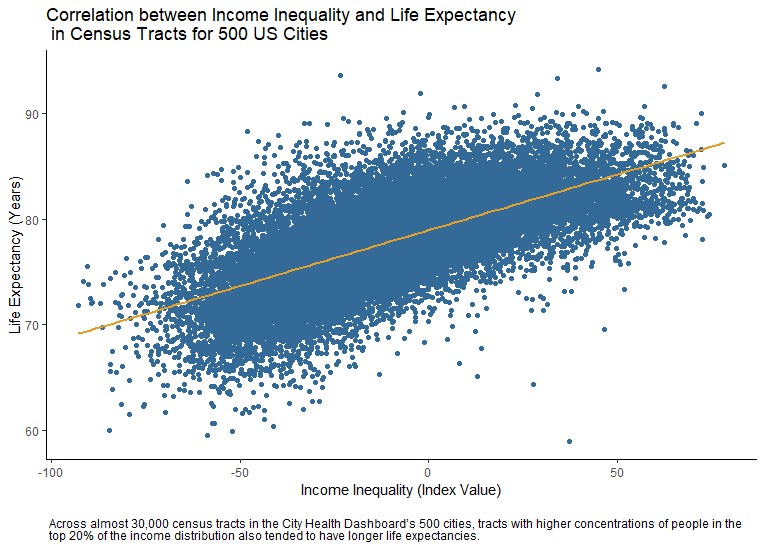
To better understand the impact on life expectancy, the Dashboard team dug into our measure of income inequality, which looks at the concentration of households in the bottom 20%, those making less than $25,000 per year, versus the top 20%, those making more than $125,000 per year, of the national income distribution in a city or neighborhood. We found that cities with higher concentrations of households in the top 20% tended to have longer average life expectancies. While these city averages are important, the Dashboard lets you dig deeper and look at neighborhood-level differences within a city to view income inequality and its impact on life expectancy or other factors that affect health. We saw the same conclusions about income inequality as we dug deeper. Neighborhoods with higher concentrations of people in the top 20% of economically privileged people again had longer average life expectancies, although the correlation was not quite as strong.
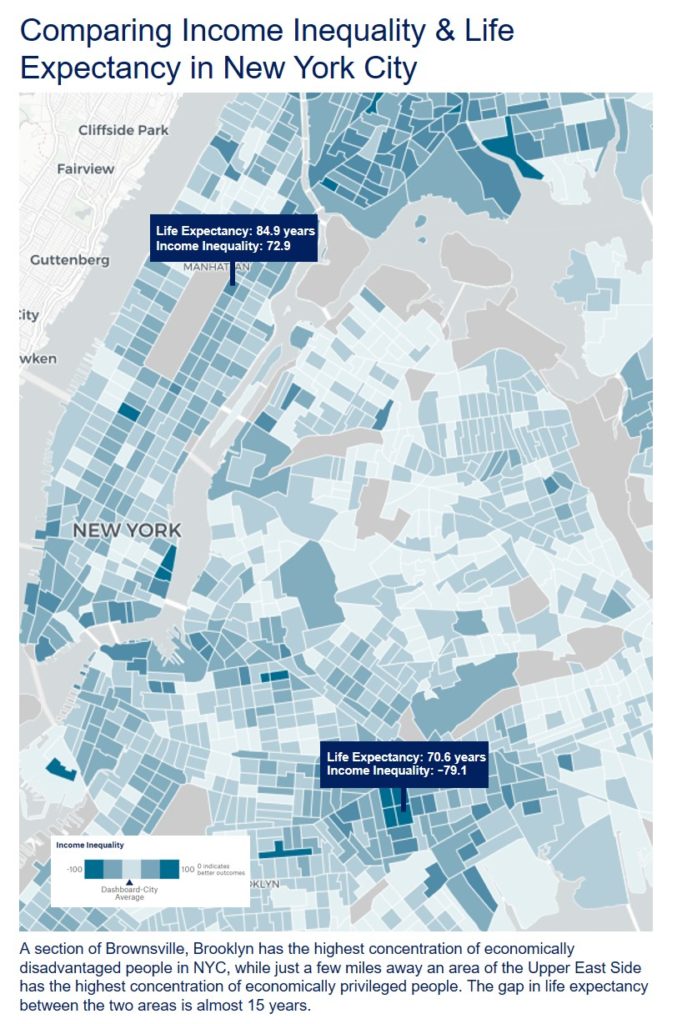
For example, in New York City (a Big City), one section of Brownsville, Brooklyn has the highest concentration of economically disadvantaged people in the city, while a section of the Upper East Side has the highest concentration of economically privileged people. Looking at life expectancy in these same areas, there is an almost 15 year difference, with residents of this portion of Brownsville living an average of 70.6 years and residents of this portion of the Upper East Side living an average of 84.9 years. Although these analyses cannot tell us exactly what is causing this pattern, these results indicate that income inequality can have a substantial impact on life expectancy.
What Are Some Solutions?
There are a number of policy solutions that cities can implement to begin to address income inequality. Here are a few:
- Inclusionary zoning, which mandates that a certain portion of new development is set aside of low- and moderate-income housing, can counteract historic policies that effectively blocked poorer residents from accessing safe, affordable housing and quality schools located in higher-income neighborhoods.
- Living wage laws can increase incomes and lift people out of poverty.
- Community-led initiatives, such as early childhood education programs and sector-based workforce training programs, can make an impact on reducing income inequality in disadvantaged neighborhoods.
These types of programs and policy changes can help to reduce income inequality, and give everyone, no matter where they live or how much money they make, a fair and just opportunity to live a long and healthy life.


Dr. Shoshanna Levine (left) is the program director for the City Health Dashboard in the Department of Population Health at the NYU School of Medicine. She and her team bring data on 37 measures of health and its drivers at the city and neighborhood levels to the 500 largest U.S. cities, those with a population of 66,000 or greater, to guide local solutions that create healthier and more equitable communities.
Dr. Ben Spoer (right) manages the data team at the City Health Dashboard, gathering, analyzing, validating, and making available public health and social determinant data on the Dashboard. Dr. Spoer’s research focuses on exposure measurement, geospatial methods, and social determinants of health.
Additional support for this blog was provided by Peggy Hsieh and Samantha Breslin.