How Broadband Access Challenges Can Unite Rural and Urban Communities
Think about your typical day at work, the last time you wanted to learn more about an issue in the news, accessing test results after a doctor’s visit, or applying for a new job, healthcare benefits, or school for your children. Would you be able to accomplish these without access to the internet? The answer is probably no.
However, a large proportion of Americans do not have reliable access to high-speed broadband internet. Internet access is a key component of modern life, where school, work, healthcare, and social and political discourse all occur. The lockdown days of the Covid-19 pandemic heightened our awareness of this and pushed even more resources and opportunities onto the internet, allowing people to stay connected even when they could not physically access the people or resources they needed. However, this also furthered the digital divide, with communities already facing the greatest challenges being further left behind without access to reliable, high-speed broadband connections.
The reasons for this lack of access across communities are multifaceted. In rural communities, the biggest barrier is the lack of broadband infrastructure, while urban communities tend to suffer from issues of high cost and digital literacy (although infrastructure may be an issue in urban communities as well). Urban communities also tend to have disparities in access by race and ethnicity, with majority-Black and Hispanic communities facing connection rates of 59% and 65.4%, respectively, compared to an average of 81.2% in majority-white communities.
There can be policy solutions on the federal level that address these disparities, such as the 2021 infrastructure bill that allocated $65 billion to broadband infrastructure, but further progress requires gaining a clearer understanding of which communities are connected and which are not.
Parsing Population Density
New data presented on the Congressional District Health Dashboard (CDHD) looks at differences in broadband access by congressional district and how density might impact access. The CDHD presents 36 metrics on health and its drivers calculated at the congressional district level for all 435 U.S. congressional districts (and Washington, DC). Data is presented for the 118th Congress sworn in in January 2023, using boundaries updated from the 2020 Census. Building on work originally done by CityLab in 2018, the new 2022 CDHD District Density Index (DDI) categorizes all districts on the following gradient of six categories:
- Pure Rural (lowest household density)
- Rural-Suburban Mix
- Sparse Suburban
- Dense Suburban
- Urban-Suburban Mix
- Pure Urban (highest household density)
This work adds texture and layers to conversations that generally only focus on urban-rural divides. The majority of the U.S. population lives in suburbs, not pure rural or urban communities, and the importance of the suburbs has become even more evident in recent elections. The DDI allows policymakers, researchers, and others to have a more nuanced understanding of where people live and compare outcomes by these types of communities.
An Opportunity to Come Together
According to the CDHD, across the U.S., 72% of households were connected to high-speed broadband internet in 2021. Digging deeper and looking at broadband access by DDI categories shows two interesting trends. First, unsurprisingly, Pure Rural districts have the least amount of broadband connection at only 62% of households, highlighting, once again, this persistent divide.
Second, though Pure Urban districts have a connection rate of 73%, slightly higher than the national connection rate, Urban-Suburban Mix and Dense Suburban districts, which tend to surround Pure Urban districts, both have connection rates of 76%, despite their geographic proximity. This may represent historic disinvestment in central cities compared to their surrounding suburbs.
While overall, these Pure Urban districts have greater access than Pure Rural districts, the disparities represented across short geographic distances invites further inquiry. It may present an opportunity for Pure Rural and Pure Urban communities, generally seen as polar opposites, to come together around a common opportunity to improve outcomes for residents. Focusing on districts in the state of Illinois can illustrate these phenomena and the patterns seen across the country.
Case Study of Contrasts: Illinois
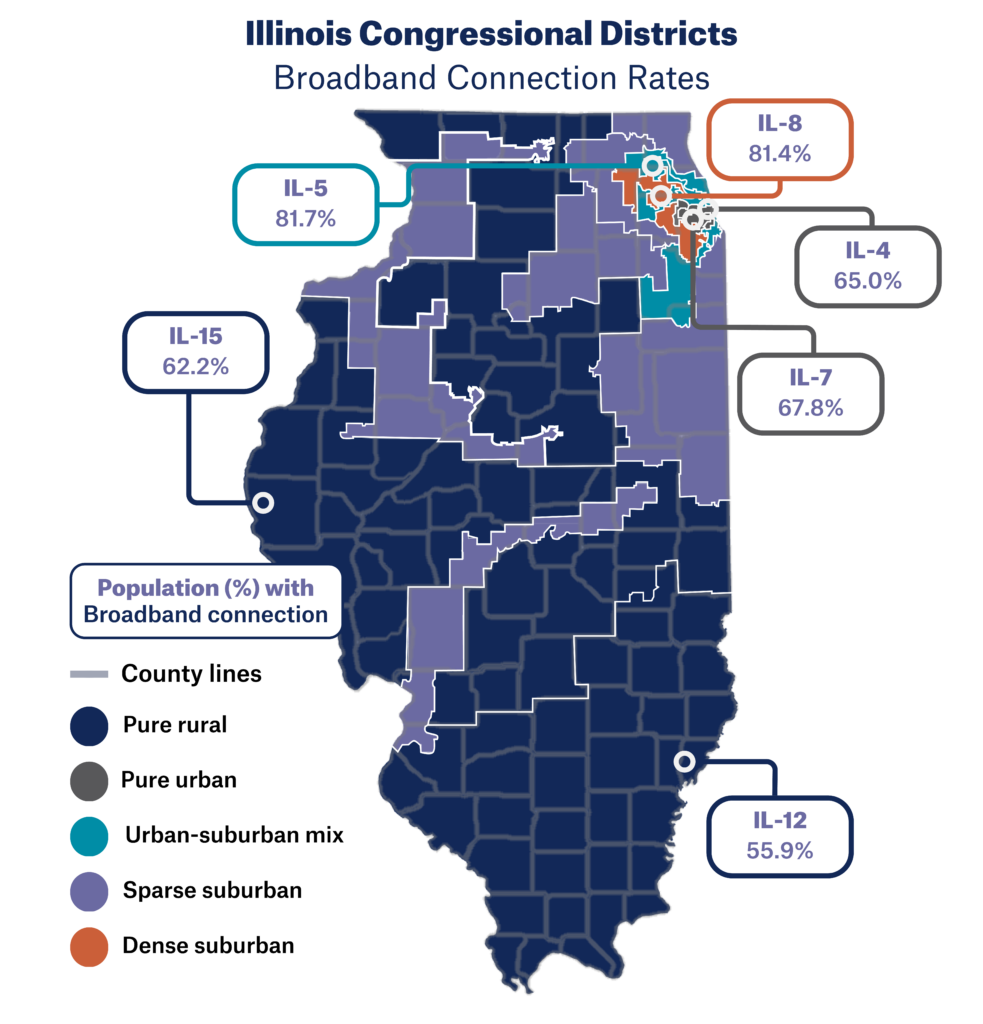
Illinois had an estimated 71.8% of households connected to high-speed broadband internet in 2021, almost exactly the same as the national connection rate. Looking at our first trend, Pure Rural congressional districts in the state, like Illinois 12th and Illinois 15th, have the lowest rates of broadband connection across the state, at 55.9% and 62.2% respectively.
The 12th and 15th districts encompass many counties in the state’s southern and western parts, mainly Working Class Country and Rural Middle America counties, according to American Communities Project’s community types. These counties tend to be less diverse with household median incomes and college attainment rates below the national average. Working Class Country and Rural Middle American counties also voted strongly Republican in recent presidential elections.
Digging into our second trend, there is an interesting story in contrasts around the city of Chicago. Illinois 4th and 7th districts have some of the next lowest rates of broadband connection, at 65.0% and 67.8%, respectively. These districts include parts of Cook County, a Big City, and parts of DuPage County, an Urban Suburb. Big Cities are very diverse, both racially and economically, with pockets of extreme wealth and extreme poverty. Urban Suburbs are also quite diverse and tend to have high incomes and large amounts of college degrees. These districts and the counties contained in them make up some of the densest areas of the state.
However, right next to these districts are the less dense Illinois 5th and 8th, Urban-Suburban Mix and Dense Suburban districts, respectively. These districts consist of more suburban parts of Cook and DuPage counties, as well as Lake and Kane counties, which are Urban Suburbs. Illinois 8th has a connection rate of 81.4%, and Illinois 5th has a connection rate of 81.7%, both much more connected than the districts right next door. On a map, Illinois 5th and 8th districts are the more “traditionally suburban” areas of the Chicago metro area, and the contrast with the denser Pure Urban districts is stark. Big City counties tend to be the most Democratic across the nation, and Urban Suburb counties also vote strongly Democratic.
More in Common
Putting all of this together, when looking at broadband trends, Illinois 4th and 7th (composed of Big City and Urban Suburb counties) may have more in common with Illinois 12th and 15th (largely composed of Working Class Country and Rural Middle America counties) than with Illinois 5th and 8th (composed of Urban Suburb counties). Despite the geographic, political, and ACP type overlap, the Pure Urban and Pure Rural communities may find more in common and be able work together to find solutions.
Recent federal policy efforts have endeavored to expand broadband access to communities across the nation, but more needs to be done. Efforts in the individual states and abroad to treat broadband as a public utility may be promising strategies to lessen the national digital divide here in America. This new data provided by the Congressional District Health Dashboard can support these efforts, allowing Representatives from districts that might be on the opposite side of the aisle to come together to make more informed decisions and around policies for the collective good of their communities.
 Shoshanna Levine, DrPH, is an independent consultant, working on projects that explore how social drivers, such as access to quality education, safe and affordable housing, broadband connection, and others, impact the ability for everyone to live healthy lives. She believes in the power of data and storytelling to drive change in communities everywhere. She lives in Brooklyn, New York, in the 10th district.
Thanks to Alex Chen, a Congressional District Health Dashboard data analyst who provided analytic support for this work.