
Housing Costs Eat Up Family Budgets — But So Does Vast Inequality
Across the country, communities of all sizes are struggling with affordable housing shortages, which have increased dramatically over the past 40 to 50 years. The situation is especially bad in urban areas. In the nation’s 500 largest cities, 37% of households pay more than 30% of their household income on rent, compared to 25.3% on average nationally.
Looking at the distribution of excessive housing cost across cities with populations of 66,000 or more, a clear pattern emerges. Coastal cities tend to have higher than average rates of excessive housing costs than those in the middle of the country.
Explore the map below to see housing burdens across the U.S.

Understanding what housing affordability looks like is key to addressing it. The City Health Dashboard — an online resource presenting 37 measures of health and its drivers for 500 U.S. cities with populations of 66,000 of greater — displays an excessive housing cost measure that shows the percentage of city residents spending 30% or more of their income on housing costs. This measure captures the combined effects of both rent and mortgage costs and local income levels because it looks at housing costs relative to income levels. People paying high rents that they can afford are not counted, while poorer people living in relatively inexpensive housing that they cannot afford are counted. This can provide greater insight than a direct measure of housing cost.
Why a Strain of Housing Costs in Smaller Locales?
It’s no surprise that Big Cities like New York, Boston, and Los Angeles have high housing costs. It’s important to look deeper, though, to understand that these cities are not alone. About 40% of residents in Savannah, Georgia (within Chatham County, an Urban Suburb), Birmingham, Alabama (within Jefferson County, an African American South county), and Wilmington, North Carolina (within New Hanover County, a College Town), spend more than 30% of their income on housing. These smaller southeast cities are typically perceived as “affordable.” But when incomes are lower — as they tend to be in these places, on average — housing costs quickly eat up a larger proportion of a family’s take-home pay, leaving less to spend on medical care, healthy food, and other necessities, which can lead to poorer health.
It’s not just discretionary income that’s important to health. How much you make compared to those living around you can also affect your health. Income inequality is growing in the United States, and high income inequality is linked with shorter lifespans, poorer mental health, and other negative health outcomes.
Going back to our three southeast cities: On top of having higher than average housing cost burdens, they also have more concentrated poverty and shorter life expectancies than the average of the 500 cities measured by the Dashboard. We know these factors are interconnected, and that high housing cost burden and income inequality are strong drivers of worse community health.
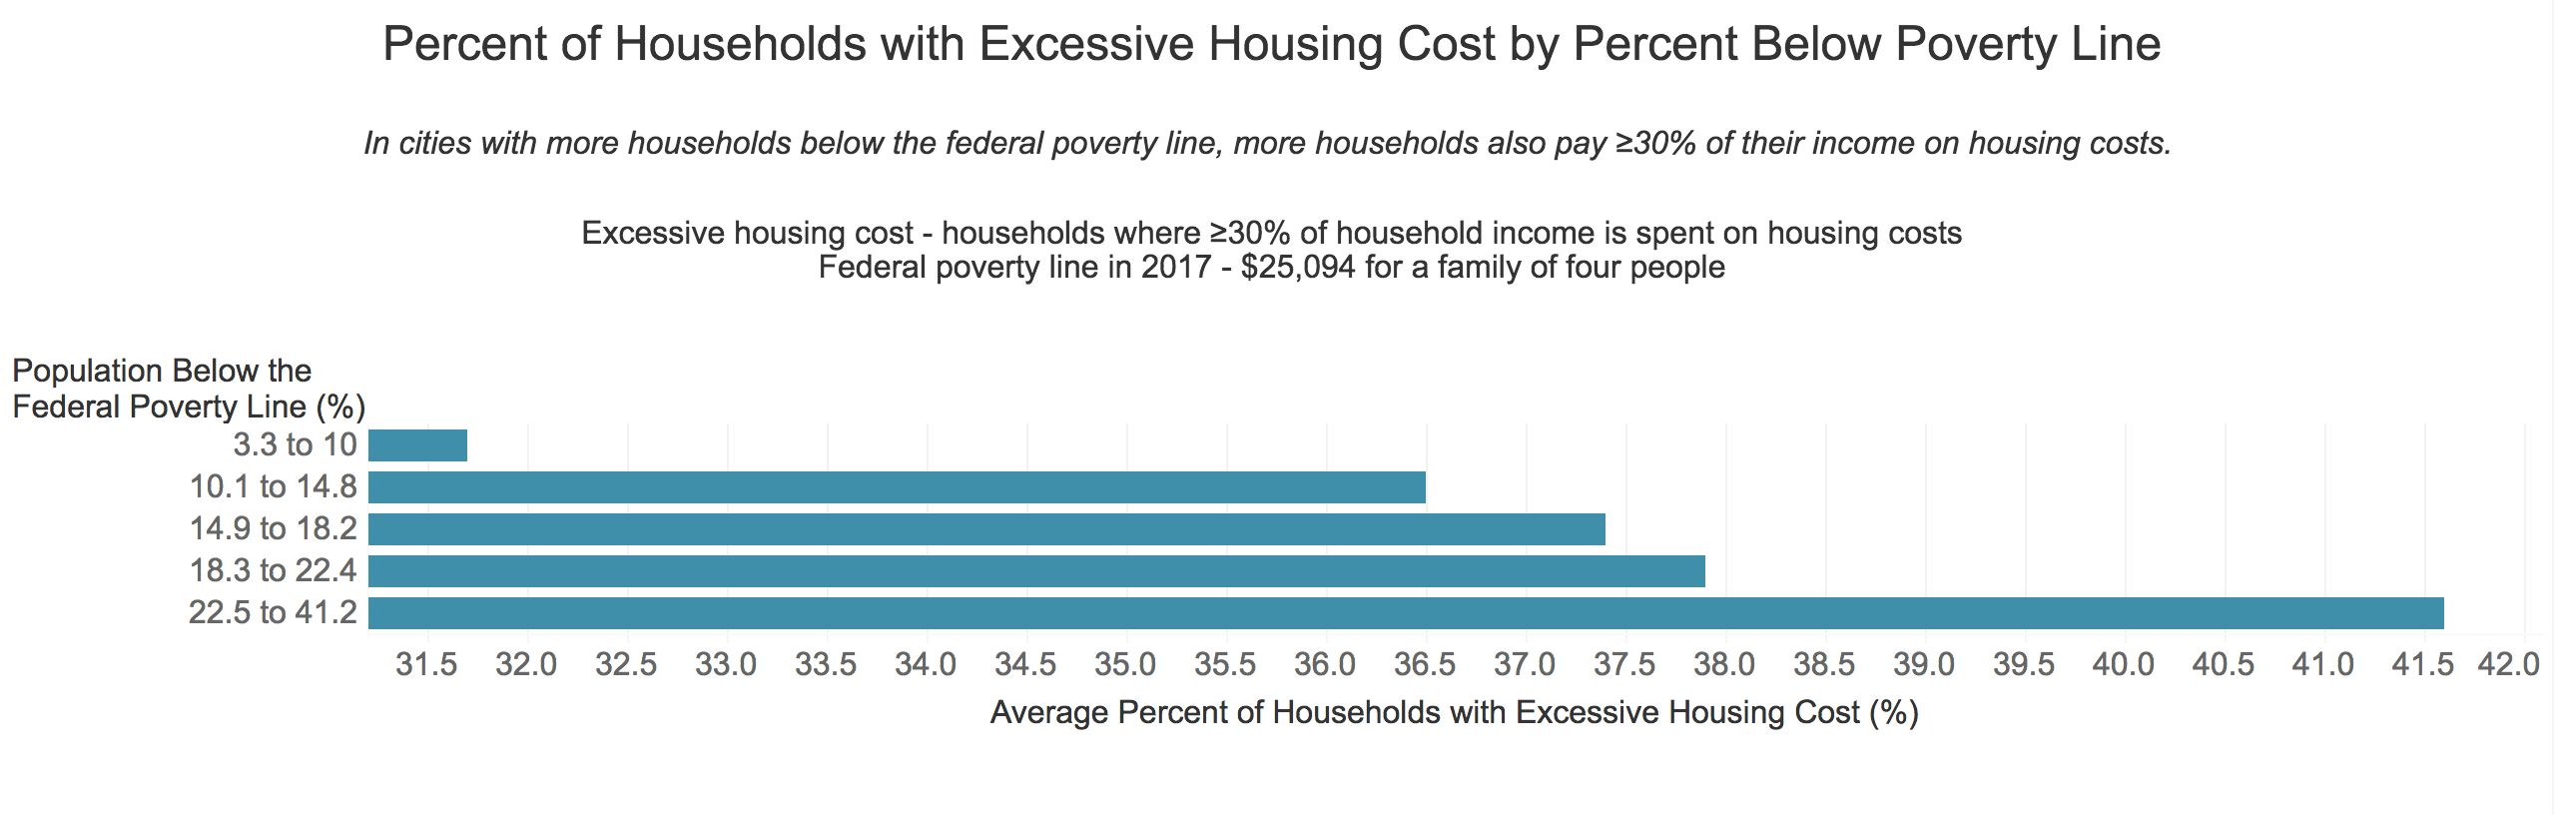
Why the Tie Between Income Inequality and High Housing Cost Matters
Looking more closely at the Dashboard measures, there appears to be a link between income inequality and excessive housing cost. In cities with higher concentrations of low-income households, more people spend more than 30% of their income on housing. This makes sense when we think about the interconnectedness of housing cost burden and income. It’s not just about expensive neighborhoods where people spend higher proportions of their income on rent. In the cities we have highlighted above and in cities across the country, low-income families have seen a much steeper rise in housing costs over time and are paying a greater share of their income on rent than better off families, in part because the actual rent and housing costs don’t differ much for lower- and middle-income Americans. So where there are concentrations of poverty, there tend to be higher concentrations of housing cost burden.
Just because these two factors move together, though, does not mean that one causes the other. However, it suggests a pattern that may help in diagnosing the problem and understanding the conditions shaping health in these communities — and, perhaps most importantly, finding solutions, which is not easy to do. It takes a comprehensive approach that considers how both income and income inequality affect people’s ability to afford housing. Although housing-focused initiatives are an obvious and necessary choice, job training, progressive tax policy, and other poverty-focused initiatives can also have huge and positive impacts.
Explore resources and data on housing, income, and 35 other measures of health and its drivers, at cityhealthdashboard.com.
 Shoshanna Levine is the program director for the City Health Dashboard in the Department of Population Health at the NYU School of Medicine. She and her team bring data on 37 measures of health and its drivers at the city and neighborhood levels to the 500 largest U.S. cities, those with a population of 66,000 or greater, to guide local solutions that create healthier and more equitable communities. Analytic support for this blog was provided by Allegra Wilson, Benjamin Spoer, and Miriam Gofine.