Covid-19 Brings Economic Pain in Urban Communities
The biggest impacts of the Covid-19 pandemic are as much about economics as they are about health. Months into the pandemic, many jobs lost in the United States still have not returned. A look at employment numbers through the American Communities Project’s 15 types shows urban areas are feeling some of the harshest effects.
The unemployment rates in the Big Cities, Urban Suburbs, and Middle Suburbs in August were all still above the national rate of 8.5%, according to Bureau of Labor Statistics data (that’s not seasonally adjusted, which is how county data is gathered). Also in the higher-than-average category were two big and generally rural community types of color, Hispanic Centers and Native American Lands.
But unemployment rates don’t tell the whole story. Some communities have also seen steep drops in the number of people in the labor force. In Big Cities and Urban Suburbs alone, there were 1.7 million fewer people in the labor force in August compared with February.
Together, the numbers reveal the larger impact of the pandemic and suggest a long road ahead to recovery, with communities facing different sets of challenges going forward. Furthermore, urban areas in the ACP have tended to be the best economic performers. Their economic struggles could portend deeper long-term problems for the U.S. economy.
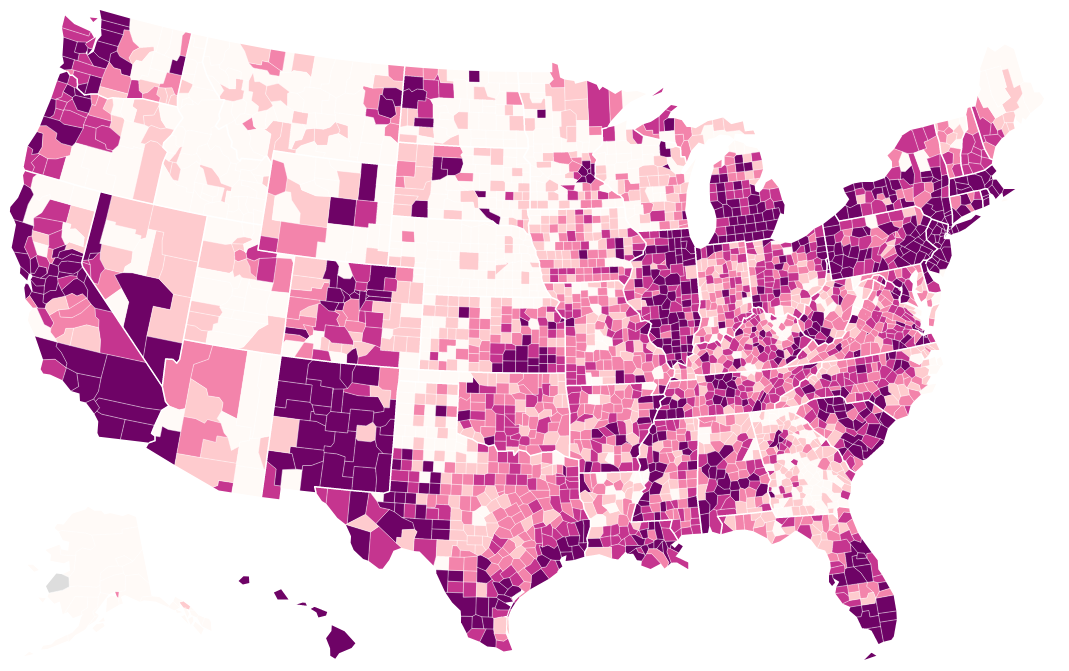
The map below shows the unemployment change from February to August as well as the workforce change in that time. Remember that point increases are bad for a county’s unemployment status, while negative numbers are good (it means the rate declined in that time). The opposite is true with the labor force; a decline means people left the labor market.
This post is the first supported by a new two-year grant from the Robert Wood Johnson Foundation that will explore the pandemic’s impacts on America’s physical and socioeconomic health through the lens of the ACP.
The Rebound and the Stall in Urban Communities
After the initial wave of the pandemic hit the United States in March, the country temporarily shut down and unemployment rates spiked everywhere. In April, 13 of the 15 county types in the ACP had double-digit unemployment — from 17.6% in the Middle Suburbs to 11.9% in the Native American Lands. The only two types that escaped that steep of a spike: LDS Enclaves and Aging Farmlands.
As states began to reopen, the numbers turned around quickly. By June only five types were in double-digits, and by August there were only two: Big Cities and Hispanic Centers.
But a closer look at the numbers shows why there is not a lot to celebrate.
The unemployment rate is still up by more than two points since February in 13 of the 15 county types — everywhere but LDS Enclaves and Aging Farmlands. That’s a lot of lost jobs, a lot of lost paychecks, and a lot of pain in communities across the country.
And again, the biggest increases in unemployment in that time came in the Big Cities, Urban Suburbs, and Middle Suburbs. The increases in those types were 7.1 points, 5.7 points, and 4.4 points respectively.
Behind those sharp increases may be the nature of those communities. While they tend to drive the national economy with their local GDPs, wealth is not spread evenly. Big Cities and Urban Suburbs in particular hold a true mix of economic diversity. They are marked by populations that are rich and poor, well-educated and less-educated. Those populations combine to create dynamic, multifaceted economies with creative and service elements.
There are people who work high-skill jobs and have high levels of education. Their high incomes help create a service economy full of restaurants, coffee shops, gyms, and transit workers.
During the pandemic, one side of that economy is still fairly active, as high-paying jobs move from the downtown office to the home office. But the service side of the economy is taking a hit. Empty offices mean empty coffee and lunch spots. Even places still open likely have fewer hours to offer workers.
Notably, the Exurbs, more far-flung and affluent suburbs, have done better in relative terms. Exurbs’ 6.6% unemployment rate in August was still up from February, but only by 3.4 points. Exurbs’ economic conditions tend to have less peaks and valleys.
The unemployment struggles in these urban locales seem likely to carry on through the pandemic until a vaccine or better treatments emerge. The lesson so far: Places driving the nation’s economy can remain productive in the broadest sense, but the workers that serve that economy cannot.
In the coming months, the ACP will look at housing issues like mortgage foreclosures and evictions to better understand how these communities are coping with the prolonged economic hardships.
Struggles in Communities of Color
Beyond these urban areas, some of the biggest increases in unemployment in the ACP came in more rural communities with large populations of color. Both the African American South and Hispanic Centers saw unemployment increases of 3.5 points or more from February through August. For Native American Lands, the increase was smaller at 2.8 points, but this community type’s unemployment rate is consistently above the national average.
Indeed, all of these communities with large racial and ethnic minority populations face long-term challenges that the virus seems to exacerbate. The August unemployment rate in Hispanic Centers was 10%. It was 9.5% in the Native American Lands. While the African American South fared a little better, the 8% rate is not much comfort to communities where incomes tend to be lower and economic problems have deeper roots.
In fact, outside of Big Cities, Urban Suburbs, and Middle Suburbs, the three ACP types with large communities of color had the highest unemployment rates. And that could mean steep challenges ahead.
Hispanic Centers, Native American Lands, and the African American South should hold some advantages in dealing with the spread of the virus. Because the communities are more rural, social distancing should be easier, meaning the virus could have less impact. But other challenges make these communities more vulnerable. Their housing situations are often more uncertain and with extended families often under one roof. In addition, these communities tend to hold populations with more underlying health conditions and lower numbers of people with health insurance. And many of these communities have higher-than-average unemployment rates.
The inequities embedded in the nation’s urban areas are problematic, but it’s easier to imagine those communities coming back to life once the virus subsides. The economic engine continues running in those urban places — it’s just revving at a lower rate. In these more rural minority communities, where economic growth is harder to achieve, the impacts of the virus could be harder to overcome. In some places it may be about restarting the engine, not just getting it back up to speed.
For instance, the unemployment rate in Todd County, South Dakota, a Native American Lands community, was only up 1 point from February to August, but the unemployment rate was still 7.6%, which means it started from a relatively high rate compared to the nation as a whole.
Concerns About the Labor Force
On top of all these unemployment changes are the differences in the labor-force population between February and August. The number of people seeking employment dropped across all 15 of the ACP types — and some drops were steep.
More than 900,000 fewer people were in the labor force in the Big Cities. There was a drop of more than 800,000 in the Urban Suburbs. In the Exurbs, the drop was more than 400,000.
Because these county numbers are not seasonally adjusted, we checked other years to see if there was any other possible cyclical reason for those declines and did not find strong evidence for it. In 2017, for instance, only three community types saw a drop in labor force over the same period, the African American South, Evangelical Hubs, and Native American Lands. Other saw big increases in their labor force, including Graying America, which holds many summer vacation destinations.
In other words, the size and uniformity of these labor-force drops seems connected to the pandemic. There could be a number of factors behind the declines. One may be that K-12 schools shifted to distance learning this year. Children doing their schooling at home need supervision — sometimes even “working at home” doesn’t allow parents the time they need to oversee instruction.
And, of course, much of the labor-force decline may be due to fewer employment opportunities. Those who worked as food servers or baristas or bartenders in those more urban environments may have simply opted out of the labor market. The labor-force drop in College Towns is likely tied to a smaller number of students being on campus this fall, where they would be local employees and customers.
But the net result is the same. The drops mean the unemployment rate increases don’t capture the full impact of the virus in these communities. There are fewer paychecks flowing into household bank accounts, which means they have less money to spend, which in turn means employers need fewer employees to serve fewer customers.
If you add labor-force losses to the unemployed numbers in the community types, the numbers climb much higher. The labor-force drop in the Big Cities would increase the unemployment numbers by 20%. In the Urban Suburbs, the unemployment increase would be even bigger, about 26%.
All these data send a clear message: The “economic rebound” from Covid-19 over the summer was not close to a return to normal. Even in urban communities, where some workers talk about the perks of working from home, there is serious economic hardship.
And as winter nears and cases rise nationwide, the next few months could be rough ones across communities.