by Elizabeth Sherwood, Ari Pinkus and Dante ChinniOctober 03, 2018Print
Listed here are the main Health Report findings for the 10 ACP community types the Project didn’t visit for this report. On the bottom of the page is a link to download the health data by community type.
Aging Farmlands: The 161 counties in this group are set on the Great Plains. They are small and rural communities, with only about 3,500 people per county and 92% occupying rural land, according to the U.S. Census. These counties are the oldest on average in the ACP, with more than 23% over the age of 65, and the least diverse racially and ethnically. The Farmlands are 92% white and about 4% Hispanic. These areas experience low rates of higher education. Only 19.6% have a college degree, compared to the national average of about 30%. Though these areas are not prone to excessive drinking, the percentage of driving deaths involving alcohol is 33%, 14% higher than the national average. Access to healthcare is difficult in these communities: The ratio of population to primary care physicians outpaces the national average by more than 1,000:1.
College Towns: These 154 counties are scattered around the country and are generally located near large colleges and universities. Filled with college students, about 8% of the population sits between the ages of 18 and 21 — far higher than any other type. They are also less diverse than the nation as a whole, about 80% white, 7% black and 7% Hispanic. These counties hold a large number of college graduates; 36% have at least a bachelor’s degree, more than any other community type. Despite high levels of education, average median household income in College Towns sits slightly below the national average at $52,100. Access to healthcare in these communities is greater than in other places, with nearly 200 fewer people per primary care physician than the national average. Similarly, the average ratio of population to mental health providers is 359:1, compared to the national average of 470:1. Despite a large population of young adults, excessive drinking only exceeds the national average by 2%.
Evangelical Hubs: Evangelical Hubs are concentrated heavily in the South, forming a belt that spans from Texas to North Carolina. The key distinguishing characteristic for these 372 counties is the high number of religious adherents tied to evangelical churches like the Southern Baptist Convention. Beyond religious ties, a few additional factors drive community culture here: They are less diverse (82% white), and have lower incomes (a median of about $42,700) and lower education levels (about 16% have a bachelor’s degree or more). Access to healthcare in these communities is low, with nearly twice the population per primary care physician and mental health provider than the national averages. Evangelical Hubs are also a leader in teen pregnancy, with a rate of 46 births per 1,000 females ages 15 to 19, nearly twice the national average.
Graying America: Fairly rural and scattered around the country, these 364 counties are full of retirees and those nearing retirement age. Graying America is middle-income, about $47,800 annually for the median household. But, of course, a big defining factor is age. Almost a quarter of everyone in these counties, 24%, are 62 years of age or older; only 19% are under 18. Nearly 80% are white. Healthcare is harder to come by in these areas, with an additional 393 people per primary care physician than the national average. Additionally, injury deaths are particularly high, 94 compared to the national average of 65 deaths due to injury per 100,000 people. Despite a high percentage of the population meeting retirement age, unemployment hovers slightly above the national average by about 1%. The people here also have fewer opportunities to exercise, with 72% having adequate access to exercise facilities compared to the national average of 83%.
LDS Enclaves: Based around Utah and the Mountain West, these 41 counties are the centers of the nation’s Mormon population. The Enclaves are one of the least diverse types, with a population that is 87% white and .5% African American — 9% of the population identifies as Hispanic. The LDS Enclaves are one of the youngest types in the ACP, with 29% of the population under the age of 18. They are middle-income with an average median of $55,600 annually. The people here are fairly well educated, with just over 30% holding at least a bachelor’s degree. Likely due to the large LDS population, there is less excessive drinking in these communities, 4% below the national average. Safety is evident in these communities as well. Reported violent crimes per 100,000 people averages only one-third of the national average.
Military Posts: Marked by the presence of troops and bases, these 89 counties are located largely in rural locales. Their military ties make them relatively young, with only 13% of the population 62 years of age or older. And they feature a larger African American population than average, 16%. The median income in Military Posts sits just above the national average at $57,700. More than a quarter of the people in these communities have a college degree. Health behaviors are not positively emphasized here. These communities report 6% more alcohol impaired driving deaths per 100,000 population than the national average. Adult obesity sits 4% above the national average and physical inactivity hovers just above the national average as well.
Native American Lands: Dotted primarily across the west, these 43 counties are marked by large Native American populations — more than half the people who live in these counties overall are indigenous Americans. College education rates and income are low in these counties. On average, only 14% have a college degree, and the median household income is about $41,700. People have limited access to exercise opportunities, with only 41% of the population receiving adequate access to facilities for physical activity. Combined with other factors, lack of exercise contributes to a high adult obesity rate at 8% above the national average. Likely due to poor health behaviors, nearly one quarter of the population reports fair or poor health, well above the national average of 16%.
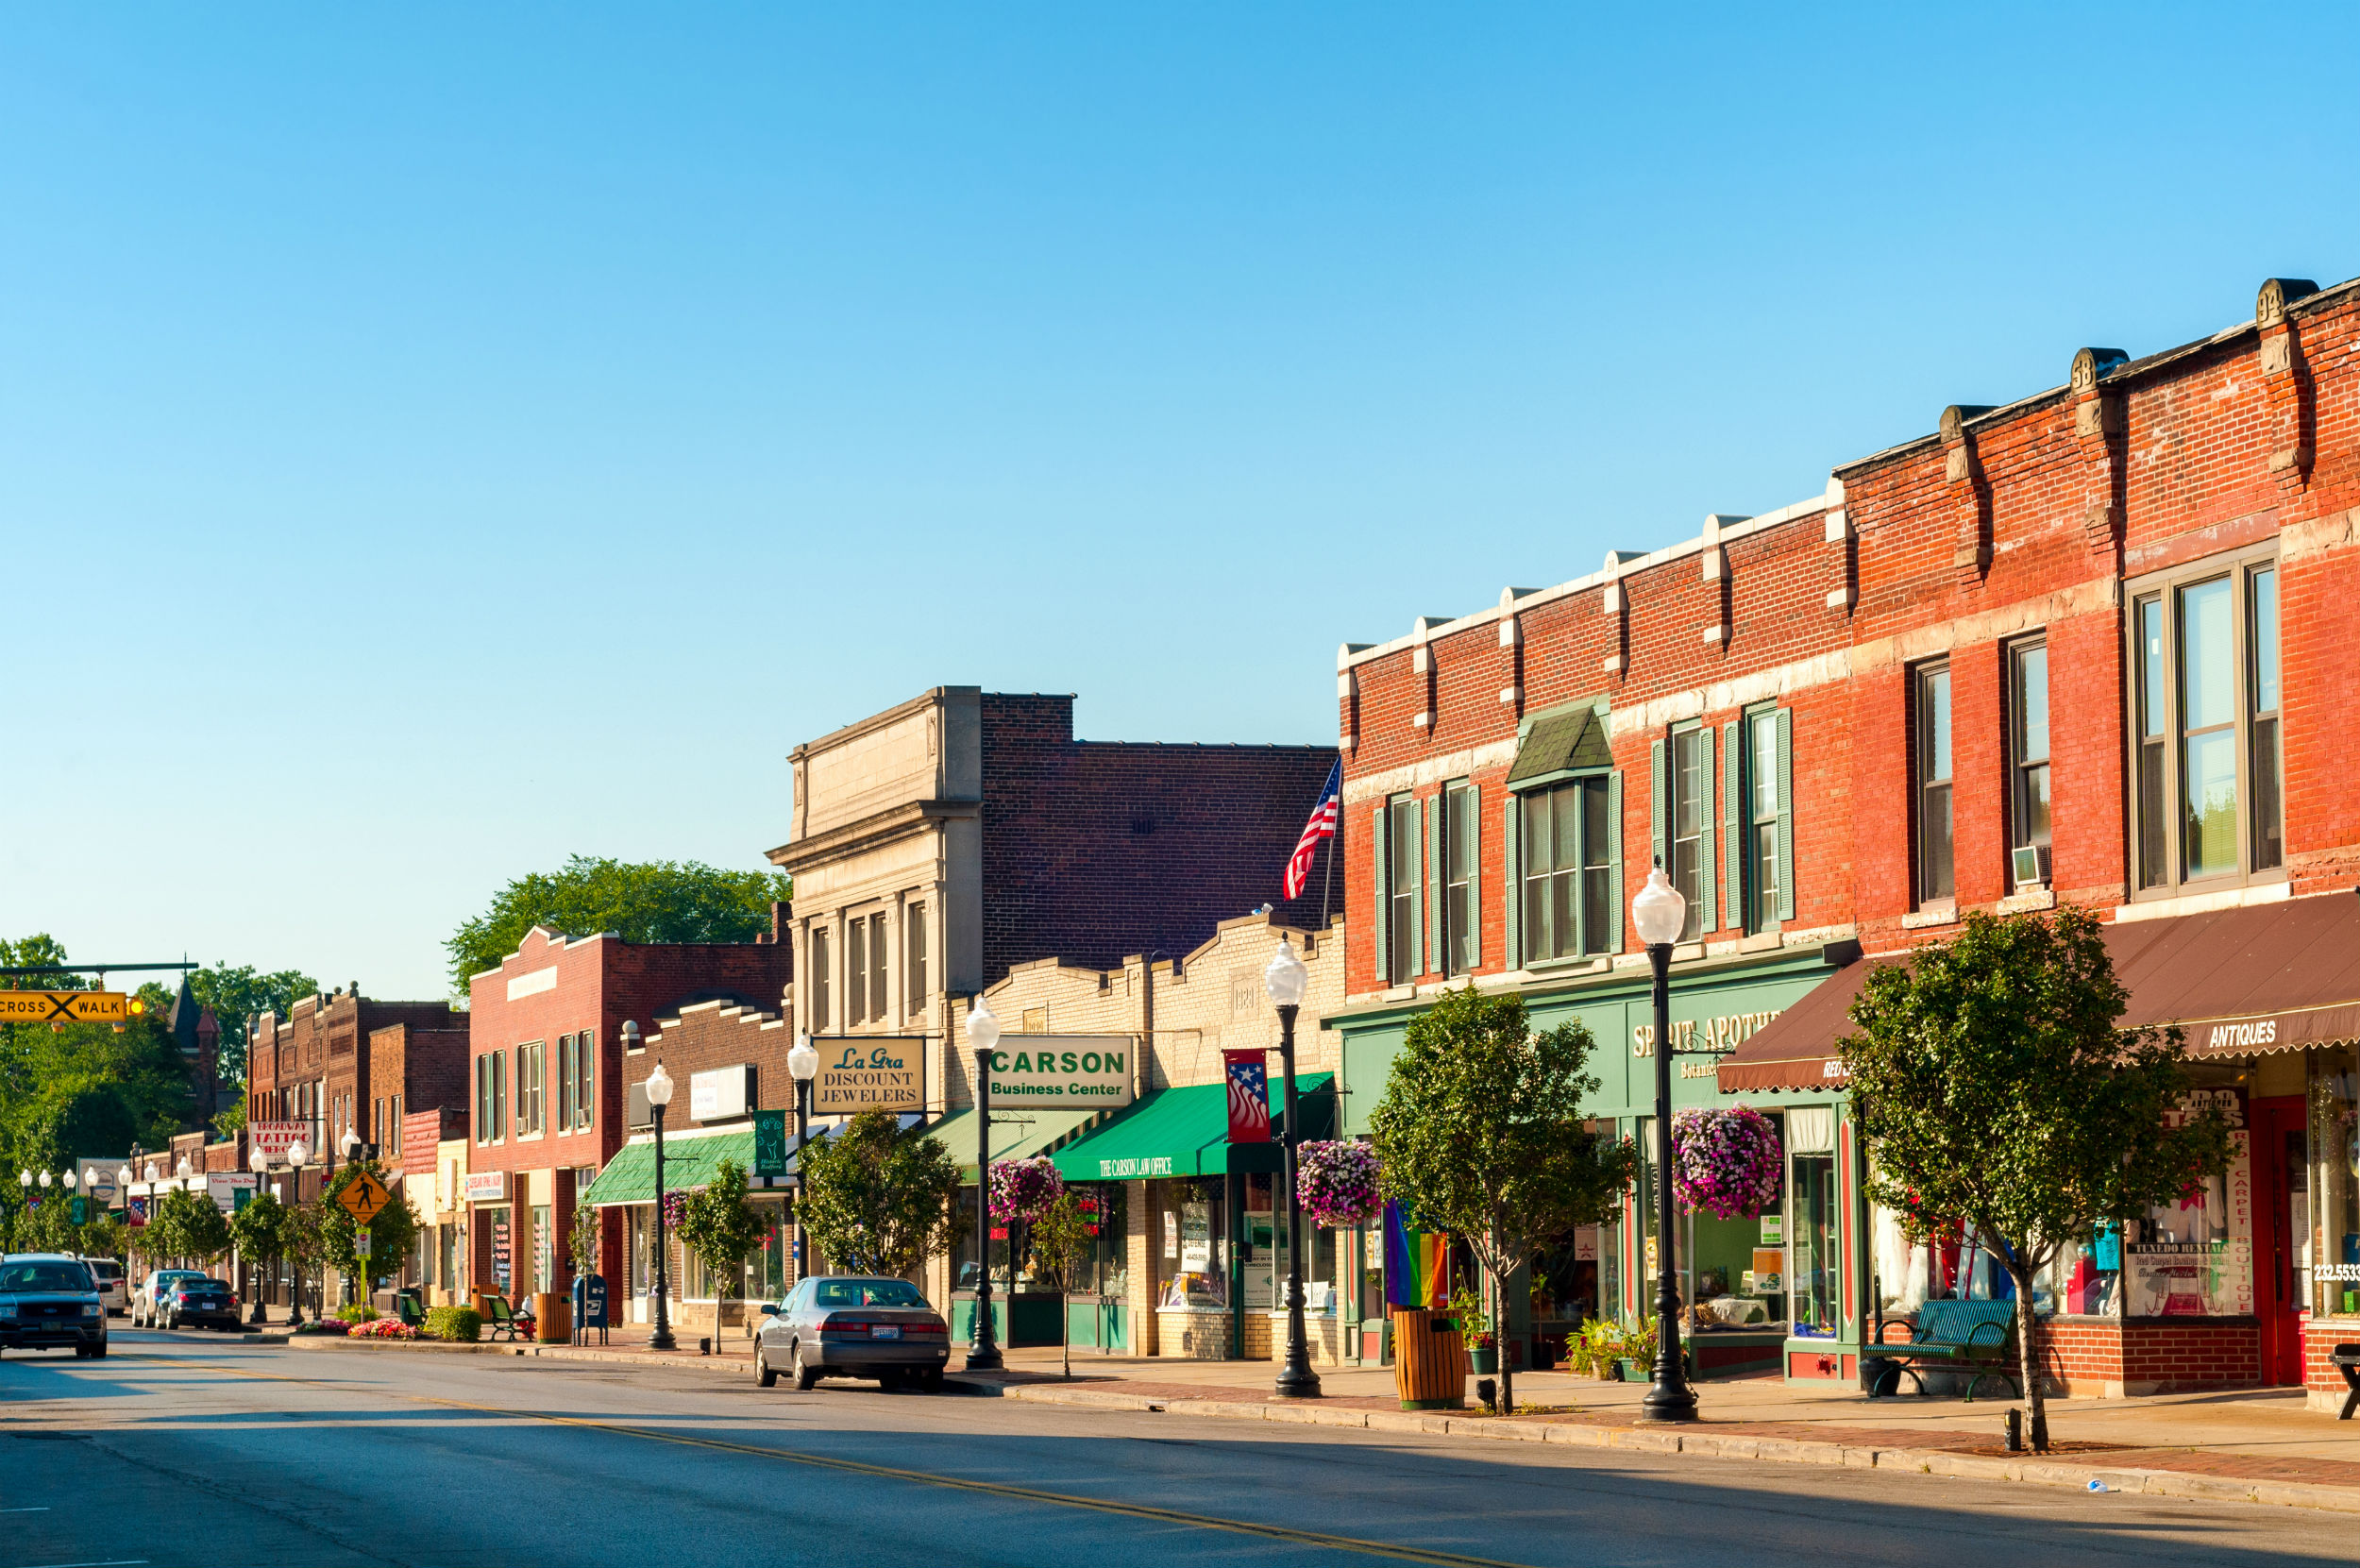
Rural Middle America: This collection of 599 counties runs across the northern half of the country, starting up in Maine through the Great Lakes and across to Montana and Washington state. These counties have a less diverse population (91% white) that is spread into less urban locales — 62% of the population lives in places the Census labels as rural. Though they tend to be made up of small towns, these places generally do not rely heavily on agriculture. Wealth in Rural Middle America sits just below the national average, with an average median income of $52,600. Access to healthy food in these communities is favorable, with a Food Environment Index of 8.04, above the national average of 7.7. Although this food is available, these communities still experience a high rate of adult obesity, 32% compared to 28% nationally. This could be due to lack of access to exercise opportunities, which only 65% of adults in these communities have. Despite these issues, healthcare seems accessible here, with only 9% of the population uninsured, 2% lower than the national rate.
Urban Suburbs: These 106 counties hold the wealthy, diverse suburbs of most major cities, and they have come to take on many of those big city characteristics. They are densely populated — the average Urban Suburb is home to roughly 500,000 people — and diverse. The population of these counties is about 58% non-Hispanic white, 11% African American and 16% Hispanic. They are the wealthiest and best educated of all the types in the ACP — average median household income is about $68,000, and 37.2% of adults have a bachelor’s degree. As they grow more dense and urban, poverty rates are increasing. Currently, 15% of children live in poverty and 46% are eligible for reduced price school lunch. People here enjoy more opportunities for physical activities, with 9% more individuals reporting access to exercise facilities than the national average. Healthy foods are also more prevalent, with a Food Environment Index — an index of factors contributing to a healthy food environment — of 8.1 compared to the national average of 7.7.
Working Class Country: Working Class Country counties are heavily clustered in specific rural communities in the eastern half of the United States including Appalachia, the Ozarks and the upper-Midwest. Largely rural in nature, Working Class Country counties are among the nation’s least diverse places — 91% white, 2% African American and 4% Hispanic. These counties generally don’t rely on agriculture but rather exist as small service economies with some small manufacturing. Their average median household income of $42,400, sits about $13,000 below the national median. The percent of people with a college degree, 16.4%, is roughly half the national average. Working Class Country counties tend to be older than the nation at large. About 21% of the population are older than age 65. Nationally that figure is 15.6%. Violent crime rates are low as are home costs. People report more frequent poor mental health days here, 4.3 of the past 30 days compared to the national average of 3.7. Despite elevated needs for care, there are about 1,200 additional people per mental health provider here than the national average.
by Dante Chinni and Ari PinkusSeptember 19, 2018Print
The health of Americans varies greatly depending on the kind of community they call home, and different types of communities have knowledge they can share to improve citizens’ well-being. Those findings are at the heart of months of research and reporting from the American Communities Project (ACP) at The George Washington University.
The ACP, working with data from the 2018 County Health Rankings and with the support of the Robert Wood Johnson Foundation, examined thousands of data points through the prism of the ACP’s 15 community types — distinguishable by demographic variables such as income, occupation, race and religion — to find common worries and shareable solutions.
Three dominant themes emerged in the analysis.
Communities with large populations of people of color farepoorly on a variety of important health and community measures. The data suggest the scores are less about specific populations in these communities than they are about the economic and cultural divides running through them.
Mental health concerns cross all community types. The ACP’s community types hold very different geographies, people and economies, but the median county in every type has between 10% and 16% of its population reporting 14-or-more poor mental health days per month.
Some commonly held understandings of many communities and the challenges they face are incorrect. For instance, raising children in a single-parent home is not just an urban worry. And the nation’s most racially and ethnically diverse communities, the big cities, are also its most segregated.
The data make clear that all kinds of communities — from well-educated urban enclaves to rural blue-collar boroughs — face health challenges. Furthermore, the data show what those specific concerns are.
The ACP also visited five communities, each representing one of its 15 types, to find best practices to address citizen health. Interviews with community leaders and officials in Dallas County, Texas; Douglas County, Colorado; Hood River County, Oregon; Jones County, Georgia; and Lake County, Ohio, led to insights into how those communities deal with their respective challenges and revealed programs and ideas that others can put into practice.
Combined, the ACP’s research and community investigations encompass a deep examination of the socioeconomic, cultural and health-related ties that bind together the United States’ complicated patchwork of communities in 2018 and an exploration of what these communities can learn from one another.
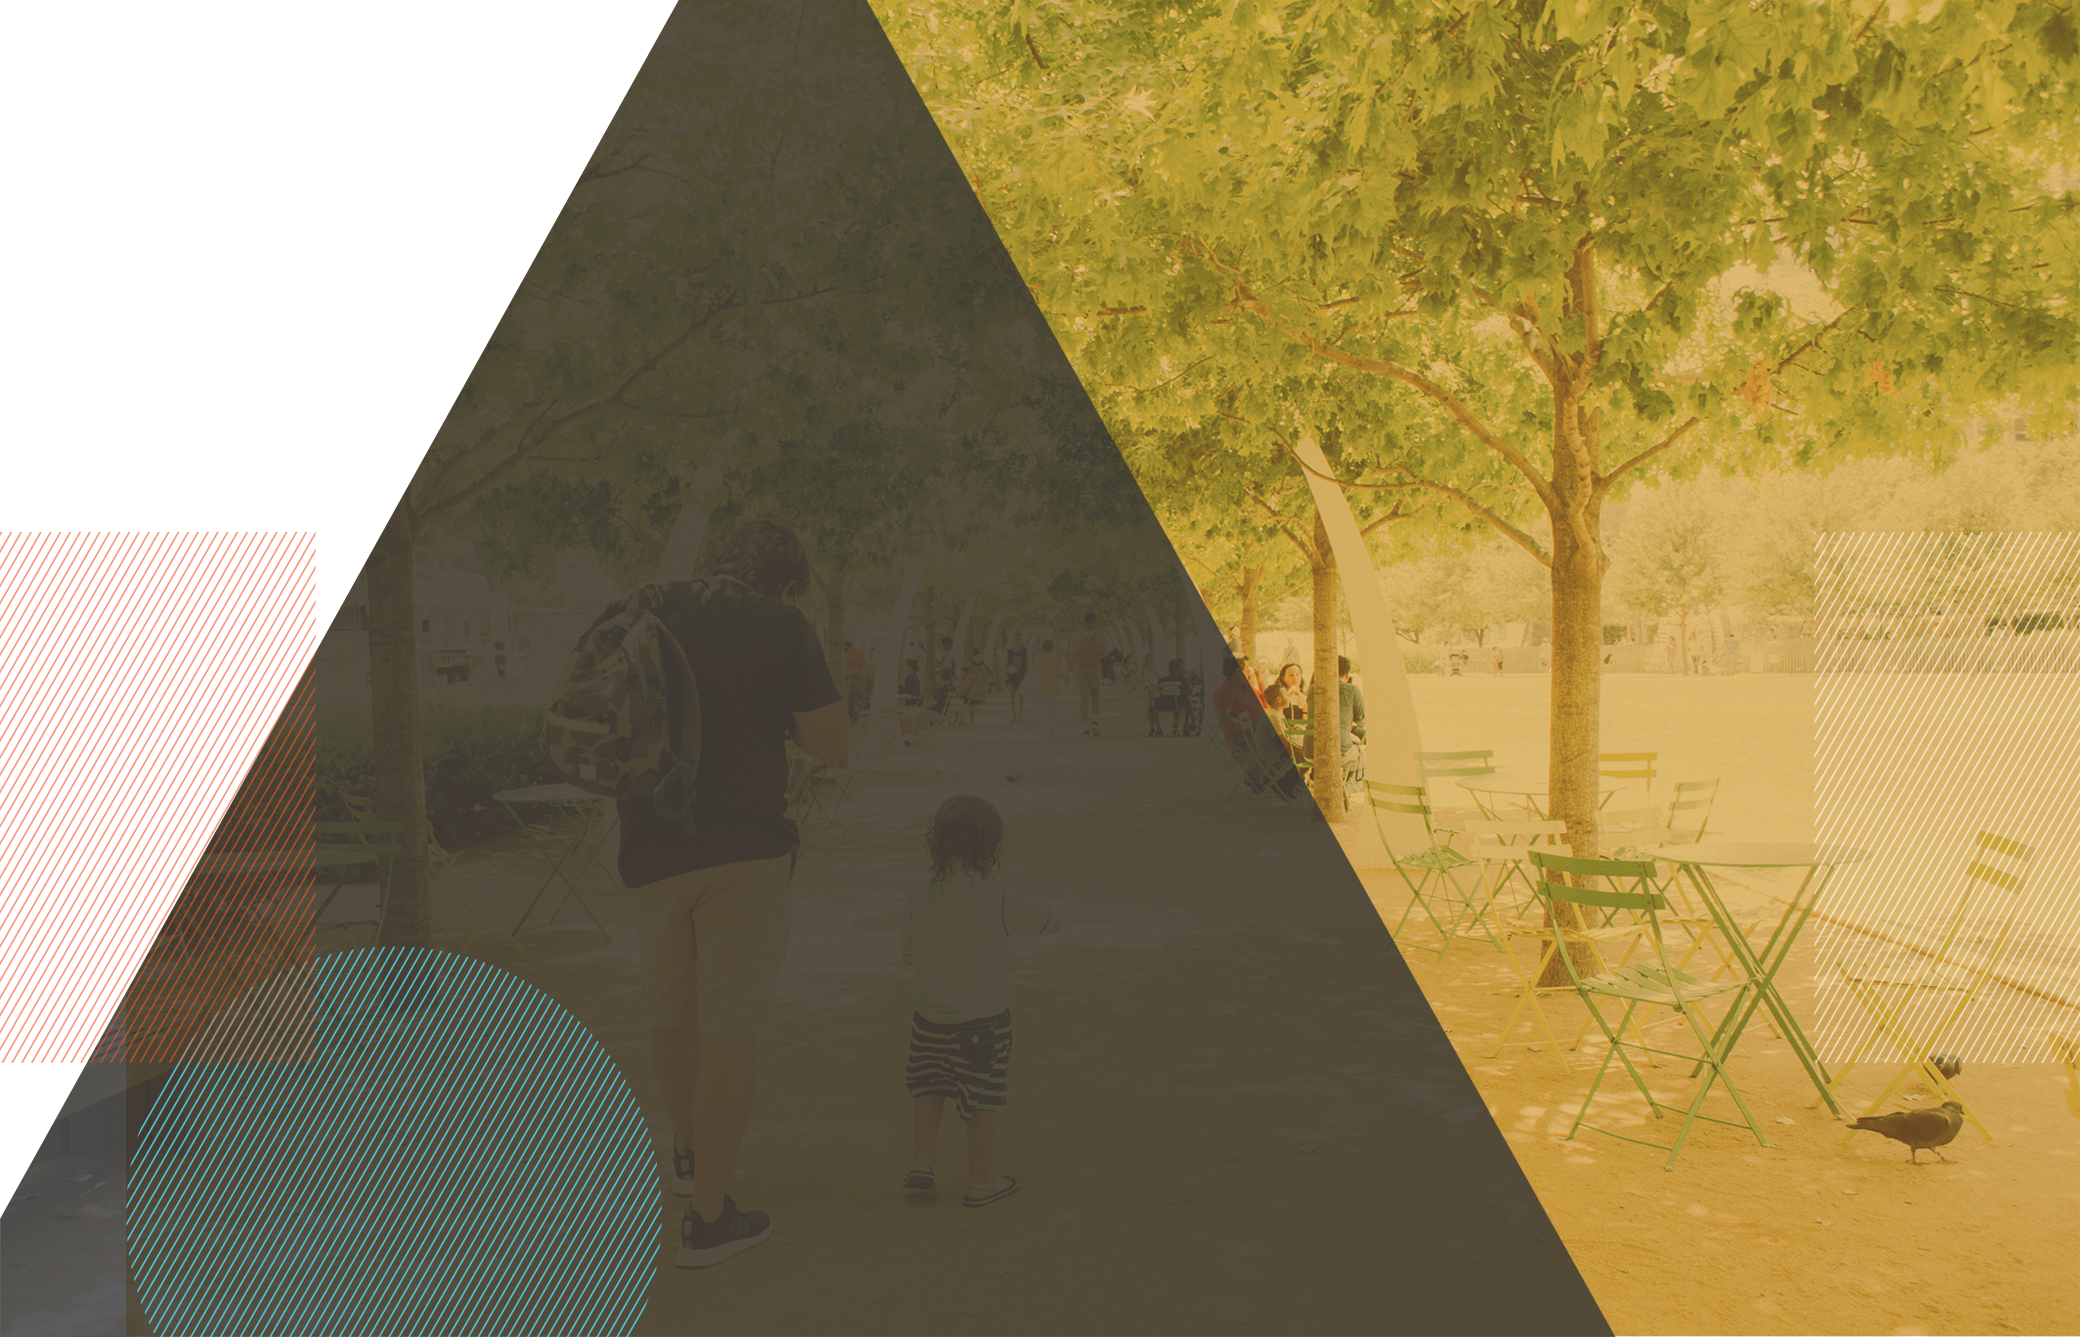
The Tapestry of American Communities
Your community is more than your home; it defines your life, from job opportunities and consumer choices, to the quality of education, to air quality and exercise options. And just a few miles can make a dramatic difference. Consider three Michigan counties that abut one another — Oakland, Macomb and Wayne.
In the 2018 County Health Rankings & Roadmaps— a partnership of the Robert Wood Johnson Foundation (RWJF) and the University of Wisconsin Population Health Institute — those three neighboring counties are, in essence, different worlds. In wealthy Oakland, 12% of the population report being in only fair or poor health. In Macomb, the number is 15%. In Wayne, it is 19%. Macomb has a significantly higher median household income than Wayne, but it also has a higher rate of drug overdose deaths. And Wayne is the most racially and ethnically diverse, but the economic development and history of the area has also left it more segregated.
The amount of variation in such a small geographic area is noteworthy, but not exceptional. Those communities are not just different places; based on the ACP community types, they are different kinds of places. Oakland, an educated, well-to-do county to the northwest of Detroit, is a quintessential Urban Suburb. Macomb, just east of Oakland, is a blue-collar Middle Suburb. Wayne, just south of both, includes Detroit and, thus, holds the density and diversity of a Big City.
When you look at the nation as a whole, the complexity of community types grows. The ACP’s map of the United States defines 15 community types among the nation’s 3,100 counties. These 15 types were created using dozens of demographic variables and are designed to explore likenesses and differences that exist among communities at the county level. The ACP’s 15 county types are mapped below.
Defining the ACP Types (Click type names to see more on each.)
African American South: Places with large African American populations. Lower incomes and higher unemployment.
Exurbs: Wealthy communities usually on the edge of metro areas, Largely white with lower crime rates.
Military Posts: Located around military installations. Younger, middle-income, diverse communities.
Graying America: Places with large senior communities. Generally rural and less diverse, middle-income.
Native American Lands: Places with large Native American populations. Young communities with lower incomes.
Big Cities: Counties holding the nation’s largest cities. Dense and diverse.
Hispanic Centers: Large Hispanic populations in mostly rural communities. Younger with lower incomes.
Rural Middle America: Largely rural and white communities. Middle income and average educational attainment.
College Towns: Urban and rural communities that are home to campuses and college students.
LDS Enclaves: Places dominated by Latter-day Saints adherents. Younger and middle-income.
Urban Suburbs: Educated and densely populated communities around major metros. Racially and economically diverse.
Evangelical Hubs: Places with above-average numbers for evangelical adherents. Largely Southern with fewer college grads.
Middle Suburbs: Middle-income, blue-collar communities mostly around metro areas.
Working Class Country: Rural, blue-collar communities. Low incomes and college graduation rates.
The ACP’s focus on types of community pairs neatly with RWJF’s County Health Rankings. Undergirding the Rankings is the idea that health is about a lot more than what happens in the doctor’s office. Ultimately people’s health is influenced by a complex mix of factors including family life, environmental inputs and economic circumstances — elements deeply tied to our communities. By merging the ACP and the Rankings we can look at how those small differences at the community level fit into broader, hidden national trends.
What the Numbers Say
On behalf of the ACP, the University of Wisconsin Population Health Instituteused data compiled by the County Health Rankings & Roadmaps programs to determine variation within and across ACP county types. It also calculated a composite measure of length and quality of life for counties, which was then used to sort counties within each typology. The top-performing counties within each typology were further classified by their within-state rank on health outcomes and health factors.
Do the combined Rankings and ACP data suggest one type of community is the country’s healthiest? Not really. There were limitations. The ACP’s types are not evenly spread across the country. Utah, for instance, is dominated by LDS Enclave communities, meaning those places are spread across all four quartiles in that state. And many states have no Big Cities.
That said, there are some broad trends in the numbers. The semi-urban counties known as Exurbs are the most likely to score in the top quartile of their states’ healthiest places. Nearly 73% of those 222 counties placed in their state’s top quartile. The Urban Suburbs were next, with 57% of those 100 counties scoring in their state’s top quartile. The Big City counties and the College Towns, counties defined by academic institutions in them, followed with about 46% scoring in the top quartile.
Certain county types score lower in the rankings. The counties of the African American South and the places known as Hispanic Centers are much less likely to be in their state’s top quartile — about 6% and 13% respectively. The counties of the Native American Lands scored lowest in the rankings; none were in their state’s top quartile.
And a large number of community types reside in the middle of the Rankings. Military Posts, Rural Middle America, Middle Suburbs and LDS Enclaves, all have roughly 25% to 40% of their counties in the top quartile of their state’s health rankings.
But that surface look at the data misses the real story in the numbers and the people and place behind them. For important reasons, this report is not about finding the best type of place to live.
First, much can depend on the place you actually live and the measure you care most about. There is a lot of variation in the numbers even within types.
The chart below is interactive. You can choose the indicator you want to explore, from uninsured rates to premature death, by scrolling through the options in the box in the top left. The black line within each type represents its median value. You can also search for any county in the country by entering its name in the “Find a County” box. The chart shows not only the differences in the community type medians but also how communities are clustered in some types and spread across the line in others.
And, beyond those numbers, consider this: With all the different types of communities in the United States — from sparse rural areas to dense cities — the overwhelming majority of Americans are quite content with their community. In 2017, Gallup asked Americans to rank the statement “The city or area you live is perfect for you” on a scale of 1 (lowest) to 5 (highest). More than 60% of Americans gave the statement a 4 or 5. And that finding was remarkably consistent across the ACP types.
This report does not identify “winners.” Rather, it aims to find what we can learn from each community type about improving health and well-being, so people can make their communities healthier no matter where they live.
What can the Exurbs teach us about growing healthy communities and what can they teach each other? What are the shared drivers behind the challenges faced by the counties in the African American South? Are there lessons in the counties of Graying America for the rapidly aging Middle Suburbs?
Three Trends in the Data
Digging into the numbers, there are marked differences across many measures, including the three key findings in the analysis.
Communities with large populations of people of colorfare poorly on a variety of important health and economic measures. This seems to be less about the specific populations in these communities than it is about the socioeconomic and cultural divides running through them. Those pressures create special challenges for these communities. The challenges are visible in data on the African American South, Hispanic Centers and Native American Lands.
The median county in those three types stands apart on a range of important factors and outcomes. They sit above the other county types on the percentage of people reporting they are in poor or fair health and the percentage of uninsured adults, but also on broader socioeconomic measures, including the percentage of disconnected youth and the percentage of children eligible for free or reduced school lunch. That combination of scores suggests that limited economic and educational opportunities are at the root of the obstacles these communities face.
In a sense, these data speak to the long-term challenges these communities face and how interconnected those challenges are — for all age groups. Children in these places start off behind their peers in other community types and are more likely to need aid in school. Later, as adults, they are less likely to have health insurance and, ultimately, less likely to be healthy. Again, these splits aren’t just about the lower incomes in these communities, but about deeper community rifts. (We explore these rifts further in the community narratives of this report.)
Mental health concerns cross all community types. The ACP’s community types look very different in their geographies, people and economies, but the median county in every type has between 10% and 16% of its population reporting 14-or-more poor mental health days per month.
Those numbers are particularly arresting when you take into account the Centers for Disease Control 2018 report that death by suicide climbed by 25% between 1999 and 2016. And while the figures are higher in some places than others, they seem to defy simple explanation. The well-to-do, semi-urban Exurbs and Urban Suburbs, at 11%, look the same as middle-income Rural Middle America. The number for the youthful College Towns, 12%, is the same as the number for the aging Graying America counties.
Furthermore, we found mental health concerns to be a top priority in every county we visited — though the driving factors were not necessarily the same. The one true outlier in the data is the Native American Lands.
The data also reveal how we may misunderstand different kind of communities. Some findings in the County Health Rankings are somewhat counterintuitive.
For instance, while urban areas are often viewed as the core of the nation’s struggle with single-parent homes, the figures are actually spread across the country to many different kinds of communities. About 38% of the children in the median Big City county, as well as 36% in the Middle Suburbs, live in single-parent homes.
Looking at diversity, we also found noteworthy revelations. Big City communities are among the most diverse in the country — the median Big City is only about 47% white. But those same communities also score higher on segregation than other kinds of communities, even those with fairly multicultural populations such as the Urban Suburbs, African American South and Hispanic Centers. That is to say, even if you live in a place that looks like a melting pot from 30,000 feet, on the ground it may look much more monochromatic.
The numbers show that the much-publicized racial and ethnic diversification of the nation has a hard time breaking through the racial and ethnic boundaries that define many communities — even in places that look diverse in high-level data. Those boundaries often have deep historical roots that were created by generations of migration patterns — conscious and unconscious decisions by racial and ethnic groups that essentially remain in effect today, particularly in Big Cities.
And rural living doesn’t necessarily mean long, solitary drives. In fact, the county type known as the Aging Farmlands is among the least likely to have long commutes driving alone. In the median Aging Farmlands county, only 22% of the people who drive to work alone have a commute time of more than 30 minutes. The figure is 27% in the median Rural Middle America county, 39% in the dense, prosperous Urban Suburbs and 45% in the Exurbs. In other words, small town/rural communities seem to offer drivers an advantage over more densely populated areas.
Next Steps
There are other large patterns in the data, which can be explored in the index of this report. Short analyses of all the ACP community types as well as an excel sheet with data can be downloaded by individuals and communities. We believe these community trends and data sets are crucial to communities and community leaders. First, they allow community leaders to see how their home compares to similar places — and whether their community is an outlier in certain statistical areas. Second, the trend data should give communities other places to turn to for models and approaches to community health and engagement.
To see what these data look like on the ground, we visited five specific communities and talked to local leaders about how they are handling the concerns they face every day. How do they strive to make their communities better? What challenges do they face? What successes have they had? You can read descriptions and solution highlights below, and dive deeper into the communities by clicking the links.
Scattered around the country, the Big Cities stand out for their diversity. These counties are a true mosaic socioeconomically, racially and ethnically (48% white, non-Hispanic, 16% African American, 11% Hispanic and 6% Asian). They are also the most segregated communities in the country.
Collaborations among nearly 100 community nonprofits, including the North Texas Food Bank, large shelters and faith-based institutions, share information about patients to better coordinate care and understand the social and economic factors that shape health.
An initiative started by Children’s Health in Dallas integrates mental health care within children’s primary care — with encouraging results.
Paul Quinn College, a historically black college in southern Dallas, has adopted the work-college model, reducing its graduates’ student-loan debt. The college has also turned its football field into a farm, helping alleviate food insecurity in a food desert.
Exurbs, which tend to sit on the edge of major metropolitan areas, are generally wealthy (median household income of more than $65,000), well educated (34% with a bachelor’s degree) and not especially diverse (81% white, non-Hispanic). They are also known for long, solo commutes by car; 83% of workers drive alone to work. In short,they are communities where the old suburban ideal still reigns.
Through the Douglas County Mental Health Initiative, 40 community partners help connect people with mental health services they need. Since May 2017, the county has created two Community Response Teams, each composed of fire/EMS, law enforcement and a clinician — with promising results.
To cope with rapid growth, including an increasing senior population, the county is helping seniors, people with disabilities, low-income residents and others get from one point to another through a partnership with Lyft and faith-based organizations.
The Regional Transit District is extending light rail lines in the county.
Heavily rural and based primarily in the nation’s Southwest with pockets in the Northwest, Hispanic Centers face significant socioeconomic and health challenges. Only about 17% of these individuals hold a bachelor’s degree and the average median household income sits low at $45,800. These communities have limited access to care. About 19% are uninsured, nearly twice the national average.
Community health workers have long facilitated residents’ connections with healthcare and social service providers. The successful model is now helping Latinos launch businesses.
As state-issued IDs have become harder for immigrants and others to obtain, a community ID card, approved in June, is expected to allow county residents to connect with civic, public safety and other community services.
Built in 2011, Hood River Crossing contains 40 one-, two- and three-bedroom units, and more affordable housing is in the works to address access to safe and affordable housing.
Based heavily in the Southeast states, the counties of the African American South struggled on the whole in the County Health Rankings, having the second-highest premature death rate among all types (more than 10,000 years lost per 100,000 population). Obesity rates (35%) and smoking rates (21%) also tend to be higher.
The initiative Live Healthy Jones aims for residents to better attend to their health, including choices about diet and exercise.
To provide for residents without health insurance, Community Health Care Systems opened in Jones County about five years ago.
A group of white and African American pastors meets regularly and discusses touchy issues, including politics and racial profiling. African American and white churches worship together over holidays.
Primarily nestled in the aging, inner-ring suburban areas of the Industrial Midwest, Middle Suburbs contain a unique mix advantages and challenges. They hold the lowest percentage of uninsured people (7%), but they score highest for drug-overdose deaths (26 per 100,000 people).
Lake County General Health District generated an idea that uses Geographical Information Systems to tackle the opioid crisis.
The Better Flip is an initiative by the Lake County Ohio Port & Economic Development Authority to make post-World War II homes on the west end of the county more attractive to young potential homeowners.
Leadership Lake County started a program two years ago to help millennials see their place in the county. The organization encourages other groups in the county to diversify their boards, including appointing two millennials at a time because the buddy system works.
More to Come
In a country as big and diverse as the United States, we need a new way to understand geography. Sometimes a community has more in common with a place hundreds of miles away than it does with the city or county next door. This report begins to explore this idea. There will be more deep dives in subsequent work, including one into the complexities of rural America.
What’s the American Communities Project all about?
We know that people in different places experience the world very differently, even in the age of the Web; we seek to understand just why and how.
Consider that within the same state, community differences can be stark. The differences between a metropolitan area and a rural locale 50 miles away can be greater than that same city and another metro area 500 miles away. Often these different traits are not properly understood in the policy world where problems are frequently judged by looking at national or state phenomenon or data.
Understanding the different types of community that make up America will help us develop new and better ways of recognizing and measuring what works and what does not in a range of disciplines — health, diversity, economics, culture, law, technology, etc. — and their intersections.
What is a community type?
The American Communities Project (ACP) classifies the 3,100 counties in the United States into one of 15 different kinds of counties called community types. The community types are based on a vast array of data, including election results, economic numbers, consumer surveys, and polling.
What are the 15 community types?
(Click type names to see more on each.)
African American South: Places with large African American populations. Lower incomes and higher unemployment.
Exurbs: Wealthy communities usually on the edge of metro areas, Largely white with lower crime rates.
Military Posts: Located around military installations. Younger, middle-income, diverse communities.
Graying America: Places with large senior communities. Generally rural and less diverse, middle-income.
Native American Lands: Places with large Native American populations. Young communities with lower incomes.
Big Cities: Counties holding the nation’s largest cities. Dense and diverse.
Hispanic Centers: Large Hispanic populations in mostly rural communities. Younger with lower incomes.
Rural Middle America: Largely rural and white communities. Middle income and average educational attainment.
College Towns: Urban and rural communities that are home to campuses and college students.
LDS Enclaves: Places dominated by Latter-day Saints adherents. Younger and middle-income.
Urban Suburbs: Educated and densely populated communities around major metros. Racially and economically diverse.
Evangelical Hubs: Places with above-average numbers for evangelical adherents. Largely Southern with fewer college grads.
Middle Suburbs: Middle-income, blue-collar communities mostly around metro areas.
Working Class Country: Rural, blue-collar communities. Low incomes and college graduation rates.
Who are the American Communities Project’s partners?
The ACP is based at The George Washington University’s School of Media & Public Affairs. Other major partners are the Robert Wood Johnson Foundation; Gallup; Public Opinion Strategies; Peter D. Hart Research; the Pew Research Center; and Simmons Research, a marketing data firm. ACP’s data library is always expanding.
How can you use this website?
Play with the map here or on the homepage.
Hover over a county to discover which community type it fits into. Zoom with the + and – buttons.
Click on a county to take you to the page with more characteristics of that county’s community type.
Click on a community type in the map key to see its spread across the country (homepage map only).
Navigate with the hamburger menu. Visit one of the 15 community type pages and learn more about the characteristics of a specific kind of community. Visit the Storybank for stories, insights, and analysis written by ACP authors and guests; find relevant data sets within individual stories and apply them to your work.
Scroll down the homepage for ACP’s recommended articles.
Stay tuned for more. Read the ACP’s reports about health and related issues, supported by the Robert Wood Johnson Foundation. Data sets and multimedia will be available within the reports.
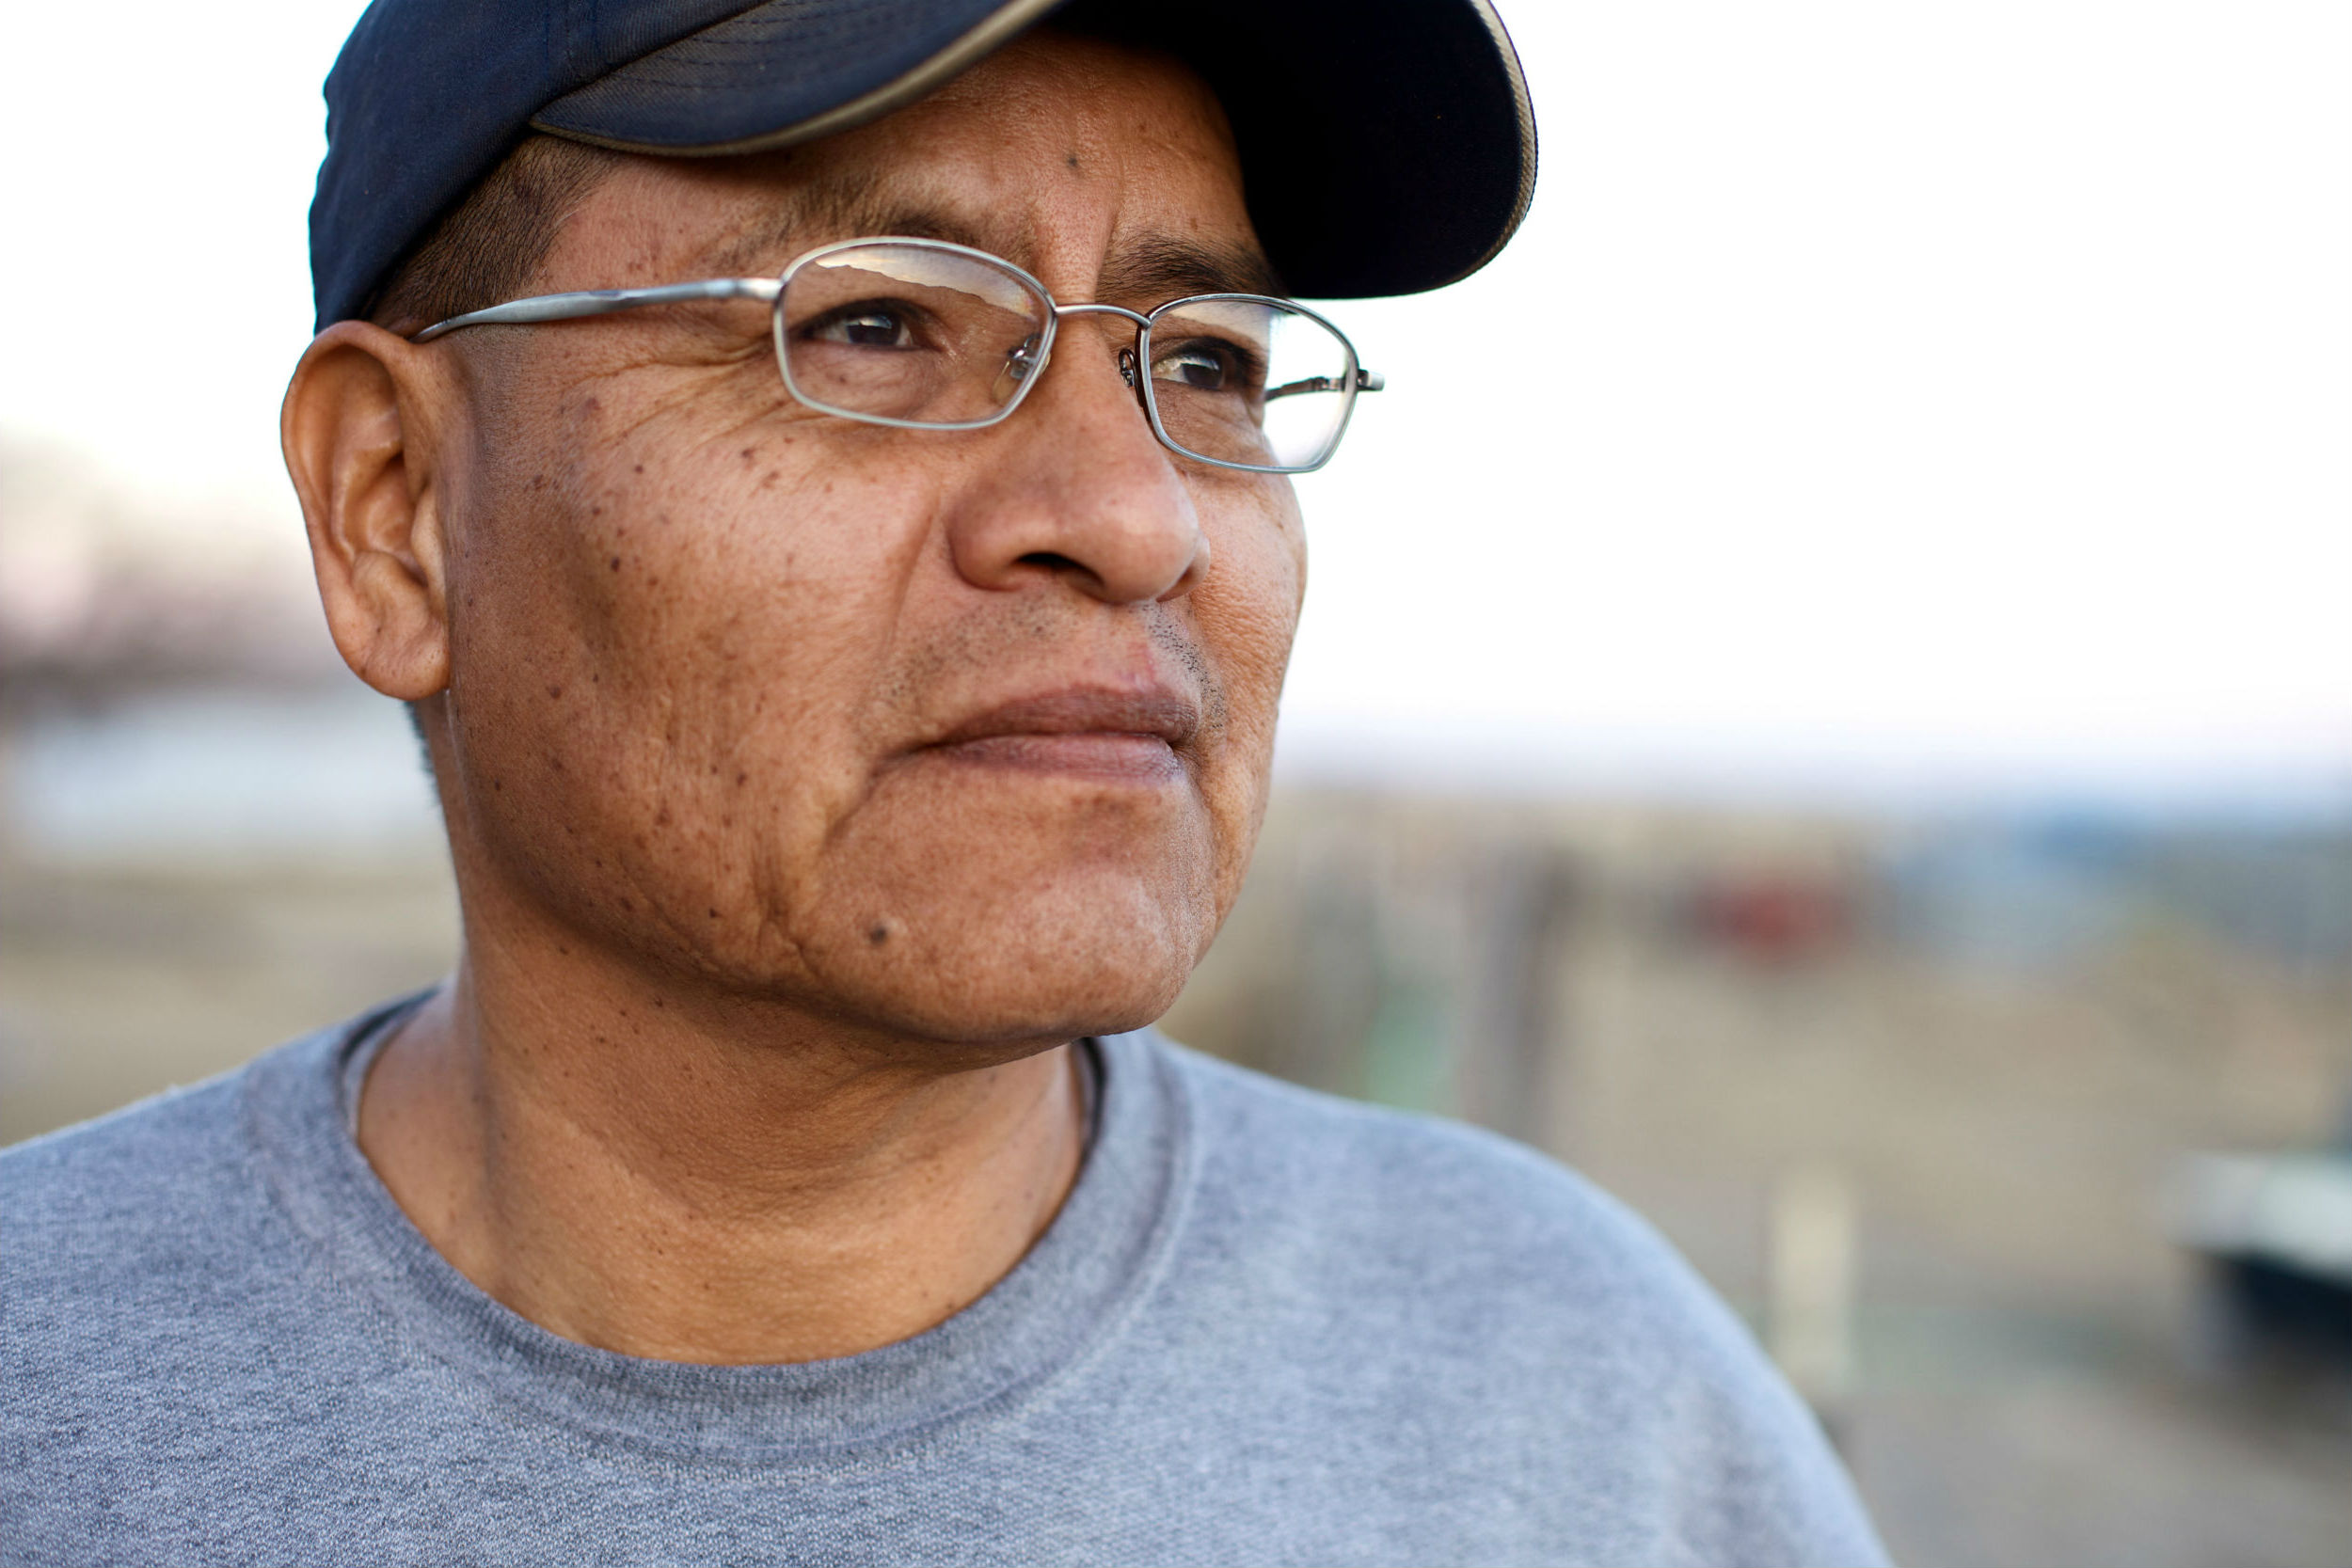
The Native American Lands are heavily rural with low college education rates — only 16% have a college degree. They also have the lowest “white only” population of any American Communities Project type, about 28%. They are closely split politically. President Donald Trump won these counties by about seven percentage points in 2020, flipping Barack Obama's three-point win in 2012.
The Native American Lands are heavily rural with low college education rates — only 16% have a college degree. They also have the lowest “white only” population of any American Communities Project type, about 28%. They are closely split politically. President Donald Trump won these counties by about seven percentage points in 2020, flipping Barack Obama's three-point win in 2012.
Community Snapshot
Dotted primarily across the west, these 45 counties are marked by large Native American populations – more than half the people who live in these counties overall are indigenous Americans.
The Native American Lands are one of the smallest community types, home to about 914,000 people. These are not wealthy places, with a median household income of about $47,300. Health behaviors fare worse here than across the other types. About 28% of adults in the Native American Lands are current smokers, 12% more than the national average. Obesity is also a problem in these communities, with cases of adult obesity rising 7 points above the 32% national average. The people in these areas have limited access to exercise opportunities, with only 42% of the population receiving adequate access to facilities for physical activity. Likely due to the poor health behaviors, more than 20% the population reports fair or poor health, above the national average of 12%. Broadband access sits at 70%, which is the lowest rate among community types and 17 points below the national average. The voter turnout rate is 54%, sitting 14 points below the national average.
Voting Engagement
54%Voter Turnout
Percentage of citizen population aged 18 or older who voted in the 2020 U.S. Presidential election
Now’s the time when students of all ages are cramming for end-of-year exams through the wee hours. But it’s not just students sleeping poorly—and it’s not just in May. A health problem that’s been building in America for some time, insufficient sleep was classified as a public health epidemic by the Centers for Disease Control and Prevention in 2016—and continues to be a pain point.
Sleep in American Communities
Now that the American Communities Project (ACP) is bringing its lens to the 2018 County Health Rankings, a Robert Wood Johnson Foundation program, the ever-present problem comes into sharper relief. ACP found that insufficient sleep is an issue in all 15 community types, but it is a matter of degree.
One group stands out for being particularly sleep deprived: the African American South, often found in more rural areas from Virginia through Texas, where African Americans can make up more than 40 percent of the population and the median household income is at the lowest level of all types. Here the insufficient sleep average jumps to 38 percent. These counties show more evidence of other health problems laid out in the rankings, including high rates of obesity (35 percent) and physical inactivity (31 percent). Among the community types, it also ranks highest in income inequality, signaling socioeconomic distress.
On the other end of the scale are more homogenous places. The sharpest example occurs in Aging Farmlands, where the insufficient sleep rate drops to 27 percent. These counties in the Great Plains are home to about 576,000 people, 92 percent of which live in rural areas. They tend to be the oldest and least racially and ethnically diverse places in America, with more than a quarter over age 62 and 96 percent white. A slower, quieter life without work stress may contribute to better sleeping patterns. Graying America—where nearly a quarter of the population is 62 and older, and there’s also less diversity than the nation writ large—the rate holds at 31 percent on average. For that matter, Rural Middle America, where nearly 22 million people live, clocks in at 31 percent as well. These counties are a bit wealthier, more rural, and less diverse on average.
Sleep deprivation is slightly less prevalent in LDS Enclaves at 29 percent. Since the early 2000s, the Mormon Church has devoted some attention in its publications to the importance of sleep and rest.
Aside from LDS Enclaves and Aging Farmlands, the percentage of people in American communities not getting enough sleep remains above 30 percent on average—underscoring that the problem is justified to merit national attention. In fact, many different kinds of communities hover around the one-third figure. In the affluent Exurbs, 33 percent of residents on average report an insufficient amount of sleep. Hispanic Centers and College Towns, both of which have high percentages of youth, stand at 32 percent. Working Class Country, Native American Lands, Big Cities, and Urban Suburbs are at 34 percent.
Why Sleep Matters
Since 2016, the County Health Rankings have included insufficient sleep in a host of measures about one’s life quality and length. The report cites many reasons:
“Sleep plays a key role in maintaining proper growth and repair of the body, learning, memory, emotional resilience, problem solving, decision making, and emotional control.
Ongoing sleep deficiency has been linked to heart disease, depression and anxiety, risky behavior, and suicide.
A lack of sleep can also affect others’ health. Sleepiness, especially while driving, can lead to motor vehicle crashes.”
To obtain a measure, the rankings incorporate a key question from the Behavioral Risk Factor Surveillance System survey: “On average, how many hours of sleep do you get in a 24-hour period? Think about the time you actually spend sleeping or napping, not just the amount of sleep you think you should get.”
Insufficient sleep translates to the percentage of adults who respond that they get less than seven hours of zzzz a night on average. In 2016, about one third of adults reported getting insufficient sleep. In some counties, it was almost one in two residents.
That same year Arianna Huffington’s The Sleep Revolution: Transforming Your Life One Night at a Time debuted and became a national best-seller. In it, she describes collapsing from exhaustion in 2007.
This federal tax season marks the last one with a full dose of SALT – state and local taxes. Next year the new Republican tax plan will place a $10,000 cap on the deduction households can take on their property and state and local incomes taxes, and those changes will fall hardest on the most urban places.
Data from the Tax Foundation analyzed by the American Communities Project finds it is the Big City and Urban Suburb communities that pay the most in SALT taxes, followed by the Exurbs. All those types have an average median SALT amount of more than $3,000, meaning many people in those communities are most likely to feel the impacts of the new law, according to 2014 data from the foundation.
Much has been made of the political impacts of these numbers, how Democratic leaning communities look as though they will be hit hardest in this part of the new law. And the numbers bear that out.
In the 2014 data, there were 13 counties where the median SALT amount was over $10,000 and 11 of those counties voted for Hillary Clinton in 2016. That means that more than half the households in those communities will take a hit under the new tax law. (Nine of those counties are Urban Suburbs in the ACP, three are Big Cities and one is an Exurb.)
But that broad view of the data may miss a larger point. Because of the way it targets state and local taxes, the new tax law is more than a purely partisan measure. In many ways it may deepen the urban/rural divide that has become a defining part of the American political story, making urban areas lean more Democratic.
Places with higher SALT amounts tend to be more urban because urban property values are typically higher which means urban property taxes tend to be higher, regardless of a homeowner’s political affiliation.
All those counties, even the ones that voted for Clinton in 2016, have some Republican voters in them. Many of them will pay more under the new rules as well, which may make them less likely to vote Republican in future elections regardless of political affiliation. It certainly makes them less likely to support this plan and the Republican Congress members who passed it.
And while it’s true that the SALT deductions tend to be biggest in the coastal states – such as California, New York and New Jersey – at the county level the impacts creep inward to swing states.
The 50 counties with the highest median SALT amounts include six counties in Pennsylvania, Wisconsin and Minnesota, three of which voted for President Donald Trump in 2016.
State
County
SALT Amount
ACP Type
2016 winner
MN
Carver
$7,643.82
Exurb
Trump
WI
Ozaukee
$7,564.69
Exurb
Trump
PA
Chester
$6,666.00
Exurb
Clinton
PA
Montgomery
$6,399.52
Urban Suburb
Clinton
MN
Hennepin
$6,302.26
Big City
Clinton
WI
Waukesha
$6,196.59
Exurb
Trump
That’s not a lot of places, but if the 2020 presidential election is as close as the 2016 race was, those numbers could matter, possibly quite a bit. And in some of these areas, all around major urban centers, there may be angry, disheartened Republicans who either stay home or voice their objection at the ballot box in November.
To be clear, the SALT issue is not over. Three states have filed suit against the federal government arguing that the new law “preempts the states’ ability to govern by reducing the ability to provide for their own citizens” and unfairly targets some states because of their higher state tax rates.
But in its current form the SALT provisions of the new tax law only seem likely to harden the community voting patterns the ACP has been noting for some time.
The Big Cities and Urban Suburbs, which have long been solidly Democratic, will have more reason to lean that way. And the Republican-heavy Exurbs, which have been somewhat skeptical of the Trump-led GOP, will have more reason to doubt the party.