
America in 2025: Survey Finds Steady Concerns Amid Constant National Change
Editor’s note: The American Communities Project partnered with the Associated Press on the release of the survey. Click to visit the AP’s story on the findings.
Much has changed in the United States in the past year… and much hasn’t.
The new leadership in the White House has not only altered the partisan tilt of Washington but also challenged fundamental norms across the country down to the local level. There have been massive shifts in immigration enforcement and big moves in education funding. Tariffs and political tensions have risen. Tens of thousands of government workers have been let go.
And the American people have noticed the tumult, according to this year’s survey on the fragmentation in society from the American Communities Project. Across the 15 community types that the ACP studies, there are big differences in how people see the direction of the country today compared with 2024.
Yet for all the froth at the top of the American cultural/political scene, there is a more static set of concerns underneath. Worries about rising prices have not abated. Most Americans across the board still see a “rigged” economy. And there is a deep distrust for both political parties and the media.
Those two seemingly contradictory experiences — a country trying to handle dramatic change, while struggling with deeper unmoving problems — are behind many of the results in this year’s survey of 5,400 Americans, conducted by Ipsos and funded by the Robert Wood Johnson Foundation.
If one were to summarize the findings of the 2025 survey, it would be that the divisions in the country are more obvious than ever, particularly around social issues. But the American people, and the many communities they call home, seem united around the idea that the economy is at best uncertain and at worst sliding downhill.
Some Key Takeaways
- This year found dramatic shifts in the community types about hope for the future of the country. Most of the community types that voted for Donald Trump saw big jumps in hopefulness, while types that did not vote for him saw smaller declines. Hispanic Centers, which voted for Trump, also saw declines.
- People saw big changes at the community level in some places, most for the worse. Inflation looked worse everywhere. Tariffs less so but the changes still felt negative. Immigration was more mixed, with fewer changes and not all for the worse.
- Inflation dominated as a top issue nationally and locally across the board for the third consecutive year. Homelessness is still resonating as a top issue at the local level. Government and business corruption took a big jump as a national issue from 2024 to 2025; gun violence and crime stayed relatively low.
- In a deeply divided country, AI has emerged as an area of agreement. In no community did a majority see its potential future impact as positive on any issue — from daily life to livelihoods to children. And strong majorities in every type want more government regulation of AI.
Peruse the full slide deck here. >ACP Year 3 Presentation November 2025 1
Poll Methodology
This American Communities Project/Ipsos poll was conducted August 18–September 1, 2025, using Ipsos’ probability-based KnowledgePanel® and from August 18–September 4, 2025, using an RDD telephone sample. The poll was conducted among a sample of 5,489 Americans aged 18 or older, with 4,889 surveys completed online and 600 interviews conducted via telephone. For the online portion, the survey was conducted using the probability-based Ipsos KnowledgePanel® and fielded in both English and Spanish. The RDD Telephone portion was conducted in English in the Native American Lands and Aging Farmlands. The Native American Lands and Aging Farmlands were excluded from some questions because the RDD mode of questioning made the survey too long. The data were weighted to U.S. Census targets in each area segment and at the national level. A fuller methodology can be explored here: ACP Methodology Statement November 2025
A note about how to read these data
The ACP’s community types were created by collecting and analyzing 36 different data points across all the 3,100-plus counties in the United States. The result is 15 different kinds of community spread across the United States. Some are regionally clustered, and others are scattered. You can see all the types mapped and explained below.
(Click type names to see more on each.)
| African American South: Places with large African American populations. Lower incomes and higher unemployment. Home to more than 13 million people. | Exurbs: Wealthy communities usually on the edge of metro areas, Largely white with lower crime rates. Home to more than 31 million people. | Military Posts: Located around military installations. Younger, middle-income, diverse communities. Home to more than 9 million people. |
| Aging Farmlands: Sparsely populated and overwhelmingly white. Low unemployment, agricultural economy. Home to more than 1.1 million people. | Graying America: Places with large senior communities. Generally rural and less diverse, middle-income. Home to more than 16 million people. | Native American Lands: Places with large Native American populations. Young communities with lower incomes. Home to more than 900,000 people. |
| Big Cities: Counties holding the nation's largest cities. Dense and diverse. Home to more than 81 million people. | Hispanic Centers: Large Hispanic populations in mostly rural communities. Younger with lower incomes. Home to more than 17 million people. | Rural Middle America: Largely rural and white communities. Middle income and average educational attainment. Home to more than 24 million people. |
| College Towns: Urban and rural communities that are home to campuses and college students. Home to more than 24 million people. | LDS Enclaves: Places dominated by Latter-day Saints adherents. Younger and middle-income. Home to more than 3.5 million people. | Urban Suburbs: Educated and densely populated communities around major metros. Racially and economically diverse. Home to more than 70 million people. |
| Evangelical Hubs: Places with above-average numbers for evangelical adherents. Largely Southern with fewer college grads. Home to more than 9.8 million people. | Middle Suburbs: Middle-income, blue-collar communities mostly around metro areas. Home to more than 12 million people. | Working Class Country: Rural, blue-collar communities. Low incomes and college graduation rates. Home to more than 10.5 million people. |
Changes in Hopes for the Future
In the 2024 ACP survey, we noted sharp differences between how people felt about their personal future and the future of their community (generally positive) and the future of the country (considerably less positive). That trend appears in this year’s survey as well, but with one big additional finding in 2025. There are large swings in feelings about the future of the country in different communities.
Generally, in 2025, community types that voted for President Donald Trump in 2024 are feeling much more positively about the future of the United States in the short- and long-term. Meanwhile, places that voted for Democrat Kamala Harris are feeling somewhat less positively.
One exception to that standard red/blue understanding of politics is the Hispanic Centers. The presidential vote in these counties flipped in 2024. They voted for Joe Biden narrowly in 2020, by 2 percentage points, but voted for Trump by 10 points in 2024. And yet, in 2025, they feel less positively about the future of the United States in the short- and long-term than they did last year. (We’ll detail that change below.)
Blue and Red Differences
First, consider the feelings about the future of the United States in the “next few years.”
Only four community types in the ACP voted for Harris in 2024, including the two most populous. All four saw declines in being hopeful for the future. The other Trump-voting community types largely moved to being more hopeful about the nation’s short-term future.
Perhaps more interesting, the positive shifts in some Trump-voting communities were massive — 19 points in Aging Farmlands and 16 points in Evangelical Hubs, Native American Lands, and Rural Middle America. Meanwhile, most of the Democratic-leaning communities said they feel less positively than they did in 2024, but the dips were mostly smaller — 4 points in the African American South and Urban Suburbs, 1 point in College Towns. Big Cities were more dour — their positive feelings dropping by 10 points.
What’s behind the differences in the changes in Democratic-leaning communities and Republican-leaning places? It could be that four years of Joe Biden’s presidency had already left Democrats disheartened by 2024. Or it could be that Democratic-leaning communities are naturally less optimistic about the nation’s future because of other concerns, such as climate change.
Whatever the reason, that red/blue split appeared again when the question turned to the long-term future of the United States.
Some of the year-over-year moves are smaller. Consider the positive shift in Evangelical Hubs and the negative shift in Big Cities. Some of the moves are larger, such as the increased positive feelings in Working Class Country and Graying America. But all those differences may be about Donald Trump’s limited time in office, which some communities may see as bad news and others may see as good news. Regardless, the overall red/blue pattern largely holds.
Except for the Hispanic Centers.
Hispanic Centers
These 178 counties are of special note because of the massive shift in their presidential vote. In 2020, Joe Biden won them by about 2 percentage points. In 2024, Donald Trump carried them by 10 points. That’s a flip and 12-point shift in four years.
And yet, in this poll they are a true outlier. In 2025, residents in Hispanic Centers said they feel less hopeful about the future of the United States in the short-term (by 4 percentage points) and the long-term (by 8 percentage points) than they did in 2024, even though they voted for Trump.
What’s going on in the data? These numbers suggest there may be some buyer’s remorse in those communities and immigration may be playing a role.
President Trump’s short time in office in this second term has been marked by massive changes on a variety of fronts — tariffs, government layoffs, budget cuts. But it will take time for the general population to feel the impacts of some of those policy moves. They are slow-moving by their nature. The administration’s efforts around immigration, however, have been different. The impacts have been much more immediate and have generated a lot of headlines and dramatic video. Those efforts have also largely targeted the nation’s Hispanic/Latino population. Taken together, it’s reasonable to think those changes could be a big part of the drop in hopefulness in Hispanic Centers.
Beyond this survey, there have been other signs of a broader partisan shift among Hispanic voters. In the 2025 New Jersey governor’s race, Democrat Mikie Sherrill flipped Cumberland County, the state’s only Hispanic Center county, on her way to winning her race. Cumberland, which is 36% Hispanic, voted for Trump by about 4 percentage points in 2024, then voted for Sherrill by about 4 points in 2025. Exit polls showed Hispanic voters backed the Democratic candidates for governor in New Jersey and Virginia with 68% and 67% of the vote, respectively.
The ACP will be diving into the Hispanic Centers more in the coming year to further explore the changes here. There could be drivers beyond immigration. For instance, these communities also tend to have lower incomes and are more susceptible to the problems that come with inflation. But changes around immigration enforcement seem likely to be a big issue here.
Changes in Issues at the Community Level
The last year has brought big shifts on a variety of issues. To better understand what those changes look like in the ACP’s 15 community types, the survey asked respondents if they had noticed changes in their communities in seven key areas: inflation, tariffs, immigration, K-12 education, infectious disease outbreaks, higher education, and vaccine availability. And if they had noticed changes, the survey asked if they were “mostly positive,” “mostly negative,” or a mix of both.
Three issues stood out: inflation, tariffs, and immigration. Nationally, at least 50% of respondents said they had noticed changes on these issues. But which communities noticed changes and their attitudes toward the moves varied by community type.
Inflation
Of all the topics we measured, inflation was striking for being a common area of agreement. In every one of the ACP’s 15 community types, overwhelming majorities said inflation or rising prices had changed as an issue in the last year. And in all the types, solid majorities said the changes had been negative.
The range of respondents noticing a change on inflation went from a low of 76% in Working Class Country to a high of 90% in LDS Enclaves. In 13 of the 15 community types, 70% or more respondents said the changes were negative.
The ACP looks at a lot of data through the lens of its 15 types, and it is rare to find large areas of agreement among them. Inflation as a major problem has been a consistent point of agreement over the three years of this survey. But the responses on this question in particular stand out because even with a new president at the helm in a deeply divided country, people in all the community types believe inflation is a problem and it’s not getting better. The data suggest that the issue of inflation and/or rising prices is big enough to cut through the partisan divides in the country.
Of course, who people in each of these communities blame for inflation is a very different question that would likely generate different answers. And knowing what we know about incomes in the 15 community types, they are likely experiencing inflation differently. Still, finding common ground on a big topic is a rarity. In 2025, inflation looks like a broadly potent issue in politics.
Immigration
On the opposite end of the spectrum, immigration stands out as an issue that generates much less agreement. Nationally, 51% of those surveyed said they’d noticed changes in immigration in their communities, but at the individual community level there were wide discrepancies. Even among those who noticed changes, many communities did not see the changes as negative.
Hispanic Centers and Big Cities, two community types with large immigrant populations, led the way on this question, with 65% in each saying they had noticed changes. They were also the communities with the largest numbers saying the changes they noticed were negative.
But there were also seven community types where less than 50% of respondents said they noticed changes around immigration in their communities. And among those seven, there were four community types in which less than 40% of respondents said the changes were negative — Evangelical Hubs, Native American Lands, Rural Middle America, and Working Class Country. Those types have some of the smallest Hispanic populations in the ACP.
The data show how divisive immigration remains in the United States, and news consumption habits likely have something to do with that divisiveness. Depending on where one consumes news, the Trump administration’s changes in immigration enforcement may be portrayed as big, scary government overreach or as law enforcement at work.
A few points of note. Hispanic Centers again seem to be an outlier here. They voted for Trump but are still among the most unhappy with changes in immigration. And other Trump-voting communities had concerns. The thoroughly conservative LDS Enclaves, which are mostly based in Utah and also have larger Hispanic populations, saw negative changes in immigration. In Aging Farmlands, fewer people noticed changes in immigration in their communities, but the ones who did were more likely to see negative changes.
Tariffs
The beginning of Trump’s second term has been marked by a lot of talk about and activity around tariffs. They’ve been added, then removed, then added again, and they target most of the globe. But measuring the community impact of tariffs is not easy. It can be done by looking at rising prices on the shelves at Walmart or by looking at the struggles of local businesses.
Still, 57% of respondents nationally said they noticed the impacts in their communities and, perhaps more noteworthy, the people who noticed overwhelmingly saw the impacts as negative. (Note: Aging Farmlands and Native American Lands were not asked this question due to cost and time constraints.)
The numbers on tariffs are among the most interesting because they break through some traditional red/blue divides. Of the six community types standing above the 57% national average that noticed a change on tariffs, three voted for Democrat Kamala Harris in 2024 (Big Cities, Urban Suburbs, and College Towns) and three voted for Trump (LDS Enclaves, Military Posts, and Hispanic Centers). To be clear, the 15 community types come from different places economically and have different needs. Where tariffs are concerned, some may rely more heavily on imports than others as consumers, while others lean on manufacturing and may be getting squeezed on production costs. But the red/blue split among the communities noticing tariff impacts suggests, again, that economic concerns rise above the nation’s deep partisan dynamics.
While it may be hard to nail down the specific impacts of a policy as broad as tariffs, the percentage of people in each type who see the changes around tariffs as negative is high across the board, from 60% in Working Class Country to a massive 84% in College Towns.
Again, that kind of agreement is not common in the 15 community types that the ACP studies. For all the big changes the Trump administration has made since the January inauguration, changes around the economy seem to carry the biggest and farthest-reaching impacts on how people perceive the White House and its agenda.
Most Important Issues Facing Your Community, Now and Then
Affordability has indeed been a unifying issue for Americans. As was true for the 2023 and 2024 surveys, inflation or increasing costs was No. 1 when residents were asked to identify the “most important issues facing your local community.” Nationwide, 50% of residents said inflation or increasing costs. For LDS Enclaves, the figure reached 64%, the highest among the 15 types. Rural Middle America, Exurbs, and Urban Suburbs hovered in the mid-50s. In the African American South, 40% of residents said inflation was one of the most important issues facing their local community. Higher costs continue being felt across income strata.
But after the top spot, variance emerged in the second and third most important community issues. In the African American South, 35% of residents said crime or gun violence, just below the figure for inflation. In Big Cities, Hispanic Centers, and College Towns, homelessness/housing insecurity was the second most salient community issue at 31%, 28%, and 27%, respectively. All have higher youth and young adult populations.
Meanwhile, taxes were the No. 2 community issue in 2025 for six community types of various sizes, geographies, education and income levels — Exurbs, LDS Enclaves, Middle Suburbs, Military Posts, Rural Middle America, and Urban Suburbs.
But one of the big stories in the data is how those second and third most important issues have and have not evolved over the past three years.
In the African American South, for instance, crime/gun violence has held as the second most important issue in all three years of surveys by ACP/Ipsos. It seems these Southern communities are facing different challenges than other places.
For College Towns and Hispanic Centers, 2025 was the third consecutive year that homelessness/housing insecurity was the No. 2 community issue, suggesting more of a chronic challenge in those places. Big Cities also see homelessness as a more consistent problem. It was the No. 2 issue in 2025 and 2024. Crime was the No. 2 issue in 2023, as the country was still emerging from the Covid-19 pandemic.
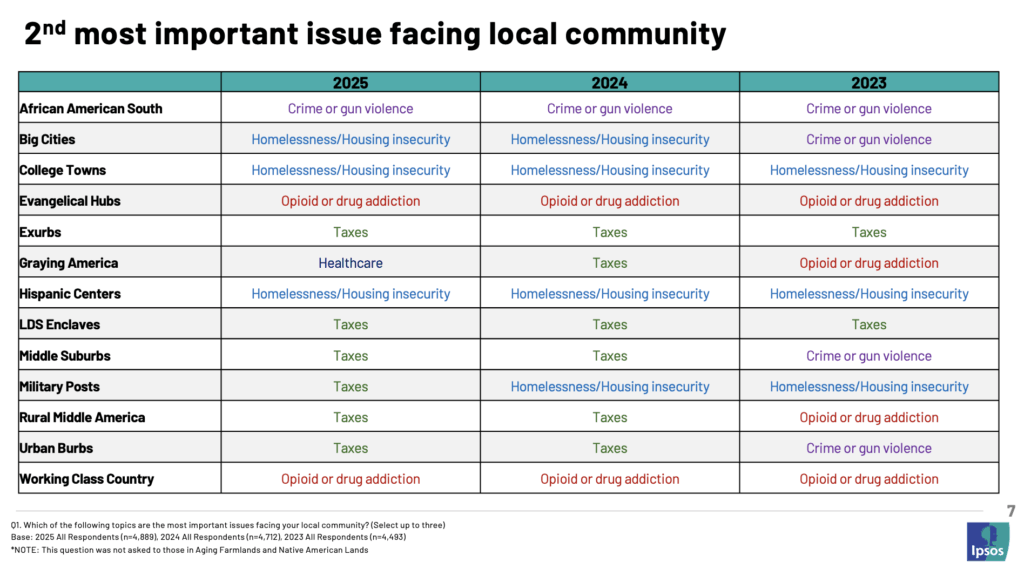
In lower-income, rural, mostly white areas, drug use remained top of mind. Residents in Evangelical Hubs and Working Class Country said opioid or drug addiction was the No. 2 community issue. In both community types, this issue also ranked No. 2 in 2024 and 2023.
For Graying America, the No. 2 issue has shifted each year. Healthcare was No. 2 in 2025. Taxes were No. 2 in 2024, and opioid or drug addiction was No. 2 in 2023.
Most Important Issues Facing the Nation
For Americans, increasing costs also continue to be the top national problem in 2025. Residents were asked to choose up to three of the most important issues facing the nation from the following (which were the same options in the local community):
- abortion
- climate change
- contagious disease (Covid-19, RSV, etc.)
- crime or gun violence
- economic inequality
- education
- election security or fraud
- foreign conflicts or terrorism
- government or business corruption
- government budget and debt
- healthcare
- homelessness/housing insecurity
- immigration
- inflation or increasing costs
- natural disasters or severe weather
- opioid or drug addiction
- political extremism or polarization
- race and racism
- taxes
- unemployment
Across communities, people said inflation or increasing costs is the No. 1 issue facing the nation. (This was true in 2023 and 2024 as well.) For most communities, the percentage was in the low-to mid-40s. For Big Cities, it was slightly lower at 37%.
Government or business corruption has jumped as a national issue of concern from 2024 to 2025. This year, 23% of Americans cited it as a top-three issue. Last year, just 14% did. Leading the shift were dense, multicultural populations that did not vote for President Trump. Big Cities leaped 14%, while Urban Suburbs jumped 13% and the African American South 12%. However, corruption also rose as an issue in places that did vote for Trump, including Hispanic Centers, LDS Enclaves, and Military Posts.
Concerns about America’s social fabric and political culture continue across communities. Political extremism or polarization ranked as the second most important national issue at 27%. Last year, the percentage was 26%, but the ranking was third behind immigration. In 2023, 26% cited the issue. The issue’s salience echoes recent national polling.
Drilling down to the community level, LDS Enclaves, Mormon-dominated, rural-oriented places in the interior West, stood out from the pack. Here 39% of residents said political extremism or polarization was one of the most important issues facing the nation. In 2023, 30% said so. This year, political extremism was also reported as a top-tier concern in both the Urban Suburbs and Big Cities. College Towns, where protests and speech have been fraught, came in just behind.
Less surprisingly given the intense political focus and media coverage these past several years and the continuing ICE raids today, immigration was considered the No. 3 most important national issue. Overall, 26% of residents said immigration was a top-three issue facing the nation. Some communities with the greatest concerns were those with fewer immigrants: Evangelical Hubs at 33%, Graying America at 32%, Rural Middle America at 31%, and Middle Suburbs at 30%. At the same time, 30% of residents in Hispanic Centers, where an average of 53% self-identify as Hispanic, said immigration was one of the most important issues facing the nation.
Many Concerns About AI
So much of the ACP’s work centers on the differences in the 15 community types, but there are some issues that cut across all of them. Attitudes about artificial intelligence fit into this category.
The latest ACP/Ipsos survey shows how AI has been integrated into American life, less than three years after the arrival of ChatGPT. Among the 90% of Americans familiar with generative AI platforms, such as ChatGPT, Gemini, Copilot, and Claude, nearly half, 47%, said at least every two weeks they use these platforms. In Urban Suburbs and Big Cities, more than 50% of residents said they use them. In many communities, significant numbers reported using generative AI daily and weekly.
In very rural places, using generative AI tools every two weeks is less commonplace — just 19% in Native American Lands and 22% in Aging Farmlands reported such behavior. Note that the two rural communities were given yes or no options by telephone, and residents interviewed may not be as tech savvy as those in the 13 community types participating in an online panel.
Nonetheless, concerns about AI seem to unify the diverse community types in several aspects. On day-to-day life outside of work, only 37% felt positively about AI’s potential future impact. Feeling slightly more positively than average were Big Cities and Urban Suburbs at 41%, and Exurbs and LDS Enclaves at 42%. These communities contain some of the heaviest regular users today.
Positivity went down from there. Just 23% of residents nationwide rated AI’s potential future impact on children generally as positive. The African American South and Native American Lands, which have endured health and socioeconomic inequalities for generations, conveyed a slightly more hopeful view of AI’s potential future impact on children.
Similarly, anxiety about one’s own livelihood was clear. Just 26% felt positively about AI’s potential future impact on “your ability to earn a living.” Older communities, including Graying America and Evangelical Hubs, felt less positively than the average.
As respondents considered AI’s potential future impact on the U.S. generally, less than one-third, 31%, said they felt positively. The community types typically hovered around this average. And the rural-urban divide wasn’t evident. For instance, two rural communities, the LDS Enclaves and Rural Middle America, were at the high and low ends of the spectrum at 35% and 26%, respectively.
With the wide-ranging concerns articulated, 62% said “AI needs more government regulation.” On this statement, there was again little variance across the 15 types. For Aging Farmlands’ residents, who were asked the question by phone and generally want less government intervention, 55% said AI needs more regulation. In Military Posts and College Towns, 58% and 59% of residents, many of whom are young people of diverse backgrounds, agreed with this sentiment. In this time of cultural divisions, it’s noteworthy that clear majorities across geographies favor more regulation of AI.
Lots Of Work Ahead
The findings reported here represent only a small sample of the recorded responses in this survey. The ACP will write about more of the results in the weeks ahead.
Beyond that, we will be traveling to communities that represent the different types to understand the “whys” behind a lot of these numbers. Surveys can be excellent tools for obtaining a basic understanding of what people think, but they are usually not as good at explaining the thought processes behind those views.
The beginning of 2025 brought a lot of change to the country across a wide range of issues. There is little reason to believe that the pace of change will slow at the end of this year or in 2026. Rather there are signs that dramatic change could be a way of life in the United States for the next few years. The communities the ACP studies will be experiencing and reacting to those changes differently. The only real way to understand the shifts more fully is to talk to the people who make up these 15 community types, and the nation as a whole.