The Populist Right in American Communities
GivingTuesday Data Commons has been running a weekly national survey on generosity in the U.S. these last three years. We track the sharing of time, treasure, talent, and motivation as well as other key factors to understand giving trends. Helping us is an eight-part survey question about one’s worldview that we use to identify people’s place on the U.S. political spectrum, adapted from a Pew Research survey. This coupled with ACP’s county types brought new regional insights about giving — and surfaced clues about the current political landscape.
About the Political Spectrum
Pew outlines nine political types in the U.S., based on a 2021 survey of more than 10,000 Americans. They broadly fit into liberal, conservative, and centrist units:
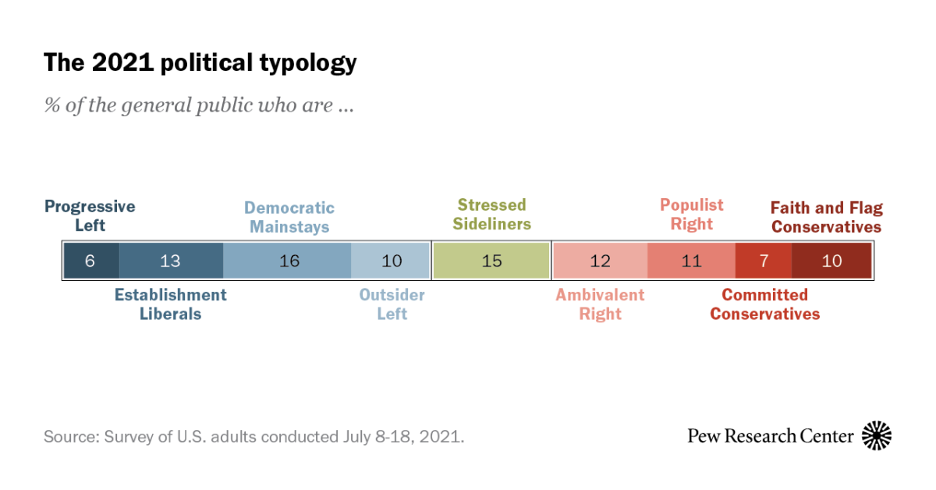
They’ve repeated this survey every three to four years back to 1987, and the groups change size and labels over time, but there are always between six and nine distinct groups.
- The Progressive Left and the Outsider Left believe many of the same things but don’t find the same leaders appealing or representative of themselves.
- Democratic Mainstays are a less fervent version of Establishment Liberals.
- The Ambivalent Right and Outsider Left lean Republican or Democrat on issues but don’t like either party.
- Stressed Sideliners are dominated by economic hardship and are too busy to bother with politics.
- Faith and Flag Conservatives and the Populist Right both combine to form a group that news media typically mean when they talk about the “populist right,” and both overwhelmingly support President Trump.
We’ll dig into the Populist Right here.
Based on our survey of 3,962 people from Q2–Q4 of 2024, you can see that some parts of the country are dominated by one or a few Pew political types, while most others are not. Nowhere does one political worldview have an outright majority.
Table of American Communities on the Political Spectrum
Table description: Prevalence of Pew political types across the American Communities Project types. Numbers represent the percent of respondents for each type per community. For ease of comparison, only the top four Pew types for each community type are shown.
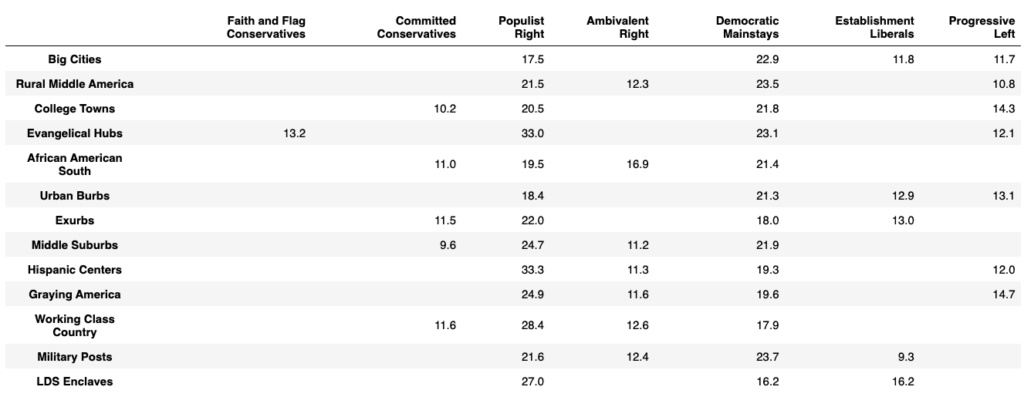 Source: GivingPulse. Note: Stressed Sideliners and Outsider Left don’t appear because they’re not very prevalent in any community type. We’ll discuss them in a future blog post.
Looking at just the Populist Right across ACP types, we can see that Evangelical Hubs form the strongest conservative base (when combined with Faith and Flag Conservatives) but that Hispanic Centers are essentially matched in the percent of people identifying with the Populist Right. Working Class Country and LDS Enclaves are similar.
However, the percentage of populist right support in deeply left-leaning places is far from zero. Nearly 1 in 5 people living in College Towns, Big Cities, and Urban Burbs identify with the Populist Right, even though these are the places they are least prevalent.
What We Know About the Populist Right
- They engage in activism, but not quite as much as others: In Q1 of 2025, 29% of right-leaning Pew-types participated in some form of recent activism (within the last seven days), compared to 37% of people in left-leaning Pew-types, and 31% of centrist groups.
- About 3/4 said they try to help those most in need, even if that means helping people in their own community less. This is one of several questions we ask to gauge shifts in polarizing or depolarizing beliefs/actions in the country. This group is typical of the right for depolarizing beliefs, with Outsider Left highest at 86% support, and Faith and Flag Conservatives the lowest at 69% support.
- About 3/4 of them recently performed a random act of kindness for someone.
- Despite their economic optimism, the Populist Right was among the groups most likely to say “donating money to charities provides too much of a financial strain” on them, at 50% of the group, just behind Stressed Sideliners at 56%.
- We also ask people how much money they gave and to whom. In Q1 of 2025, the Populist Right increased their giving to registered charities, compared to that seen in Q3 and Q4 of 2024. They also decreased political donations over this time, the most of any Pew group. The Populist Right also gave more to help individuals of any of the nine groups in Q1 of 2025 — though they still tend to give more to registered nonprofits.
Another thing we noticed: When combining the three left-leaning groups and the three right-leaning groups into “liberal” and “conservative,” there is basically no difference between their rates of giving in Q1 of 2025 (see our full report). The story only appears when you start looking at how people with different worldviews (but not voting patterns) behave. It’s why we found asking about voting, party affiliation, or liberal/conservative to be less useful in understanding what affects one’s willingness to contribute in their community.
We find Pew types and ACP counties useful, but they also present us with a contradiction: Broadly speaking, most (~75%) people aspire to help others and build community across every worldview and community type, with little meaningful variation. Yet on a wide swath of other surveys, people think the world is trending in the opposite direction, and that other people in their community don’t share their same do-good aspirations. We find those perceptions do not match reality. To dig into that perception gap, we’re looking at how one’s media landscape correlates with different perceptions. Stay tuned.
 Marc Maxmeister helps organize and convert the world’s generosity data into meaningful insights into how giving works, and what organizations can do to improve the lives of people served. He brings context from mixed methods field research in Africa, rigor from his Ph.D. work as a molecular neuroscientist, and engineering from past AI-driven startups and nonprofits.